

Abstract
The development of the human neocortex gives rise to a complex cytoarchitecture, grouping together cells with similar structure, connectivity and function. As a result, the six neocortical laminae show distinct molecular content. In schizophrenia, many anatomical and neurochemical changes appear to be restricted to a subset of lamina and/or cell types. In this study, we hypothesized that supragranular (SG; laminae II-III) and infragranular layers (IG; laminae V-VI) of area 46 in the human prefrontal cortex will show distinct and specific transcriptome alterations between subjects with schizophrenia and matched controls. To enhance sample homogeneity, we compared the gene expression patterns of the SG and IG layers of 8 matched middle-aged male subjects with schizophrenia to 8 pairwise matched controls using two replicate DNA microarrays for each sample. The study revealed strong disease-related laminar expression differences between the SG and IG layers. Expression changes were dominated by an overall underexpression of the IG-enriched genes in the schizophrenia subjects compared to normal control subjects. Furthermore, using a diagnosis-blind, unsupervised clustering of the control-derived SG or IG enriched transcripts, the IG-enriched markers segregated the subjects with schizophrenia from the matched controls with a high degree of confidence. Importantly, multiple members of the semaphorin gene family reported altered gene expression, suggesting that the IG gene expression disturbances in subjects with schizophrenia may be a result of altered cortical development and disrupted brain connectivity.
Keywords: DNA microarray, gene expression, cortical layers, laser dissection, postmortem, neocortex, human
INTRODUCTION
Schizophrenia is a devastating brain disorder that affects approximately 1% of the population. The disease is associated with anatomical, molecular and biochemical changes as well as impairment of cognitive function (Goldman-Rakic, 1994) (Elvevag and Goldberg, 2000). Postmortem transcriptome studies of schizophrenia, mostly performed on prefrontal cortical tissue, have uncovered expression alterations in genes responsible for synaptic function, oligodendrocyte development, energy homeostasis and immune/chaperon response (for review see (Iwamoto and Kato, 2006; Mirnics et al., 2006)). However, the vast majority of these microarray studies focused on bulk cortical tissue, where the cellular complexity of the cortical cytoarchitecture was lost in the harvesting procedures.
The human neocortex is organized into six layers that are differentiated by the size and packing density of their constituent neurons. During cortical development, newly born neurons migrate along radial fibers to reach their destination within the cortical plate. This process occurs in an inside-out pattern, where the deep layers are populated first (Angevine and Sidman, 1961; Caviness and Takahashi, 1995; Caviness et al., 1995; Gupta et al., 2002; Job and Tan, 2003; Rakic, 1988; Rakic and Caviness, 1995). Once neurons reach their final destination, they establish their final phenotypes and synaptic partners, resulting in a distinct connectivity across cortical layers and regions (Bannister, 2005; Somogyi et al., 1998): projection neurons of layers II/III mainly project to other cortical regions, layer V cells principally connect to the striatum and brainstem, while those in layer VI send their axons to the thalamus (Bannister, 2005; Lewis et al., 2002; Rockland, 2004).
The neocortex appears to show a subset of restricted, lamina and/or cell type-specific pathology in schizophrenia. Large pyramidal cells of layer III show reduced somal size (Pierri et al., 1999; Rajkowska et al., 1998; Sweet et al., 2004; Sweet et al., 2003); reelin expression deficits are primarily found in the most superficial layers (D’Arcangelo, 2006), and GAD67 mRNA expression deficits are prominent in layers 2-5 and absent in layer 6 of the prefrontal cortex (PFC). Unfortunately, “data-driven” expression studies are rarely applied in a cell-type or lamina-specific manner in studies of schizophrenia, suggesting that many gene expression changes remain unknown to this date.
In our previous study (Arion et al., 2007b), we used laser dissection (capture) microscopy (LCM) and DNA microarray profiling to identify lamina-specific molecular markers in human PFC. After dissection and subsequent transcriptome profiling of supragranular (SG; II-III) and infragranular (IG; V-VI) layers of PFC area 46, we identified >70 SG-IG enriched transcripts. As this technique was able to reliably identify SG and IG transcriptomes in the human PFC, we decided to apply the same strategy to compare the SG-IG transcriptome patterns in the PFC of subjects with schizophrenia and matched controls. Using LCM, we collected brain samples from SG and IG layers of 8 middle-aged male subjects with schizophrenia and 8 pairwise matched control subjects, and compared their transcriptomes using Affymetrix HG_U133plusV2 DNA microarrays – with a goal to obtain an unbiased and in-depth view of SG-IG expression differences in schizophrenia.
EXPERIMENTAL PROCEDURES
1. Human brain samples for LCM study
Eight matched pairs of male control (CNT) and schizophrenia (SCZ) subjects were used in this study (Table 1). Tissue samples of Brodmann area 46 (BA46) of the PFC were obtained from the Conte Center for the Neuroscience of Mental Disorders (CCNMD) Brain Bank Core. All control subjects were determined to be free of brain disorders based on data obtained from clinical records, toxicology studies, neuropathological exam and structured interviews with surviving relatives, as previously described (Pierri et al., 1999). Frozen tissue was sectioned on a cryostat at a thickness of 20 μm on Leica glass slides for membrane-based microdissection (Leica LDM, Leica Microsystems Inc., Bannockburn, USA). The sections were stored frozen up to 30 days at −80°C until they were processed and tissue was harvested by LCM.
Table 1. Human subjects.
To reduce age and gender-dependent variability, 8 matched, middle-aged male (M) pairs of schizophrenia and control subjects were chosen for the current study. The subjects showed no significant difference in age, postmortem interval (PMI), storage time, pH or RNA integrity number (RIN) measured by Agilent Bioanalyzer.
Cohort Subject Characteristics
| Subject Group1 | Case No. | S/R/A2 | PMI3 | pH | RIN | ST4 | Cause of death5 |
DSM IV diagnoses6 Primary |
Cannabis Use |
Antidepressants ATOD7 |
Benzo- VPA ATOD8 |
Antipsychotics ATOD9 |
||
|---|---|---|---|---|---|---|---|---|---|---|---|---|---|---|
| 1 | C | 838 | M/W/58 | 16.5 | 6.8 | 8.0 | 84 | ASCVD | N | |||||
| S | 622 | M/W/58 | 18.9 | 6.8 | 7.4 | 133 | Right MCA infarction |
US | AAR | |||||
| 2 | C | 1047 | M/W/43 | 12.4 | 6.6 | 9.0 | 47 | ASCVD | N | |||||
| S | 640 | M/W/49 | 5.2 | 6.9 | 8.4 | 131 | Pulmonary embolism |
PS | Y | Y | ||||
| 3 | C | 739 | M/W/40 | 15.8 | 7.0 | 8.4 | 118 | ASCVD | N | |||||
| S | 878 | M/W/33 | 10.8 | 7.0 | 8.9 | 90 | Myocardial fibrosis |
DS | ADC | Y | Y | Y | Y | |
| 4 | C | 852 | M/W/54 | 8.0 | 6.9 | 9.1 | 94 | Cardiac tamponade |
N | |||||
| S | 665 | M/B/59 | 28.1 | 6.9 | 9.2 | 110.6 | Intestinal hemorrhage |
PS | ADC | Y | Y | |||
| 5 | C | 794 | M/B/52 | 20.0 | 6.8 | 8.5 | 93 | Cardiomyopathy | N | |||||
| S | 722 | M/B/45 | 9.1 | 6.5 | 9.2 | 119 | Upper GI bleeding |
US | ODR; OAR |
Y | Y | |||
| 6 | C | 700 | M/W/42 | 26.1 | 7.0 | 8.7 | 105 | ASCVD | N | |||||
| S | 533 | M/W/40 | 29.1 | 6.8 | 8.4 | 130 | Accidental asphyxiation |
US | Y | |||||
| 7 | C | 736 | M/W/54 | 15.5 | 6.9 | 8.3 | 105 | ASCVD | N | |||||
| S | 581 | M/W/46 | 28.1 | 7.2 | 7.9 | 123 | Accidental combined drug overdose |
PS | ADC; OAC |
Y | Y | Y | ||
| 8 | C | 630 | M/W/65 | 21.2 | 6.9 | 9.0 | 119 | ASCVD | N | |||||
| S | 566 | M/W/63 | 18.3 | 6.7 | 8 | 125 | ASCVD | US | AAR | Y | Y | Y | ||
Abbreviations by column:
C, normal comparison; S, schizophrenia
A, age in years; B, black; M, male; R, race; S, sex; W, white
PMI, postmortem interval
ST, storage time in months at −80°C
ASCVD, ateriosclerotic cardiovascular disease
AAR, alcohol abuse, in remission at time of death; ADC, alcohol dependence, current at time of death; ODR, other substance dependence, in remission at time of death; OAR, other substance abuse, in remission at time of death; DS, disorganized schizophrenia; PS, paranoid schizophrenia; US, undifferentiated schizophrenia
Antidepressants ATOD; Y, yes
Benzo-VPA ATOD; Benzo: benzodiazepines; VPA, valproic acid
Antipsychotics ATOD; Y, yes.
2. Tissue processing and harvesting for LCM
Slides were hydrated with a graded ethanol series (95%, 75%, 50%), stained in cresyl violet, dehydrated with ethanol (50%, 75%, 95%, 100%), cleared in xylene and air dried using the LCM Staining Kit (Ambion, Austin, USA) according to the manufacturer’s instructions. The slides were then immediately used for microdissection. Tissue sections were microdissected using a Leica AS LMD system as previously described (Arion et al., 2007b). For both SG and IG samples, areas of ~1×1 mm were laser dissected under 4 X magnification. The SG samples included all of layers II and III and the most adjacent border of layer IV. The IG samples included all of layers V and VI. IG and SG tissue were directly collected into lysis solution (Ambion). Total RNA was extracted from these samples using the RNAqueous®-Micro kit (Ambion). Typically, the extraction yielded 20 to 30 ng of total RNA from each sample. The quality of the RNA was assessed using an Agilent 2100 Bioanalyzer. For each human brain, 4 independent samples were collected (2SG + 2IG). Microarray analysis was performed on the total of 64 samples (Figure 1).
Figure 1. Experimental design.

All PFC BA 46 samples were harvested using laser dissection microscopy (LCM). For each of the 16 postmortem subjects (8 SCZ and 8 matched CNT) 4 samples were obtained, 2 from supragranular (SG: laminae II-III) and 2 from the underlying infragranular (IG: laminae V-VI) cortical layers. Each sample was amplified by a single-round isothermal linear amplification and hybridized to a HG_U133plusV2 Affymetrix oligonucleotide microarray. This generated a dataset of 64 arrays, which were subjected to gcRMA normalization and several distinct statistical analyses. In subsequent analyses SG-IG enriched genes were overlaid with the diagnosis comparison, identifying genes SG-IG laminar markers that also showed differential expression in the brain of subjects with schizophrenia.
3. Amplification and microarray hybridization
Biotinylated cDNA samples were synthesized using the OVATION™ isothermal linear amplification system (NuGEN Technologies, Inc, San Carlos, USA) from 15 to 25 ng of total RNA. Following first strand and second strand cDNA synthesis, single-stranded cDNA (sscDNA) was amplified using a proprietary Ribo-SPIA™ linear amplification technology. The resulting sscDNA was fragmented and biotinylated according to the manufacturer’s instructions. The quality of the cDNA before and after fragmentation was assessed using Agilent 2100 Bioanalyzer. Samples were considered appropriate for microarray hybridization if they showed a size distribution of > 1Kb and yielded > 3 μg of sscDNA. The labeled cDNA samples were hybridized to Affymetrix HG-U133 Plus 2.0 GeneChip arrays (Affymetrix Inc., Sunnyvale, USA) using an Affymetrix Genechip Fluidics Station 450. Image segmentation and generation of DAT files were performed using Microarray Analysis Suite 5.0 (MAS5).
4. Data analysis
Segmented images were normalized and log2 transformed using Gene Chip Robust Multi-array Average (gcRMA) (Gentleman et al., 2004; Wu, 2005) by GSEA 2.0. To increase signal strength and reduce noise in our dataset, for both SG and IG sample replicates, we averaged the RMA-normalized intensities of the technical replicates originating from the same subject.
A. Definition of SG and IG enriched genes
Genes were considered SG- or IG-enriched if they reported an |ALR|>1 at p<0.01 in both pairwise (within subject) and groupwise comparisons.
B. Definition of changed gene expression in schizophrenia
Genes were considered differentially expressed if they reported an |ALR|>0.585 (>50% change) at p<0.05.
C. Clustering
Hierarchical clustering was performed on the log2 transformed, gcRMA normalized expression levels using Pearson correlation distance using GenePattern.
D. Data sharing
All microarray data, together with our previous datasets, are available from http://mirnicslab.vanderbilt.edu/mirnicslab/.
RESULTS
To ensure increased sample homogeneity and to minimize the effect of postmortem tissue degradation, we selected only highly intact samples (mean pHSCZ= 6.85; mean pHCNT= 6.83) from middle-aged males (Table 1). The 16 samples included in this study showed exceptional RNA quality judged by RIN number (mean RINSCZ=8.2, mean RINCNT=8.6).
Supragranular gene expression changes in schizophrenia
When the SG transcriptome of subjects with schizophrenia was compared to that of matched controls, we observed 419 probesets that reported differential expression of >50% (|ALR|>0.585) at p<0.05 (for a list of differentially expressed genes see Supplemental Material 1). The significant gene expression inductions outnumbered the transcript reductions by a 1.7:1 margin (266 vs. 153, respectively).
In an independent analysis of the dataset, we also assessed for enrichment of functional gene pathways. This analysis was performed on an unfiltered, normalized dataset in GSEA (Subramanian et al., 2007) using a predetermined set of molecular pathways established by BioCarta or KEGG. Furthermore, searching for TRANSFAC/miRNA databases did not reveal any conclusive enrichments in our SG dataset.
Infragranular gene expression changes in schizophrenia
Comparison of the IG transcriptome between schizophrenia and matched control subjects revealed 1221 gene expression differences. In contrast to the SG data, significant gene expression differences (>50%; p<0.05) in the IG layers were dominated by transcript reductions in schizophrenia by a 4.2:1 margin (988 vs. 233, respectively). For a list of differentially expressed genes see Supplemental Material 2.
Subsequent enrichment analyses, based on predetermined BioCarta, KEGG and TRANSFAC gene sets (Subramanian et al., 2007), revealed no conclusive evidence of differential gene set enrichments (data not shown).
IG-enriched genes classify the samples according to diagnosis
This dataset gave us a unique opportunity to determine if the expression of SG-enriched and IG-enriched genes differed between schizophrenia and matched control subjects. First, we defined a set of genes that reported significant differential expression between the SG and IG layers of all control subjects: 384 probesets reported a >2-fold (|ALR|>1) expression enrichment at p<0.01 in both pairwise and groupwise comparisons, with 158 transcripts enriched in the SG and 226 transcripts overexpressed in the IG layers (Supplemental Material 3).
We then examined the discriminative power of the 158 SG-enriched transcripts to separate the SG-derived samples according to diagnosis. The 158 SG-enriched transcripts did not show differential expression between the schizophrenia and control samples (mean ALR=−0.01, p=0.66) (Figure 2A). Furthermore, when these data were subjected to a two-way hierarchical clustering, the gene expression levels were unable to separate the samples from the two diagnostic classes (Figure 2B). In contrast, the 226 probesets showing enrichment in the IG layers showed a prominent and highly significant reduction of gene expression in the SCZ samples (ALR=−0.49, p<10−40) (Figure 3A). Consistent with this finding, the expression levels of IG-enriched genes correctly separated out the diagnostic classes in a two-way hierarchical clustering (Figure 3B).
Figure 2. SG-enriched genes show no expression change in subjects with schizophrenia.

A. ALRSCZ-CNT distribution of the 158 SG-enriched transcripts. Each symbol denotes a single gene, X axis corresponds to the ALRSCZ-CNT in the SG samples, Y axis shows the mean intensity for each of the IG-enriched genes across all samples. Note that the transcript population ALRs are comparably distributed across the two sides of the unity line, indicating no SG-enriched gene overexpression or underexpression in SCZ samples. B. The dendrogram is derived from GSEA two-way hierarchical clustering of expression levels from the 158 SG-enriched transcripts. The SCZ (red bar) and CNT samples (green bar) could not be separated based on the expression levels of the SG-enriched genes.
Figure 3. IG-enriched genes show a robust expression repression in subjects with schizophrenia.

A. ALRSCZ-CNT distribution of the 226 IG-enriched transcripts. Each symbol denotes a single gene, X axis corresponds to the ALRSCZ-CNT in the IG samples, Y axis shows the mean intensity for each of the IG-enriched genes across all samples. Note the robust shift of the transcript population to the left (underexpression in SCZ). B. The dendrogram is derived from GSEA two-way hierarchical clustering of expression levels from the 226 IG-enriched transcripts. Although the disease status was not the entered in the clustering, IG markers perfectly clustered the SCZ (red bar) and CNT samples (green bar) in the IG samples.
This strong finding in the IG layers of subjects with schizophrenia could be due either to the disease process or the treatment with antipsychotic medications. Using our previously obtained DNA microarray data on non-human primates chronically treated with antipsychotic medications (Akil et al., 1999; Mirnics et al., 2000; Pierri et al., 1999), we compared the expression levels of SG- and IG-enriched genes in the control and treated monkeys. Neither olanzapine, nor haloperidol treatment reported a significant populational expression change in the SG or IG-enriched transcripts (data not shown).
IG-enriched genes that are significantly changed in schizophrenia include critical neurodevelopmental genes
Although the 226 IG-enriched probesets correctly separated the control and schizophrenia samples, not all genes contributed similarly to this phenotypic separation. To achieve maximum discriminatory power, we overlaid the SG-IG enriched dataset with the genes that were differentially expressed in schizophrenia. This identified 51 overlapping gene probes (Table 2), which clustered the schizophrenia and control subjects according to diagnosis (Figure 4). Interestingly, three members of the semaphorin gene family reported robust underexpression in the IG sample (Figure 5): SEMA3E was reduced by 3.2-fold (ALR= −1.68, p=0.0012), SEMA3C by 1.73-fold (ALR= −0.79, p=0.0003) and SEMA6D by 1.90-fold (ALR=−0.93, p=0.0382). Furthermore, SEMA3A and SEMA4D, two additional members of a semaphorin family, reported a similar downregulation trend in the schizophrenia samples (SEMA 3A: ALR= −0.64, p=0.0985; SEMA4D: ALR= −0.55; p= 0.0748).
Table 2. SG-IG enriched genes reporting expression change in schizophrenia.
Probe- Affymetrix probe; Unigene – NCBI Unigene cluster; SG-IG pvalp – SG or IG enrichment pairwise (within subject) p-value; SG_IG pvalg – SG or IG enrichment groupwise (across subject) p-value; ALR SG-IG – average log ratio of enrichment (+ values higher expressed in SG; − values higher expressed in IG); pval SCZ-CNT – p value in diagnosis comparison; ALR SCZ-CNT – average log ratio (magnitude of change) in diagnosis based comparison
| Probe | Gene Name | Symbol | Unigene | SG-IG pvalp | SG-IG pvalg | ALR SG-IG | pval SCZ-CNT | ALR SCZ-CNT |
|---|---|---|---|---|---|---|---|---|
| 228956_at | UDP glycosyltransferase 8 | UGT8 | Hs.144197 | 0.00001 | 0.00837 | −1.06 | 0.00056 | −1.80 |
| 206941_x_at | semaphorin 3E | SEMA3E | Hs.528721 | 0.00000 | 0.00000 | −3.07 | 0.00124 | −1.68 |
| 214586_at | G protein-coupled receptor 37 | GPR37 | Hs.406094 | 0.00001 | 0.00779 | −1.15 | 0.00483 | −1.65 |
| 210839_s_at | ectonucleotide pyrophosphatase/phosphodiesterase 2 | ENPP2 | Hs.190977 | 0.00000 | 0.00352 | −1.13 | 0.00685 | −1.43 |
| 1558971_at | chromosome 6 open reading frame 190 | C6orf190 | Hs.380210 | 0.00000 | 0.00000 | −2.82 | 0.00889 | −1.35 |
| 209631_s_at | G protein-coupled receptor 37 | GPR37 | Hs.406094 | 0.00000 | 0.00085 | −1.12 | 0.00113 | −1.34 |
| 231911_at | KIAA1189 | KIAA1189 | Hs.443894 | 0.00000 | 0.00085 | −1.45 | 0.00943 | −1.30 |
| 1558972_s_at | chromosome 6 open reading frame 190 | C6orf190 | Hs.380210 | 0.00000 | 0.00000 | −4.77 | 0.02248 | −1.27 |
| 204774_at | ecotropic viral integration site 2A | EVI2A | Hs.113874 | 0.00000 | 0.00059 | −1.31 | 0.02316 | −1.24 |
| 221859_at | synaptotagmin XIII | SYT13 | Hs.436643 | 0.00000 | 0.00211 | 1.08 | 0.00411 | −1.21 |
| 230135_at | CDNA FLJ42405 fis, clone ASTRO3000474 | --- | Hs.548089 | 0.00000 | 0.00055 | −1.11 | 0.00411 | −1.19 |
| 205801_s_at | RAS guanyl releasing protein 3 | RASGRP3 | Hs.143674 | 0.00000 | 0.00005 | −1.08 | 0.00004 | −1.18 |
| 222608_s_at | anillin, actin binding protein (scraps homolog) | ANLN | Hs.62180 | 0.00000 | 0.00009 | −1.26 | 0.00338 | −1.14 |
| 221911_at | ets variant gene 1 | ETV1 | Hs.22634 | 0.00000 | 0.00001 | −1.61 | 0.02164 | −1.14 |
| 206135_at | suppression of tumorigenicity 18 (zinc finger protein) | ST18 | Hs.549092 | 0.00000 | 0.00055 | −1.14 | 0.01053 | −1.11 |
| 230360_at | collomin | COLM | Hs.526441 | 0.00000 | 0.00059 | −1.34 | 0.02147 | −1.11 |
| 227289_at | hypothetical protein LOC144997 | LOC144997 | --- | 0.00000 | 0.00055 | −1.09 | 0.02565 | −1.03 |
| 203354_s_at | pleckstrin and Sec7 domain containing 3 | PSD3 | Hs.434255 | 0.00000 | 0.00112 | 1.00 | 0.01662 | −1.01 |
| 226636_at | phospholipase D1, phophatidylcholine-specific | PLD1 | Hs.478230 | 0.00001 | 0.00051 | −1.00 | 0.01256 | −1.01 |
| 1552715_a_at | leucine-rich repeat-containing G protein-coupled receptor 7 | LGR7 | Hs.196119 | 0.00000 | 0.00000 | −1.97 | 0.02298 | −0.94 |
| 233882_s_at | semaphorin 6D | SEMA6D | Hs.511265 | 0.00000 | 0.00009 | 1.36 | 0.03827 | −0.93 |
| 212353_at | sulfatase 1 | SULF1 | Hs.409602 | 0.00000 | 0.00000 | −1.62 | 0.00442 | −0.93 |
| 220345_at | leucine rich repeat transmembrane neuronal 4 | LRRTM4 | Hs.285782 | 0.00000 | 0.00000 | 1.29 | 0.00388 | −0.89 |
| 204036_at | endothelial differentiation, lysophosphatidic acid GPCR 2 | EDG2 | Hs.126667 | 0.00000 | 0.00030 | −1.43 | 0.03418 | −0.89 |
| 218469_at | gremlin 1 homolog, cysteine knot superfamily | GREM1 | Hs.40098 | 0.00000 | 0.00000 | −2.41 | 0.03467 | −0.88 |
| 208358_s_at | UDP glycosyltransferase 8 | UGT8 | Hs.144197 | 0.00000 | 0.00000 | −1.24 | 0.00046 | −0.87 |
| 214063_s_at | transferrin | TF | Hs.518267 | 0.00000 | 0.00009 | −1.56 | 0.04855 | −0.86 |
| 210729_at | neuropeptide Y receptor Y2 | NPY2R | Hs.37125 | 0.00000 | 0.00000 | −1.52 | 0.01948 | −0.81 |
| 227123_at | RAB3B, member RAS oncogene family | RAB3B | Hs.123072 | 0.00000 | 0.00001 | −1.19 | 0.02821 | −0.79 |
| 217452_s_at | betaGlcNAc beta 1,3-galactosyltransferase 2 | B3GALT2 | Hs.518834 | 0.00000 | 0.00000 | −1.88 | 0.01863 | −0.79 |
| 203789_s_at | semaphorin 3C | SEMA3C | Hs.269109 | 0.00000 | 0.00000 | 1.35 | 0.00039 | −0.79 |
| 235183_at | Homo sapiens, clone IMAGE:5312689, mRNA | --- | Hs.548069 | 0.00000 | 0.00000 | −1.93 | 0.04170 | −0.75 |
| 220994_s_at | syntaxin binding protein 6 (amisyn) | STXBP6 | Hs.508958 | 0.00000 | 0.00000 | 1.21 | 0.01118 | −0.75 |
| 219643_at | low density lipoprotein-related protein 1B | LRP1B | Hs.470117 | 0.00000 | 0.00000 | −1.40 | 0.02394 | −0.73 |
| 232001_at | hypothetical gene supported by AY007155 | LOC439949 | Hs.13262 | 0.00000 | 0.00000 | −1.52 | 0.02014 | −0.72 |
| 231174_s_at | Erythrocyte membrane protein band 4.1-like 2 | EPB41L2 | Hs.486470 | 0.00000 | 0.00002 | 1.06 | 0.00617 | −0.71 |
| 236576_at | Transcribed locus | --- | Hs.21375 | 0.00000 | 0.00000 | −1.44 | 0.04600 | −0.69 |
| 204621_s_at | nuclear receptor subfamily 4, group A, member 2 | NR4A2 | Hs.165258 | 0.00001 | 0.00001 | −1.10 | 0.01979 | −0.69 |
| 231804_at | --- | --- | 0.00000 | 0.00000 | −2.29 | 0.02239 | −0.66 | |
| 213183_s_at | Cyclin-dependent kinase inhibitor 1C (p57, Kip2) | CDKN1C | Hs.106070 | 0.00000 | 0.00000 | −1.24 | 0.03902 | −0.64 |
| 241898_at | moderately similar to XP_517655.1 similar to KIAA0825 | Hs.351126 | 0.00000 | 0.00000 | −1.33 | 0.03335 | −0.64 | |
| 215073_s_at | nuclear receptor subfamily 2, group F, member 2 | NR2F2 | Hs.347991 | 0.00000 | 0.00000 | 1.49 | 0.00285 | −0.62 |
| 233002_at | KIAA1622 | KIAA1622 | Hs.259599 | 0.00000 | 0.00000 | 1.42 | 0.01720 | −0.61 |
| 236308_at | hypothetical protein LOC285878 | LOC285878 | Hs.548149 | 0.00000 | 0.00000 | 1.67 | 0.02698 | −0.58 |
| 1568812_at | Homo sapiens, clone IMAGE:5294477, mRNA | Hs.382116 | 0.00000 | 0.00001 | −1.00 | 0.02132 | −0.58 | |
| 238763_at | RNA binding motif protein 20 | RBM20 | Hs.116630 | 0.00000 | 0.00000 | −1.27 | 0.02520 | −0.58 |
| 220313_at | G-protein coupled receptor 88 | GPR88 | Hs.170053 | 0.00000 | 0.00000 | 1.15 | 0.00809 | 0.63 |
| 205428_s_at | calbindin 2, 29kDa (calretinin) | CALB2 | Hs.106857 | 0.00000 | 0.00000 | 1.78 | 0.00015 | 0.82 |
| 206204_at | growth factor receptor-bound protein 14 | GRB14 | Hs.411881 | 0.00000 | 0.00000 | 1.56 | 0.03166 | 0.84 |
| 236677_at | neuroglobin | NGB | Hs.274363 | 0.00004 | 0.00004 | 1.25 | 0.03429 | 0.88 |
| 243337_at | FRAS1 related extracellular matrix 3 | FREM3 | Hs.252714 | 0.00000 | 0.00000 | 2.13 | 0.01395 | 0.95 |
Figure 4. Two-way hierarchical clustering of SG-IG enriched genes that showed differential expression in the SCZ-CNT comparison.
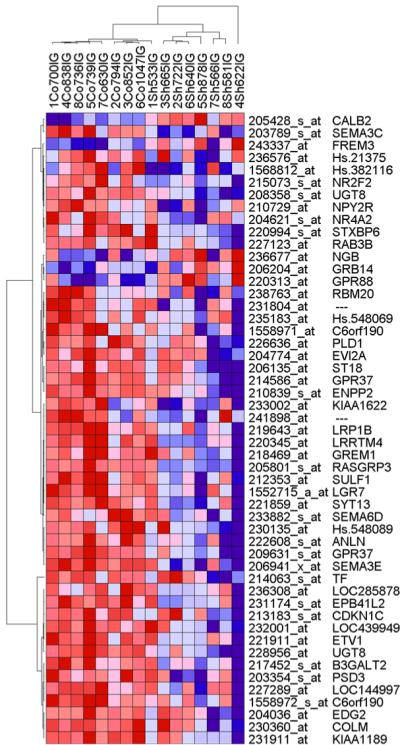
The figure denotes a two-way clustering of the normalized expression levels for 51 SG-IG enriched genes altered in schizophrenia. In the vertical dendrogram, each arm represents a single sample (red-schizophrenia; green – control), rows denote gene probesets with NCBI accession numbers and gene symbols. Each pixel corresponds to a log2-normalized expression level in a single sample. The intensity of red is proportional to transcript increase, while the blue intensity is proportional to transcript decrease. Based on the expression levels of these 61 probe sets, the vertical dendrogram perfectly separated out the schizophrenia (red) and control samples (green). Numeric data is represented in Table 2.
Figure 5. Gene expression profile across subjects for three Semaphorin family members.

In each figure, sample pairs are denoted on X axis (AVG corresponds to mean), Y axis denotes RMA normalized log2 expression level. Blue symbols represent control subjects, red symbols correspond to subjects with schizophrenia. Note the downregulation of all three SEMA genes across the subject pairs.
DISCUSSION
Harvesting and analyzing distinct anatomical regions increases experimental signal:noise ratio, and localizes the molecular deficit to the harvested structure. Using LCM, the present study attempted to identify distinct transcript phenotypic signatures between SG and IG layers in schizophrenia compared to control subjects. We found the following: 1) Both SG and IG layers reported significant gene expression differences in the PFC of the schizophrenia subjects. However, while SG expression differences were dominated by increases in schizophrenia, IG expression changes were mostly characterized by transcript underexpressions. 2) The directionality of the differences in transcript expression was highly concordant between SG and IG. 3) The number of transcripts significantly altered in subjects with schizophrenia was almost three times higher in IG than in SG. 4) Only the IG-enriched markers showed specific alteration in expression (decrease) in subjects with schizophrenia; the SG-enriched transcripts did not. 5) Unsupervised clustering of all the subjects (regardless of diagnosis) using the IG markers (but not the SG markers) correctly separated all the subjects according to their disease status. 6) Gene expression changes in schizophrenia included multiple neurodevelopmental genes. Most prominently, three members of the semaphorin family (SEMA3C, SEMA3E, and SEMA6D) reported robust differential expression, suggesting that this family of genes may play a critical role in the pathophysiology of schizophrenia.
While we believe that the observed gene expression changes are primarily a result of the disease process of schizophrenia, we acknowledge that at least some of the observed transcriptome differences could be an effect of other factors that might not be directly associated with the primary pathophysiological process (e.g. smoking, socio-economic status, or differences in life style).
Study design facilitates novel discovery
As DNA microarrays represent a powerful tool for the analysis of transcript expression, they are now widely used for transcriptome profiling in brain disorders like schizophrenia. However, it has become increasingly evident that this technique finds its limitation both in the quantity and quality of the human RNA samples, as well as the quality of the labeled cDNA or cRNA, that are profiled. In the present study, we addressed most of these concerns by using the following technical parameters: 1) We increased the homogeneity of our samples by using a specific cohort of all middle age males. 2) All subjects had a RIN >7.4, a PMI< 30 hours and a pH> 6.63, insuring good RNA integrity for all our RNA samples (Tomita et al., 2004) (Weis et al., 2007) (Catts et al., 2005) (Li et al., 2004). 3) We used LCM to dissect out SG and IG layers, thus enriching the harvest to cells that are more similar in connectivity and function. 4) We used one single round of ribo-SPIA ss cDNA amplification, enabling us to use nanogram quantities of starting RNA material – avoiding the need for multiple rounds of material amplification, which can result in increased experimental noise (Barker et al., 2005). 5) We used cDNA targets (instead of the classical cRNA targets) increasing binding specificity on the microarrays as cRNA/DNA mismatches tend to be more stable than cDNA/DNA mismatches.
This technical design allowed us to generate a dataset which replicated a number of previously reported gene expression changes in the PFC of subjects with schizophrenia, including inductions in IFITM1, IFITM3, CDKN1A, MEG3, HSPB1 and multiple heat-shock regulated transcripts (Arion et al., 2007a), and reductions in GPR37, PLP1, RGS5, SEMA3A, ERBB4, UBE2G1, UBE2V2, CSNK2A1, QKI, UGT8 or TF (Aberg et al., 2006); (Arion et al., 2007a); (Haroutunian et al., 2006); (McCullumsmith et al., 2007); (Middleton et al., 2002); (Mirnics et al., 2001); (Pongrac et al., 2002); (Aston et al., 2005).
Of the transcripts showing robust differences in our SG/IG dataset only GPR37, SYT13, ETV1 and CALB2 have documented transcript ISH distribution in the human Allen database (http://humancortex.alleninstitute.org). Nevertheless, the distribution of all these transcripts was concordant with our microarray results. In particular, the Allen database reported a strong supragranular CALB2 overexpression in the DLPFC, which was comparable to our findings. Furthermore, the identified of SG- and IG-specific markers in our current study were highly correlated (R2=0.99, p<0.001) with previous reports of lamina-specific transcript distribution in control subjects (Arion et al., 2007b). Finally, in the current dataset, the expression changes we observed for CHI3L1, IFTM1, IFITM3, HSPB1 or MT2A (Arion et al., 2007a) were of greater magnitude than previously reported, suggesting that our overall experimental design increased signal to noise ratio and facilitated novel discovery.
IG-layer specific transcript dysregulation in schizophrenia
Previously performed postmortem studies suggest that schizophrenia is characterized by microanatomical and neurochemical deficits in the SG layers of the PFC. These include reports of somal size reduction of the pyramidal neurons in deep layer 3 (Rajkowska et al., 1998), a diminished density of the GABA transporter-immunoreactive axon cartridges observed mainly in deep layer 3 and layer 4 (Pierri et al., 1999) as well as fewer basilar dendritic spines in deep layer 3 (Glantz and Lewis, 1997), (Garey et al., 1998).
In contrast, the findings of this study highlight robust transcriptome alterations that are specific to IG layer in the PFC of subjects with schizophrenia. Although these differences may have been observed in previous gene expression profiling studies of schizophrenia, due to the use of the bulk tissue, they have never been appropriately assigned to the IG layers.
In a broader context, we hypothesize that the previously reported expression changes in SG and IG in schizophrenia are interconnected such that schizophrenia is characterized by molecular disturbances across all layers of the PFC. We believe that these disturbances are defined by the connectivity of specific neuronal subpopulations across cortical laminae. Importantly, projection neurons in layer III connect with pyramidal cells in layer V, and cells in deeper layers receive input from both thalamic and superficial layers of the cortex (for review see ((Watts and Thomson, 2005) and (Alelu-Paz and Gimenez-Amaya, 2008)). Furthermore, excitatory inputs from layer V target interneurons in layer III. Thus, the previously reported SG pathology could be a consequence of the IG disturbances observed in our current study, ultimately leading to broad and complex molecular disturbances seen across all layers of the DLPFC. This hypothesis can be tested by comprehensive assessment of SG transcriptome and connectivity in transgenic animal models that focus on targeted disruption of IG development.
Alternatively, the observed expression changes could be related to altered cortical development. SG and IG neuron populations are born at different times and exhibit different developmental trajectories (Casanova and Trippe, 2006; Rakic et al., 2009), and thus a given environmental insult could have a different impact on SG or IG layers of the neocortex. This developmental insult may act through two mechanisms: 1) altering the normal expression profile of the cells that settled in their appropriate laminar locations or 2) affecting the developmental stratification across the laminae, resulting in “laminar misplacement” of neurons. Such misplacement could result in an altered phenotype of the inappropriately settled neurons, where they would both retain part of their “original” molecular phenotype and acquire molecular aspects of their “destination” molecular phenotype – and identifying them could represent a significant challenge. A recent study reporting significant association between schizophrenia and gene variants implicated in neuronal migration would be consistent with this hypothesis (Kahler et al., 2008). However, with the possible exception of interstitial white matter neurons, cell counting studies have not consistently found evidence of a maldistribution of neurons in the PFC of subjects with schizophrenia.
Altered expression of the semaphorin gene family
Alterations in the expression of the SEMA3A protein have previously been associated with schizophrenia (Eastwood et al., 2003). However, our study suggests a broader dysregulation of semaphorin gene expression in the PFC of subjects with schizophrenia that involves multiple family members. In mammals, the semaphorins represent a group of more than 20 proteins divided in 7 subclasses according to their structural features. The semaphorins perform a variety of functions including axon and dendrite guidance, axon pruning as well as providing guidance cues allowing neuronal cell migration (for review see (Tamagnone and Comoglio, 2004), (Waimey and Cheng, 2006)). Semaphorins bind to a number of receptors like plexins or neuropilins, but also to a number of small GTPases which regulate cytoskeleton dynamics, a process necessary for cell migration to occur. In our dataset, the altered expression of the SEMA transcripts could be a result of altered developmental patterning of the cortex in schizophrenia, representing a long lasting signature of an early developmental insult sustained by the PFC. Such a signature may include, in addition to the SEMA genes a number of neurodevelopmental genes like IFITM1, IFITM3 (Tanaka et al., 2005), ETV1 (Arber et al., 2000), DGCR8 (Stark et al., 2008) or ERBB4 (Flames et al., 2004), which all reported altered expression in our dataset. Furthermore, schizophrenia susceptibility genes like Reelin, GAD67 (Popp et al., 2009) (Akbarian and Huang, 2006)), NRG1 (Birchmeier, 2009) and DISC1 (Schurov et al., 2004) are also developmentally regulated, further strengthening the neurodevelopmental hypothesis of schizophrenia (Marenco and Weinberger, 2000) (Lewis and Levitt, 2002).
Alternatively, SEMA transcript dysregulation may not only be related to an early developmental insult. The continuous expression of the SEMA transcripts later in life suggests that their role is not limited to early development and the wiring of neuronal circuits. While our understanding of the role of semaphorins in the adult brain is still incomplete, multiple lines of evidence suggest that they are located at the synapse where they could play an important maintenance role and/or be involved in synaptic transmission and plasticity (Burkhardt et al., 2005) (Sahay et al., 2005) (Bouzioukh et al., 2006) (for review see (Mann et al., 2007)). Thus, altered expression of the SEMA genes, though their ability to induce cytoskeleton and potentially axon terminal modifications, may directly impact on synaptic function of the PFC. For example, in mature monkeys SEMA3E is strongly and preferentially expressed in neocortical layer VI, while its receptor, PlexinD1, is expressed in the more superficial layers (Watakabe et al., 2006). Thus, the robust presence of SEMA3E in layer VI could have an inhibitory influence on cortico-cortical interactions between the deep and superficial layers of the cortex. As a result, the semaphorin system could act as a molecular integrator across the various cortical layers, and its imbalance could actively contribute to the disease phenotype.
Finally, the altered expression of some of the SEMA gene family raises the question if any of the SEMA family members are also schizophrenia susceptibility genes. Research findings over the last 10 years indicate that genetic susceptibility to schizophrenia and postmortem changes in the PFC are strongly linked. For example, RGS4, GAD67, DISC1, GABRAB2, GABRAG3, NRG1 and 14-3-3 all show expression alterations in the postmortem brain of subjects with schizophrenia, and these genes have been also implicated as heritable schizophrenia susceptibility genes (Levitt et al., 2006) (Mirnics et al., 2006). Thus, assessing the role of SEMA family members in gene association studies of schizophrenia might represent a promising line of future investigation.
Supplementary Material
Supplemental Material 1. Supragranular PFC expression differences between subjects with schizophrenia and matched controls.
Genes were included in the analysis if they reported a groupwise p<0.05 and |ALR|>0.585 (50% change). Note that the most prominent gene expression changes in the SG were transcript increases, which outnumbered the transcript repressions by a wide margin (74 vs. 17, respectively).
Supplemental Material 2. Infragranular PFC expression differences between subjects with schizophrenia and matched controls.
Genes were included in the analysis if they reported a groupwise p<0.05 and |ALR|>0.585 (50% change). Note that the most prominent gene expression changes in the IG were transcript decreases, which outnumbered the overexpressed genes by a wide margin (46 vs. 311, respectively). This is in a direct contrast with the data originating from the SG layers, where the overexpressed transcripts were more numerous than the underexpressed ones.
Supplemental Material 3. Supragranular-Infragranular (SG-IG) expression differences regardless of diagnosis.
The table list 384 SG-IG expression differences in the human PFC that reported a >2-fold (|ALR|>1, p< 0.01) groupwise and pairwise t-test enrichment in either the SG or IG tissue. 158 probes revealed an overexpression in the SG, while 226 probesets were enriched in the IG layers.
ACKNOWLEGEMENTS
We wish to thank Melissa Macioce and Annie Bedison for outstanding technical assistance, the University of Pittsburgh CCNMD Brain Bank staff for collecting and providing superb brain samples, the CCNMD Clinical Services Core for diagnostic assessment. We also express our deep gratitude to the families of the brain donors studied here who made this research possible. Financial support for this research was provided by Projects 1 (DAL) and 2 (KM) of NIMH Center Grant MH45156 (DAL). Salary support to KM is provided by K02 award MH070786.
Footnotes
Publisher's Disclaimer: This is a PDF file of an unedited manuscript that has been accepted for publication. As a service to our customers we are providing this early version of the manuscript. The manuscript will undergo copyediting, typesetting, and review of the resulting proof before it is published in its final citable form. Please note that during the production process errors may be discovered which could affect the content, and all legal disclaimers that apply to the journal pertain.
REFERENCES
- Aberg K, et al. Human QKI, a potential regulator of mRNA expression of human oligodendrocyte-related genes involved in schizophrenia. Proc Natl Acad Sci U S A. 2006;103:7482–7. doi: 10.1073/pnas.0601213103. [DOI] [PMC free article] [PubMed] [Google Scholar]
- Akbarian S, Huang HS. Molecular and cellular mechanisms of altered GAD1/GAD67 expression in schizophrenia and related disorders. Brain Res Rev. 2006;52:293–304. doi: 10.1016/j.brainresrev.2006.04.001. [DOI] [PubMed] [Google Scholar]
- Akil M, et al. Lamina-specific alterations in the dopamine innervation of the prefrontal cortex in schizophrenic subjects. Am J Psychiatry. 1999;156:1580–9. doi: 10.1176/ajp.156.10.1580. [DOI] [PubMed] [Google Scholar]
- Alelu-Paz R, Gimenez-Amaya JM. The mediodorsal thalamic nucleus and schizophrenia. J Psychiatry Neurosci. 2008;33:489–98. [PMC free article] [PubMed] [Google Scholar]
- Angevine JJ, Sidman RL. Autoradiographic study of cell migration during histogenesis of cerebral cortex in the mouse. Nature. 1961;192:766–768. doi: 10.1038/192766b0. [DOI] [PubMed] [Google Scholar]
- Arber S, et al. ETS gene Er81 controls the formation of functional connections between group Ia sensory afferents and motor neurons. Cell. 2000;101:485–98. doi: 10.1016/s0092-8674(00)80859-4. [DOI] [PubMed] [Google Scholar]
- Arion D, et al. Molecular evidence for increased expression of genes related to immune and chaperone function in the prefrontal cortex in schizophrenia. Biol Psychiatry. 2007a;62:711–21. doi: 10.1016/j.biopsych.2006.12.021. [DOI] [PMC free article] [PubMed] [Google Scholar]
- Arion D, et al. Molecular markers distinguishing supragranular and infragranular layers in the human prefrontal cortex. Eur J Neurosci. 2007b;25:1843–54. doi: 10.1111/j.1460-9568.2007.05396.x. [DOI] [PubMed] [Google Scholar]
- Aston C, et al. Transcriptional profiling reveals evidence for signaling and oligodendroglial abnormalities in the temporal cortex from patients with major depressive disorder. Mol Psychiatry. 2005;10:309–22. doi: 10.1038/sj.mp.4001565. [DOI] [PubMed] [Google Scholar]
- Bannister AP. Inter- and intra-laminar connections of pyramidal cells in the neocortex. Neurosci Res. 2005;53:95–103. doi: 10.1016/j.neures.2005.06.019. [DOI] [PubMed] [Google Scholar]
- Barker CS, et al. Increased DNA microarray hybridization specificity using sscDNA targets. BMC Genomics. 2005;6:57. doi: 10.1186/1471-2164-6-57. [DOI] [PMC free article] [PubMed] [Google Scholar]
- Birchmeier C. ErbB receptors and the development of the nervous system. Exp Cell Res. 2009;315:611–8. doi: 10.1016/j.yexcr.2008.10.035. [DOI] [PubMed] [Google Scholar]
- Bouzioukh F, et al. Semaphorin3A regulates synaptic function of differentiated hippocampal neurons. Eur J Neurosci. 2006;23:2247–54. doi: 10.1111/j.1460-9568.2006.04783.x. [DOI] [PubMed] [Google Scholar]
- Burkhardt C, et al. Semaphorin 4B interacts with the post-synaptic density protein PSD-95/SAP90 and is recruited to synapses through a C-terminal PDZ-binding motif. FEBS Lett. 2005;579:3821–8. doi: 10.1016/j.febslet.2005.05.079. [DOI] [PubMed] [Google Scholar]
- Casanova MF, Trippe J., 2nd Regulatory mechanisms of cortical laminar development. Brain Res Rev. 2006;51:72–84. doi: 10.1016/j.brainresrev.2005.10.002. [DOI] [PubMed] [Google Scholar]
- Catts VS, et al. A microarray study of post-mortem mRNA degradation in mouse brain tissue. Brain Res Mol Brain Res. 2005;138:164–77. doi: 10.1016/j.molbrainres.2005.04.017. [DOI] [PubMed] [Google Scholar]
- Caviness VS, Jr., Takahashi T. Proliferative events in the cerebral ventricular zone. Brain Dev. 1995;17:159–63. doi: 10.1016/0387-7604(95)00029-b. [DOI] [PubMed] [Google Scholar]
- Caviness VS, Jr., et al. Numbers, time and neocortical neuronogenesis: a general developmental and evolutionary model. Trends Neurosci. 1995;18:379–83. doi: 10.1016/0166-2236(95)93933-o. [DOI] [PubMed] [Google Scholar]
- D’Arcangelo G. Reelin mouse mutants as models of cortical development disorders. Epilepsy Behav. 2006;8:81–90. doi: 10.1016/j.yebeh.2005.09.005. [DOI] [PubMed] [Google Scholar]
- Eastwood SL, et al. The axonal chemorepellant semaphorin 3A is increased in the cerebellum in schizophrenia and may contribute to its synaptic pathology. Mol Psychiatry. 2003;8:148–55. doi: 10.1038/sj.mp.4001233. [DOI] [PubMed] [Google Scholar]
- Elvevag B, Goldberg TE. Cognitive impairment in schizophrenia is the core of the disorder. Crit Rev Neurobiol. 2000;14:1–21. [PubMed] [Google Scholar]
- Flames N, et al. Short- and long-range attraction of cortical GABAergic interneurons by neuregulin-1. Neuron. 2004;44:251–61. doi: 10.1016/j.neuron.2004.09.028. [DOI] [PubMed] [Google Scholar]
- Garey LJ, et al. Reduced dendritic spine density on cerebral cortical pyramidal neurons in schizophrenia. J Neurol Neurosurg Psychiatry. 1998;65:446–53. doi: 10.1136/jnnp.65.4.446. [DOI] [PMC free article] [PubMed] [Google Scholar]
- Gentleman RC, et al. Bioconductor: open software development for computational biology and bioinformatics. Genome Biol. 2004;5:R80. doi: 10.1186/gb-2004-5-10-r80. [DOI] [PMC free article] [PubMed] [Google Scholar]
- Glantz LA, Lewis DA. Reduction of synaptophysin immunoreactivity in the prefrontal cortex of subjects with schizophrenia. Regional and diagnostic specificity. Arch Gen Psychiatry. 1997;54:943–52. doi: 10.1001/archpsyc.1997.01830220065010. [DOI] [PubMed] [Google Scholar]
- Goldman-Rakic PS. Working memory dysfunction in schizophrenia. J Neuropsychiatry Clin Neurosci. 1994;6:348–57. doi: 10.1176/jnp.6.4.348. [DOI] [PubMed] [Google Scholar]
- Gupta A, et al. Life is a journey: a genetic look at neocortical development. Nat Rev Genet. 2002;3:342–55. doi: 10.1038/nrg799. [DOI] [PubMed] [Google Scholar]
- Haroutunian V, et al. The human homolog of the QKI gene affected in the severe dysmyelination “quaking” mouse phenotype: downregulated in multiple brain regions in schizophrenia. Am J Psychiatry. 2006;163:1834–7. doi: 10.1176/ajp.2006.163.10.1834. [DOI] [PubMed] [Google Scholar]
- Iwamoto K, Kato T. Gene expression profiling in schizophrenia and related mental disorders. Neuroscientist. 2006;12:349–61. doi: 10.1177/1073858406287536. [DOI] [PubMed] [Google Scholar]
- Job C, Tan SS. Constructing the mammalian neocortex: the role of intrinsic factors. Dev Biol. 2003;257:221–32. doi: 10.1016/s0012-1606(03)00070-8. [DOI] [PubMed] [Google Scholar]
- Kahler AK, et al. Association analysis of schizophrenia on 18 genes involved in neuronal migration: MDGA1 as a new susceptibility gene. Am J Med Genet B Neuropsychiatr Genet. 2008;147B:1089–100. doi: 10.1002/ajmg.b.30726. [DOI] [PubMed] [Google Scholar]
- Levitt P, et al. Making the case for a candidate vulnerability gene in schizophrenia: Convergent evidence for regulator of G-protein signaling 4 (RGS4) Biol Psychiatry. 2006;60:534–7. doi: 10.1016/j.biopsych.2006.04.028. [DOI] [PubMed] [Google Scholar]
- Lewis DA, et al. Specificity in the functional architecture of primate prefrontal cortex. J Neurocytol. 2002;31:265–76. doi: 10.1023/a:1024174026286. [DOI] [PubMed] [Google Scholar]
- Li JZ, et al. Systematic changes in gene expression in postmortem human brains associated with tissue pH and terminal medical conditions. Hum Mol Genet. 2004;13:609–16. doi: 10.1093/hmg/ddh065. [DOI] [PubMed] [Google Scholar]
- Mann F, et al. Semaphorins in development and adult brain: Implication for neurological diseases. Prog Neurobiol. 2007;82:57–79. doi: 10.1016/j.pneurobio.2007.02.011. [DOI] [PubMed] [Google Scholar]
- Marenco S, Weinberger DR. The neurodevelopmental hypothesis of schizophrenia: following a trail of evidence from cradle to grave. Dev Psychopathol. 2000;12:501–27. doi: 10.1017/s0954579400003138. [DOI] [PubMed] [Google Scholar]
- McCullumsmith RE, et al. Expression of transcripts for myelination-related genes in the anterior cingulate cortex in schizophrenia. Schizophr Res. 2007;90:15–27. doi: 10.1016/j.schres.2006.11.017. [DOI] [PMC free article] [PubMed] [Google Scholar]
- Middleton FA, et al. Gene expression profiling reveals alterations of specific metabolic pathways in schizophrenia. J Neurosci. 2002;22:2718–29. doi: 10.1523/JNEUROSCI.22-07-02718.2002. [DOI] [PMC free article] [PubMed] [Google Scholar]
- Mirnics K, et al. Critical appraisal of DNA microarrays in psychiatric genomics. Biol Psychiatry. 2006;60:163–76. doi: 10.1016/j.biopsych.2006.02.003. [DOI] [PubMed] [Google Scholar]
- Mirnics K, et al. Molecular characterization of schizophrenia viewed by microarray analysis of gene expression in prefrontal cortex. Neuron. 2000;28:53–67. doi: 10.1016/s0896-6273(00)00085-4. [DOI] [PubMed] [Google Scholar]
- Mirnics K, et al. Disease-specific changes in regulator of G-protein signaling 4 (RGS4) expression in schizophrenia. Mol Psychiatry. 2001;6:293–301. doi: 10.1038/sj.mp.4000866. [DOI] [PubMed] [Google Scholar]
- Pierri JN, et al. Alterations in chandelier neuron axon terminals in the prefrontal cortex of schizophrenic subjects. Am J Psychiatry. 1999;156:1709–19. doi: 10.1176/ajp.156.11.1709. [DOI] [PubMed] [Google Scholar]
- Pongrac J, et al. Gene expression profiling with DNA microarrays: advancing our understanding of psychiatric disorders. Neurochem Res. 2002;27:1049–63. doi: 10.1023/a:1020904821237. [DOI] [PubMed] [Google Scholar]
- Popp A, et al. Adult and embryonic GAD transcripts are spatiotemporally regulated during postnatal development in the rat brain. PLoS ONE. 2009;4:e4371. doi: 10.1371/journal.pone.0004371. [DOI] [PMC free article] [PubMed] [Google Scholar]
- Rajkowska G, et al. Neuronal and glial somal size in the prefrontal cortex: a postmortem morphometric study of schizophrenia and Huntington disease. Arch Gen Psychiatry. 1998;55:215–24. doi: 10.1001/archpsyc.55.3.215. [DOI] [PubMed] [Google Scholar]
- Rakic P. Specification of cerebral cortical areas. Science. 1988;241:170–6. doi: 10.1126/science.3291116. [DOI] [PubMed] [Google Scholar]
- Rakic P, et al. Decision by division: making cortical maps. Trends Neurosci. 2009;32:291–301. doi: 10.1016/j.tins.2009.01.007. [DOI] [PMC free article] [PubMed] [Google Scholar]
- Rakic P, Caviness VS., Jr. Cortical development: view from neurological mutants two decades later. Neuron. 1995;14:1101–4. doi: 10.1016/0896-6273(95)90258-9. [DOI] [PubMed] [Google Scholar]
- Rockland KS. Connectional neuroanatomy: the changing scene. Brain Res. 2004;1000:60–3. doi: 10.1016/j.brainres.2003.12.036. [DOI] [PubMed] [Google Scholar]
- Sahay A, et al. Secreted semaphorins modulate synaptic transmission in the adult hippocampus. J Neurosci. 2005;25:3613–20. doi: 10.1523/JNEUROSCI.5255-04.2005. [DOI] [PMC free article] [PubMed] [Google Scholar]
- Schurov IL, et al. Expression of disrupted in schizophrenia 1 (DISC1) protein in the adult and developing mouse brain indicates its role in neurodevelopment. Mol Psychiatry. 2004;9:1100–10. doi: 10.1038/sj.mp.4001574. [DOI] [PubMed] [Google Scholar]
- Somogyi P, et al. Salient features of synaptic organisation in the cerebral cortex. Brain Res Brain Res Rev. 1998;26:113–35. doi: 10.1016/s0165-0173(97)00061-1. [DOI] [PubMed] [Google Scholar]
- Stark KL, et al. Altered brain microRNA biogenesis contributes to phenotypic deficits in a 22q11-deletion mouse model. Nat Genet. 2008;40:751–60. doi: 10.1038/ng.138. [DOI] [PubMed] [Google Scholar]
- Subramanian A, et al. GSEA-P: a desktop application for Gene Set Enrichment Analysis. Bioinformatics. 2007;23:3251–3. doi: 10.1093/bioinformatics/btm369. [DOI] [PubMed] [Google Scholar]
- Sweet RA, et al. Pyramidal cell size reduction in schizophrenia: evidence for involvement of auditory feedforward circuits. Biol Psychiatry. 2004;55:1128–37. doi: 10.1016/j.biopsych.2004.03.002. [DOI] [PubMed] [Google Scholar]
- Sweet RA, et al. Reduced pyramidal cell somal volume in auditory association cortex of subjects with schizophrenia. Neuropsychopharmacology. 2003;28:599–609. doi: 10.1038/sj.npp.1300120. [DOI] [PubMed] [Google Scholar]
- Tamagnone L, Comoglio PM. To move or not to move? Semaphorin signalling in cell migration. EMBO Rep. 2004;5:356–61. doi: 10.1038/sj.embor.7400114. [DOI] [PMC free article] [PubMed] [Google Scholar]
- Tanaka SS, et al. IFITM/Mil/fragilis family proteins IFITM1 and IFITM3 play distinct roles in mouse primordial germ cell homing and repulsion. Dev Cell. 2005;9:745–56. doi: 10.1016/j.devcel.2005.10.010. [DOI] [PubMed] [Google Scholar]
- Tomita H, et al. Effect of agonal and postmortem factors on gene expression profile: quality control in microarray analyses of postmortem human brain. Biol Psychiatry. 2004;55:346–52. doi: 10.1016/j.biopsych.2003.10.013. [DOI] [PMC free article] [PubMed] [Google Scholar]
- Waimey KE, Cheng HJ. Axon pruning and synaptic development: how are they per-plexin? Neuroscientist. 2006;12:398–409. doi: 10.1177/1073858406292631. [DOI] [PubMed] [Google Scholar]
- Watakabe A, et al. Binding and complementary expression patterns of semaphorin 3E and plexin D1 in the mature neocortices of mice and monkeys. J Comp Neurol. 2006;499:258–73. doi: 10.1002/cne.21106. [DOI] [PubMed] [Google Scholar]
- Watts J, Thomson AM. Excitatory and inhibitory connections show selectivity in the neocortex. J Physiol. 2005;562:89–97. doi: 10.1113/jphysiol.2004.076984. [DOI] [PMC free article] [PubMed] [Google Scholar]
- Weis S, et al. Quality control for microarray analysis of human brain samples: The impact of postmortem factors, RNA characteristics, and histopathology. J Neurosci Methods. 2007;165:198–209. doi: 10.1016/j.jneumeth.2007.06.001. [DOI] [PubMed] [Google Scholar]
- Wu ZI. Description of gcRMA. Bioconductor. 2005 R.A. [Google Scholar]
Associated Data
This section collects any data citations, data availability statements, or supplementary materials included in this article.
Supplementary Materials
Supplemental Material 1. Supragranular PFC expression differences between subjects with schizophrenia and matched controls.
Genes were included in the analysis if they reported a groupwise p<0.05 and |ALR|>0.585 (50% change). Note that the most prominent gene expression changes in the SG were transcript increases, which outnumbered the transcript repressions by a wide margin (74 vs. 17, respectively).
Supplemental Material 2. Infragranular PFC expression differences between subjects with schizophrenia and matched controls.
Genes were included in the analysis if they reported a groupwise p<0.05 and |ALR|>0.585 (50% change). Note that the most prominent gene expression changes in the IG were transcript decreases, which outnumbered the overexpressed genes by a wide margin (46 vs. 311, respectively). This is in a direct contrast with the data originating from the SG layers, where the overexpressed transcripts were more numerous than the underexpressed ones.
Supplemental Material 3. Supragranular-Infragranular (SG-IG) expression differences regardless of diagnosis.
The table list 384 SG-IG expression differences in the human PFC that reported a >2-fold (|ALR|>1, p< 0.01) groupwise and pairwise t-test enrichment in either the SG or IG tissue. 158 probes revealed an overexpression in the SG, while 226 probesets were enriched in the IG layers.