Abstract
Oxygen vacancies on metal oxide surfaces have long been thought to play a key role in the surface chemistry. Such processes have been directly visualized in the case of the model photocatalyst surface TiO2(110) in reactions with water and molecular oxygen. These vacancies have been assumed to be neutral in calculations of the surface properties. However, by comparing experimental and simulated scanning tunneling microscopy images and spectra, we show that oxygen vacancies act as trapping centers and are negatively charged. We demonstrate that charging the defect significantly affects the reactivity by following the reaction of molecular oxygen with surface hydroxyl formed by water dissociation at the vacancies. Calculations with electronically charged hydroxyl favor a condensation reaction forming water and surface oxygen adatoms, in line with experimental observations. This contrasts with simulations using neutral hydroxyl where hydrogen peroxide is found to be the most stable product.
Keywords: photocatalysis, STM/STS, titania, water, molecular oxygen
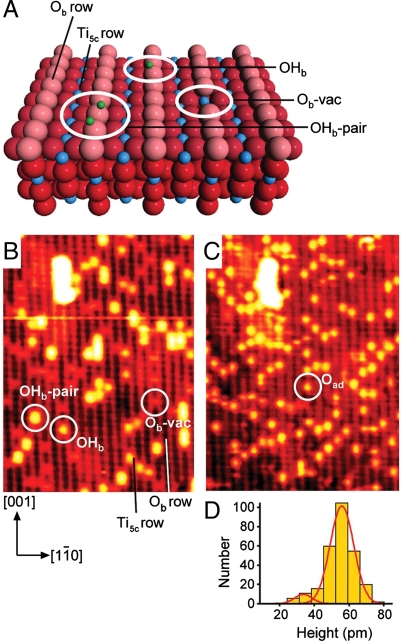
The rutile TiO2(110) surface, which we use as a model photocatalytic system here, is displayed as a ball model in Fig. 1 A. It is characterized by alternate rows of fivefold coordinated Ti (Ti5c) and bridging-O atoms (Ob) that run in the [001] direction. Fig. 1 B shows a typical scanning tunneling microscopy (STM) image of the surface. The Ti5c rows appear bright, and the Ob rows appear dark. Point defects are common on this surface, the vast majority being Ob vacancies (Ob-vac) and surface hydroxyls (OHb). As can be seen in Fig. 1 B, these defects appear as bright spots between the bright Ti5c rows. Ob-vac are known to be particularly reactive, with STM images providing compelling evidence that O2 dissociates at Ob-vac (1, 2) leaving a healed vacancy and one oxygen adatom (Oad) on Ti5c according to ref. 3:
| [1] |
where the reduction of one oxygen atom of O2(g) to one bridging oxide species ( ) is accomplished by oxidation of the two Ti3+ sites associated with Ob-vac to Ti4+ (3), on the basis of a purely ionic model. (Formal charges are written in reactions 1 and 2 to highlight the redox processes involved.)
Fig. 1.
Reaction of O2 with TiO2(110). (A) Ball model of TiO2(110). Red and blue spheres denote O and Ti, respectively. The pink spheres are bridging O atoms, which lie in the [001] azimuth of the substrate. Parallel Ti rows that lie between the bridging-O rows are fivefold coordinated Ti atoms. Green spheres indicate H atoms (from OHb). (B) 130 × 170 Å 2 STM image (V = 1.5 V, I = 0.25 nA) of an as-prepared TiO2(110) surface that contains Ob-vac and OHb. OHb forms from dissociation of water from the residual vacuum at Ob-vac. An Ob-vac, an OHb, and an OHb pair are indicated. (C) The surface in B after exposure to ∼90 L O2 at 300 K. One of the bright spots assigned to Oad is circled. B and C have been smoothed using Image SXM (12) v.1.75. (D) A histogram showing the height distribution of 276 bright spots found on the Ti5c rows fitted to two Gaussian curves. The data are taken from an unsmoothed, larger version of the image in C. The histogram indicates that the reaction products are almost entirely from one species.
The interaction of O2 with OHb, on the other hand, is still a matter of controversy. Following the reaction of these species at temperatures ≤ 240 K, water is seen to desorb at ∼310 K in temperature programmed desorption (TPD) spectra (3, 4). Henderson et al. (3) concluded that this water evolution is a consequence of the formation of oxygen adatoms (Oad) at the surface as follows:
| [2] |
where the two Ti3+ species provide the two electrons necessary to reduce one oxygen atom of O2(g) to H2O(g) (3). In stark contrast to the TPD results, previous calculations find H2O2 to be by far the most stable product (5). Moreover, on the basis of these calculations, water desorption is not expected up to the highest temperature computed, 350 K (5). This discrepancy provided the initial motivation for the present work.
Results and Discussion
We use STM to provide an additional experimental test of the picture that has emerged thus far. Fig. 1 B shows a surface containing both Ob-vac and OHb, alongside the same surface in Fig. 1 C after it was exposed to 90 Langmuirs (L) O2 at 300 K (1 L = 1.33 × 10⁻⁶ mbar·s, 1 mbar = 100 Pa). A number of small, bright spots can be seen on the Ti5c sites (bright rows) in the latter image. The histogram of the height distribution of these bright spots, shown in Fig. 1 D, indicates that these bright spots are almost entirely due to one final product.
It should be noted that at lower O2 exposures we see a number of different types of species on Ti5c rows that are likely to arise from terminal hydroxyls (OHt) and other metastable species such as O2H. These latter results are consistent with previous work (4, 6).
Analysis of the images in Fig. 1 shows that before the reaction with O2 there were about 72 OHb species and 38 Ob-vacs. Following the reaction with O2, about 118 new bright spots are seen on the bright Ti5c rows in Fig. 1 C. As it is well known that Oad form after exposure of Ob-vac to O2 (1, 2, 7 –9), we conclude that Oad also forms from exposure of OHb to O2, in line with the conclusions of Henderson et al. (3). Moreover, the availability of only 72 H atoms rules out the possibility that the products in the present case are OHt (4, 6).
There is, however, a subtle but crucial discrepancy between our observations and the conclusions of Henderson et al. (3). With a starting point of 38 Ob-vacs and 72 OHb, we would expect each Ob-vac to yield one Oad (reaction 1) and each OHb to yield half an Oad (reaction 2), i.e., only 74 Oad in total compared to the 118 found in the experiment. Because the availability of electrons from reduced TiO2 is a prerequisite for O2(g) dissociative adsorption on TiO2(110) (3, 5), the extra Oad found in Fig. 1 C require the TiO2 sample to supply more electrons than expected on the basis of the number of Ob-vac (2Ti3+) and OHb (1Ti3+) initially present.
Thus, the assignment of the adsorbates in Fig. 1 C to Oad and the interpretation of TPD results (3) challenge the current theoretical understanding of the surface chemistry of TiO2(110). Even using a hybrid HSE06 approach (10, 11), which is expected to describe more accurately than other functionals the electronic structure of metal oxides, we also predict that H2O2 is overwhelmingly the most stable product of the reaction between O2 and OHb. This result, which is inconsistent with the TPD data, mimics that found in previous simulations (5).
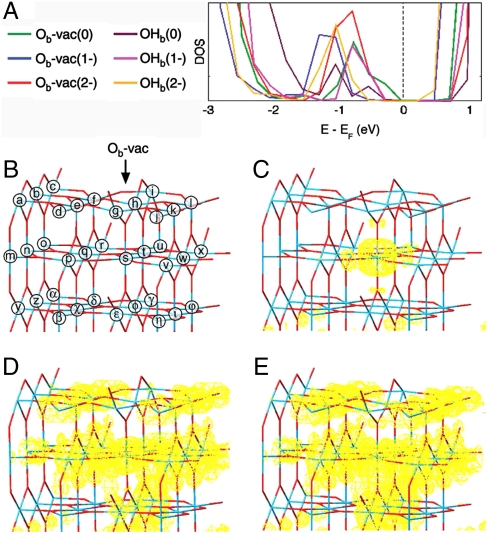
It turns out that we can only model Oad as the most stable product when we allow excess electronic charge to accumulate at the Ob-vac and OHb (see Fig. 2), the latter being formed by reaction of water molecules with Ob-vac. The presence of extra electrons at Ob-vac/OHb originates from occupation of additional 3d electron states arising from polaronic distortion at both Ob-vac and OHb sites. As we discuss later, the excess electronic charge is not pinned directly at the Ob-vac but is rather found localized at a number of reduced Ti sites around the vacancy (see also Fig. S1). High affinities for both surface and bulk electron polaron trapping have been reported for substrates such as HfO2 (13) and SiO2 (14). This has been used to explain a number of surface properties, such as SiO2 discharge phenomena, although not the surface chemistry.
Fig. 2.
Calculated electronic structure of Ob-vac and OHb. (A) The total density of states for the optimized layers in the presence of different amounts of extra electronic charge. (B) The TiO2(110) surface shown as a stick model where the blue intersections indicate Ti sites and the red intersections indicate O sites. The arrow points at the Ob-vac and each Ti atom is labeled. The global charge density of the BGS is shown in yellow (10-6 e Å -3) for Ob-vac(0), Ob-vac(1 - ), and Ob-vac(2 - ) in C, D, and E, respectively.
Various spectroscopies suggest that Ob-vac introduces electronic states into the band gap about 1 eV below the conduction band (CB) onset (3, 15, 16). These band gap states (BGS) are known to have d character (15). The BGS persist even when the Ob-vac are replaced with OHb formed by water dissociation at the Ob-vac (3, 15). In our calculations, regardless of the number of electrons occupying the BGS [2 electrons (e) for Ob-vac(0), 3e for Ob-vac(1 - ), 4e for Ob-vac(2 - ), 1e for OHb(0), 2e for OHb(1 - ), 3e for OHb(2 - )] we find that the energy remains close to 1 eV below the CB onset (Fig. 2 A). The extra electrons, however, drastically affect the spatial distribution of the associated 3d electronic density. While for Ob-vac(0), the simulations suggest a subsurface localization immediately beneath the defect site (Tis in Fig. 2 B), the presence of one and two extra electrons induces an electronic reorganization that moves electronic charge away from the Ob-vac site and the corresponding Ob row (see Fig. 2 D and E). In line with other hybrid DFT results for Ob-vac in high-k dielectrics (13, 17), an analysis of the Ob-vac induced changes in the global electronic distribution reveals symmetry breaking at the defect site (details are shown in Fig. S2). This is discussed in more detail below.
We now consider the possible origin of the additional electronic charge. Given the ease of electron transfer in TiO2 (18, 19) with reported barriers as low as 0.09 eV and mobilities as high as 5.24 × 10⁻² cm2 V-2 s-1, it is reasonable to expect interstitial Ti (Tiint)-donated electrons to diffuse comparatively freely within the system (20). To test the hypothesis that they will, in this case, diffuse toward the Ob-vac/OHb sites at the surface, we also modeled a much larger unit cell (8 trilayers) with inclusion of one initially neutral Tiint atom. The increased size of the simulated systems here (288 atoms for the clean slab) prevent us from applying HSE06 so we chose instead to use a local spin density approximation (LSDA) + U scheme already successfully applied to Ob-vac on TiO2(110) (21).
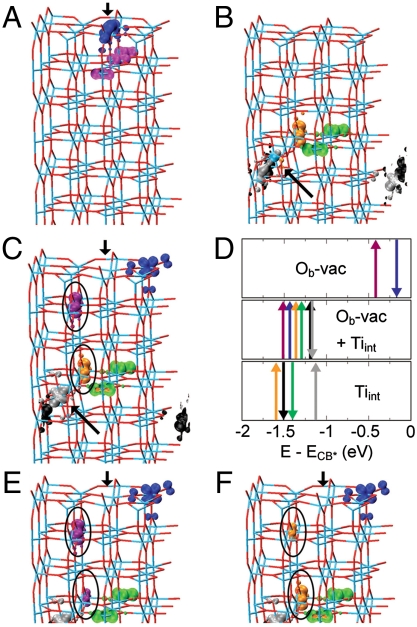
Fig. 3 shows the BGS spatial distribution for Ob-vac both isolated and in the presence of one Tiint. Recently, Tiint species have been suggested as the main origin of titania BGS (9) with negligible importance of Ob-vac (or OHb) sites. In contrast, our results shown in Fig. 3 C and D demonstrate that a combination of Tiint and Ob-vac induce new BGS. For isolated Ob-vac, the BGS (and the associated Ti3+ sites) are symmetrically localized at or immediately beneath the defect site (Fig. 3 A). For one isolated Tiint (Fig. 3 B), the calculations suggest an asymmetric localisation of the BGS at the Tiint site (one state) and on other separate, regular lattice Ti sites across the slab. Following refs. 22 and 23, we assign the appearance of localized BGS, and the ensuing local rehybridization to the chemical reduction of specific Ti sites from their stoichiometric oxidation state (i.e., reduction from Ti4+ to Ti3+ in an oversimplified ionic model).
Fig. 3.
Electronic charge density distribution (10-5 e Å -3) for the BGS of the considered 8 trilayer systems. (A) Ob-vac, (B) one Tiint between the fourth and fifth trilayers, (C) Ob-vac modeled together with one Tiint between the fourth and fifth TiO2(110) trilayers (Ob-vac + Tiint). Blue intersections indicate Ti atoms and red intersections O atoms. Tiint is shown as a blue sphere. The positions of Ob-vac and Tiint are marked by the black arrows. Different colors have been used to distinguish between Tiint-donated (black, gray, green, orange), and surface Ob-vac induced (purple, blue) BGS. (D) Single-state energy level diagram with respect to the CB onset (E-E CB∗ = 0) for the BGS in A–C after vacuum level electrostatic alignment. Up and down arrows refer to the modeled spin of the specific state. The same BGS color labelling has been used for all the displayed A–F panels. (E and F) For clarity, the hybridized BGS of Ob-vac + Tiint (orange and purple) circled in C, are redisplayed with the omission of the orange in E and purple in F BGS.
Upon consideration of an Ob-vac together with one Tiint, coupling between the vacancy site and the Tiint-donated electrons is evidenced by the large changes in the BGS eigenvalues (Fig. 3 D). By comparing the formation energies of an isolated Ob-vac (+5.11 eV) and a Tiint-coupled vacancy (+2.72 eV), the simulations suggest a net stabilization of 2.39 eV for Ob-vac within the adopted simulation cell. The concentration of Tiint modeled is about an order of magnitude higher than experimental estimates from the literature (20). This allows us to capture the qualitative behavior but prevents us from addressing quantitatively the number of electrons globally transferred to the surface. Given that the Tiint concentration simulated is about an order of magnitude greater than experimental estimates (20), this coupling should be even more favorable in reality because the electrostatic repulsion between BGS is expected to be much lower.
This BGS coupling drastically affects both the energy and, as was the case for the HSE06 modeling for Ob-vac(2 - ) (Fig. 2), the spatial distribution of the BGS of Ob-vac. The presence of Tiint-donated BGS induces an electronic reorganization that moves electronic charge away from the vacancy site and the corresponding Ob row (Fig. 3 C). Note that this is a different role for Tiint than that claimed in an earlier study, where electronic states associated with Tiint were responsible for the BGS (9).
Analysis of the individual BGS for the coupled systems provides insight into how the Tiint-donated electrons couple to Ob-vac sites. As shown in Fig. 3 C–F, when Tiint-donated electrons are modeled together with Ob-vac, hybridization between specific BGS (circled in Fig. 3 C, E, and F) make Tiint-donated electrons available at the Ob-vac site thus locally charging Ob-vac with the extra electrons necessary to account for the additional Oad imaged in Fig. 1 C. The same mechanism is also found for the interaction of Tiint-donated electrons with OHb. In this case, comparison between the formation energies of OHb (+0.32 eV) and OHb/Tiint (-1.05 eV) suggests a net stabilization of 1.37 eV. As with the Ob-vac/Tiint system, the Tiint electronic surplus is also characterized by symmetry breaking and hybridization between specific BGS (circled in Fig. S3).
Although we are unable to address directly the number of electrons globally transferred to the surface, we can make estimates based on the upper limit of reported Tiint concentration: 2 × 1019 cm-3, i.e., one per 800 TiO2 unit cells (20). In our estimation, we assume typical Ob-vac/OHb defect concentrations of 5 × 1013 cm-2 on a 1.0 × 0.5 × 0.1 cm3 sample, and we consider that each Tiint generates four Ti3+ sites (Fig. 3 B and ref. 24). This means that to singly (doubly) charge Ob-vac/OHb would only require the participation of 0.0017% (0.0034%) of the global number of Tiint-donated electrons.
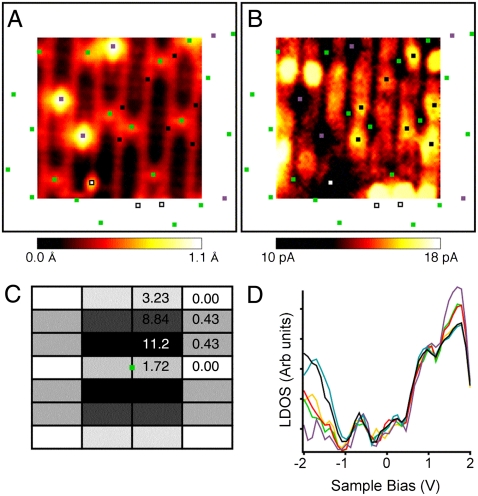
To further validate our model of the electronic structure, we probed the electronic charge distribution associated with Ob-vac experimentally using scanning tunneling spectroscopy (STS) at ∼5 K. This low temperature was chosen to deliberately freeze out polaronic hopping effects that are thought to average out asymmetries that are predicted to arise at 0 K (17, 18, 25). During the acquisition of the STM image shown in Fig. 4 A, the tip was immobilized at each point of the scan while tunneling current versus bias voltage (I-V) spectra were recorded. This method of recording I-V spectra alongside STM images is known as current imaging tunneling spectroscopy (CITS) (16), and it allows the I-V spectra to be displayed as current maps at each voltage.
Fig. 4.
Experimental STM and STS data. (A) (44 Å)2 STM image recorded simultaneously with the STS. (B) (44 Å)2 CITS current map at -2 V. The squares in A and B show the positions of Ob-vac (green), OHb (purple), and some bright features associated with Ob-vac (black). One impurity is also present and marked with a white square. Using a larger-scale image, the positions of Ob-vac, OHb, and other impurities outside the area imaged in A and B are also indicated. A and B have been smoothed using Image SXM (12) v.1.75. (C) A correlation map between Ob-vac and bright features in B. The center of the map represents the position of an Ob-vac shown as a green square. The black rectangles represent unit cells centered on Ti5c atoms that surround Ob-vac. The results are averaged between the four quadrants with the numbers shown only in one quadrant. The results are expressed as percentages that add to 100% when the numbers in all four quadrants are summed. The darker the shading, the greater the probability of finding a bright feature at the separation indicated by the map. (D) STS spectra represented as LDOS plots by plotting (dI/dV) × (V/I) vs V (26). The LDOS plots are taken from the bright features associated with Ob-vac (black), Ob-vac (green), OHb (purple), Ti5c (yellow), and Ob (red). Each curve is averaged from 180 individual spectra taken from the CITS set shown in this work and another 180 individual spectra taken from an equivalent CITS set recorded in an identical area of the surface. The black squares in A and B indicate which bright features contribute to the curves for bright features associated with Ob-vac; none were counted when they were also diagonally adjacent to OHb or in close vicinity to impurities.
The STM image in Fig. 4 A was acquired at a sample bias of +2 V with a tunneling current of 0.03 nA. It clearly shows both OHb and Ob-vac as bright spots between bright Ti5c rows. The current map at +2 V has a similar appearance to the STM image, as one would expect. However, the current map at -2 V (Fig. 4 B) has a very different appearance. Ob-vac and OHb both appear as dark spots centered between two bright rows. Bright features can be seen on the bright Ti5c rows and a correlation analysis (Fig. 4 C) shows that these lie diagonally adjacent to the Ob-vacs in the positions of the second nearest Ti5c neighbors. Each Ob-vac tends to be surrounded by one or two brighter features rather than four equally bright features. Fig. 4 D shows normalized conductance spectra (dI/dV) × (V/I) that approximate the local density of states. Each curve represents an average of 360 spectra corresponding to the bright features, Ob-vac, OHb, Ti5c, and Ob. Similar spectra were recorded using the same tip with the tunneling current set between 0.015 nA and 0.7 nA. We also recorded some spectra using an iridium tip. In neither case did we observe a shift of features, which suggests that the effect produced by tip-induced band-bending is negligible. These STS data are in broad agreement with recently reported 78 K results (27).
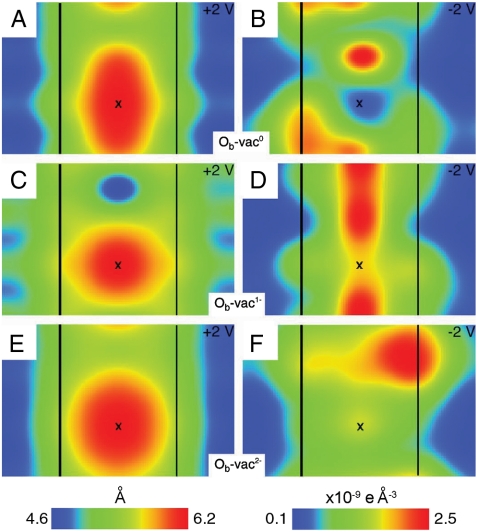
Fig. 5 shows our STM and current map simulations of Ob-vac at +2 V and -2 V, respectively. These are derived from the HSE06 density of states. The simulations at +2 V are similar to each other, the highest current being found at the Ob-vac (Fig. 5 A, C, and E). In contrast, the simulations at -2 V are strongly dependent on the Ob-vac charge. For both Ob-vac(0) and Ob-vac(1 - ), the highest current is found in a spot (or spots) directly in line with the bridging O row, inconsistent with the experimental contrast. The experimental distribution of the defect states is only reproduced in simulations of Ob-vac(2 - ) where the highest current is found on a second nearest Ti5c neighbor with little current along the Ob row. The current map for Ob-vac(2 - ) at -2 V was deconstructed by separating the contributions into “slices” with energy windows of 0.2 eV (Fig. S4). In this way, we find that the asymmetry originates between energies of 1.1 and 1.5 eV, with the majority signal between 1.1 and 1.3 eV. This identifies the asymmetry in the current map with the BGS introduced by Ob-vac(2 - ). This asymmetry is not observed in data recorded at 78 K (27). Presumably this arises because of significant polaronic hopping of the type recently identified at room temperature (25).
Fig. 5.
Modeled STM and CITS appearance for Ob-vac. Simulated STM images (+2 V, 10-7 e Å -3) and current maps (-2 V, same height above the surface as from the corresponding left-side topography) are shown for Ob-vac(0) in A and B, for Ob-vac(1 - ) in C and D, and for Ob-vac(2 - ) in E and F. Ti5c rows are indicated by black lines, and an X marks the Ob-vac. STM simulations were performed with a tip-surface distance of ∼5 Å [the detailed procedure can be found in ref. (28)].
STM and current map simulations based on the LSDA + U treatment of Tiint/Ob-vac introduced above (Fig. 3 C) also fit the experimental results well. The asymmetry can again be traced to the BGS of Ob-vac, in this case coupled to the Tiint donated electrons (Fig. S5, S6).
We are now in a position to reexamine the theoretical description of the reactivity of O2 with Ob-vac and OHb in the presence of Tiint-donated electron surplus. The use of the HSE06 (10, 11) approach allows us to accurately describe the relative energies of molecular H2O(g), O2(g), H2(g). Consequently, the level of accuracy of the calculated chemical potential and then the grand-canonical formation energies are expected to be sufficiently high to quantitatively address the thermodynamic stability of the considered systems (SI Text, Table SI).
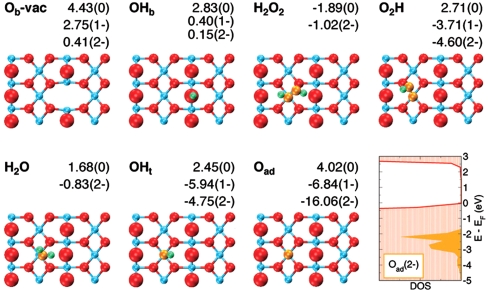
To match with our STM experiments, we use the results of our calculations from a simulated temperature of 300 K, but we note that the same trends are found at a large range of temperatures around 300 K. The formation energies of the pertinent adsorbates (H2O2, H2O, O2H, OHt, and Oad) are shown in Fig. 6 alongside those for Ob-vac and OHb. We stress that owing to the necessity of enforcing a compensating background in the simulation cells, only relative energy differences for one specific charge state can be meaningfully compared. To illustrate this point, the energy of H2O2(2 - ) can be compared with Oad(2 - ) or O2H(2 - ) but not with H2O2(0) or Oad(0).
Fig. 6.
Plan view of surface species together with their grand-canonical formation free energies (T = 300 K, P O2 = 1.3 × 10⁻⁸ mbar, P H2O = 1 × 10-11 mbar). Ti is shown blue, lattice O red, O from adsorbates orange, and H green. Bridging oxygen (Ob) atoms are shown larger to highlight them. The energies are in eV and the brackets after the energies indicate the electronic charge of the surface species. Geometries are optimized (3 × 2 supercell) for the neutral state. The total density of states for the optimized layers (filled red) of Oad(2 - )/TiO2(110) is displayed together with the Oad(2 - )-projected density of states (PDOS, filled orange) in the bottom-right panel.
The calculations indicate that when O2 reacts with Ob-vac(2 - ) (ΔGf = 0.41 eV), O2 dissociates, filling the vacancy and forming one Oad(2 - ) (ΔGf = -16.06 eV) with ΔG = -16.47 eV [Ob-vac(2 - ) + Ob(g) → Oad(2 - ) + Ob], consistent with experiments (1, 2). As for the reaction of O2 with OHb, we find that whereas formation of O2H(2 - ) from OHb(2 - ) is spontaneous (OHb(2 - ) + O2(g) → O2H(2 - ) + Ob, ΔG = -4.75 eV), the formation of H2O2(2 - ) (ΔGf = -1.02 eV) is strongly unfavoured with respect to Oad(2 - ) (ΔGf = -16.06 eV). Thus the reaction between O2 and OHb must take place via formation of O2H(2 - ) that, as with other OxHy(2 - ) intermediates, eventually reacts to form Oad(2 - ). O2 acts to scavenge all the initially available electron excess. Consistent with available spectroscopic data (3, 9, 15) where exposure to O2 quenches the BGS, sample oxidation in the calculation is accompanied by removal of Ti3+ BGS and localisation of Oad(2 - ) states in the valence band, VB (Fig. 6). Similar results are obtained by simulating one Tiint in the presence of two Oad, as shown in Fig. S7. No BGS are found associated with the Oad; instead the electronic charge density contributes to the lattice VB. A Bader charge analysis reveals a difference of 10% between the modeled atomic charges of these Oad products (0.9e) and the bridging Ob atoms (1e), thus highlighting the same oxide hybridization (22, 23) for both species in the simulation cell.
Hence, by accounting for TiO2(110) surface-trapped electron-polarons, and the ensuing increase in the actual number of Ti3+ species available at the surface, the experimentally observed formation of Oad from the reaction of O2 with OHb can be correctly described by theory. Furthermore, the same electron traps could be involved in trapping photogenerated electrons with potential implications for the photocatalytic activity of the surface. We expect that electron trapping will be important in dictating the reaction pathways on other dielectric metal oxide surfaces. This will have important consequences in areas such as corrosion, catalysis, and microelectronics.
Methods
Experimental.
O2 reactions were performed at room temperature with a variable temperature Omicron ultra high vacuum (UHV) STM. STS measurements employed a liquid helium bath cryostat Omicron UHV STM in order to maximize stability. CITS were imaged with 100 × 100 pixels, the component I-V spectra comprising 40 equally spaced points between +2 and -2 V. Positive bias indicates tunneling into empty sample states, with negative bias corresponding to tunneling out of filled sample states. Tungsten tips were always used unless otherwise stated. Standard sample preparation procedures were employed that are described elsewhere (1).
Computational.
Grand-canonical (μVT) formation energies (29) were calculated within a DFT-PAW approach implemented in the VASP program (30). LSDA + U simulations were carried out on the basis of 3 × 2 8 trilayers (8L) slabs with a local Ueff = 5.5 eV correction for Ti atoms, as suggested from embedded cluster configuration interaction results (21). As for the smaller 3 × 2 4 trilayer (4L) slabs, exchange and correlation terms were calculated at PW91-GGA (31) level for geometrical relaxation and on a hybrid HSE06 (10, 11) basis for final single point calculations and STM simulations. Ti 3p and 3s semicore states were treated as valence states. A 3 × 4 × 1 (Γ only) special k-points grid, 15 Å vacuum range, and 400 eV plane-wave energy cutoff were used for all the 4L (8L) simulations. The Γ-only finite sampling error on BGS dispersion (8L) was found to be converged within 0.1 eV against the finer 3 × 4 × 1 grid. The two (six) topmost trilayers and the adsorbates were relaxed to maximum atomic forces of 0.01 e Å -1. Spin polarization was enforced accounting for the number of extra electrons and optimising for the highest spin multiplicity.
As in previous investigations (28), STM and STS simulations were performed with a Tersoff-Hamann approach (32) implemented in the bSKAN program (33). The calculated HSE06 Fermi energy was used as the zero voltage point.
Bader charge analysis (34) was carried out on the basis of the total charge density i.e. accounting for both the electronic and ionic core charge.
Supplementary Material
Acknowledgments.
The authors thank Georg Kresse, Daniel Sanchez-Portal, Alex Shluger and David Muñoz Ramo for useful discussions and David Humphrey for assistance with some of the experiments. Support from Engineering and Physical Sciences Research Council (EP/C541898/1), EU (STRP Project NANOCHEMSENS), and Royal Society (W.A.H.) is gratefully acknowledged.
Footnotes
The authors declare no conflict of interest.
This article is a PNAS Direct Submission.
This article contains supporting information online at www.pnas.org/cgi/content/full/0911349107/DCSupplemental.
References
- 1.Bikondoa O, et al. Direct visualization of defect-mediated dissociation of water on TiO2(110) Nat Mater. 2006;5:189–192. [Google Scholar]
- 2.Wendt S, et al. Oxygen vacancies on TiO2(110) and their interaction with H2O and O2: A combined high-resolution STM and DFT study. Surf Sci. 2005;598:226–245. [Google Scholar]
- 3.Henderson MA, Epling WS, Peden CHF, Perkins CL. Insights into photoexcited electron scavenging processes on TiO2 obtained from studies of the reaction of O2 with OH groups adsorbed at electronic defects on TiO2(110) J Phys Chem B. 2003;107:534–545. [Google Scholar]
- 4.Zhang Z, et al. Water as a catalyst: Imaging reactions of O2 with partially and fully hydroxylated TiO2(110) surfaces. J Phys Chem C. 2009;113:1908–1916. [Google Scholar]
- 5.Tilocca A, Di Valentin C, Selloni A. O2 interaction and reactivity on a model hydroxylated rutile(110) surface. J Phys Chem B. 2005;109:20963–20967. doi: 10.1021/jp0544181. [DOI] [PubMed] [Google Scholar]
- 6.Du Y, et al. Imaging consecutive steps of O2 reaction with hydroxylated TiO2(110): Identification of HO2 and terminal OH intermediates. J Phys Chem C. 2009;113:666–671. [Google Scholar]
- 7.Epling WS, Peden CHF, Henderson MA, Diebold U. Evidence for oxygen adatoms on TiO2(110) resulting from O2 dissociation at vacancy sites. Surf Sci. 1998;412-413:333–343. [Google Scholar]
- 8.Rasmussen MD, Molina LM, Hammer B. Adsorption, diffusion, and dissociation of molecular oxygen at defected TiO2(110): A density functional theory study. J Chem Phys. 2004;120:988–997. doi: 10.1063/1.1631922. [DOI] [PubMed] [Google Scholar]
- 9.Wendt S, et al. The role of interstitial sites in the Ti3d defect state in the band gap of titania. Science. 2008;320:1755–1759. doi: 10.1126/science.1159846. [DOI] [PubMed] [Google Scholar]
- 10.Heyd J, Scuseria GE, Ernzerhof M. Hybrid functionals based on a screened Coulomb potential. J Chem Phys. 2003;118:8207–8215. [Google Scholar]
- 11.Heyd J, Scuseria GE, Ernzerhof M. Erratum: Hybrid functionals based on a screened Coulomb potential [J Chem Phys. 118, 8207 (2003)] J Chem Phys. 2006;124:219906. [Google Scholar]
- 12. http://www.liv.ac.uk/~sdb/ImageSXM/
- 13.Muñoz Ramo D, Gavartin JL, Shluger AL, Bersuker G. Spectroscopic properties of oxygen vacancies in monoclinic HfO2 calculated with periodic and embedded cluster density functional theory. Phys Rev B. 2007;75:205336. [Google Scholar]
- 14.Giordano L, Sushko PV, Pacchioni G, Shluger AL. Electron trapping at point defects on hydroxylated silica surfaces. Phys Rev Lett. 2007;99:136801. doi: 10.1103/PhysRevLett.99.136801. [DOI] [PubMed] [Google Scholar]
- 15.Kurtz RL, Stockbauer R, Madey TE, Román E, De Segovia JL. Synchrotron radiation studies of H2O adsorption on TiO2(110) Surf Sci. 1989;218:178–200. [Google Scholar]
- 16.Batzill M, Katsiev K, Gaspar DJ, Diebold U. Variations of the local electronic surface properties of TiO2(110) induced by intrinsic and extrinsic defects. Phys Rev B. 2002;66:235401. [Google Scholar]
- 17.Di Valentin C, Pacchioni G, Selloni A. Electronic structure of defect states in hydroxylated and reduced rutile TiO2(110) surfaces. Phys Rev Lett. 2006;97:166803. doi: 10.1103/PhysRevLett.97.166803. [DOI] [PubMed] [Google Scholar]
- 18.Deskins NA, Dupuis M. Electron transport via polaron hopping in bulk TiO2: A density functional theory characterization. Phys Rev B. 2007;75:195212. [Google Scholar]
- 19.Deskins NA, Rousseau R, Dupuis M. Localized electronic states from surface hydroxyls and polarons in TiO2(110) J Phys Chem C. 2009;113:14583–14586. [Google Scholar]
- 20.Henderson MA. A surface perspective on self-diffusion in rutile TiO2 . Surf Sci. 1999;419:174–187. [Google Scholar]
- 21.Calzado CJ, Hernández NC, Sanz JF. Effect of on-site Coulomb repulsion term U on the band-gap states of the reduced rutile (110) TiO2 surface. Phys Rev B. 2008;77:045118. [Google Scholar]
- 22.Resta R. Physical chemistry: Charge states in transition. Nature. 2008;453:735. doi: 10.1038/453735a. [DOI] [PubMed] [Google Scholar]
- 23.Raebiger H, Lany S, Zunger A. Charge self-regulation upon changing the oxidation state of transition metals in insulators. Nature. 2008;453:763–766. doi: 10.1038/nature07009. [DOI] [PubMed] [Google Scholar]
- 24.Iddir H, Öğüt S, Zapol P, Browning ND. Diffusion mechanisms of native point defects in rutile TiO2: Ab initio total-energy calculations. Phys Rev B. 2007;75:073203. [Google Scholar]
- 25.Krüger P, et al. Defect states at the TiO2(110) surface probed by resonant photoelectron diffraction. Phys Rev Lett. 2008;100:055501. doi: 10.1103/PhysRevLett.100.055501. [DOI] [PubMed] [Google Scholar]
- 26.Gurlu O, Zandvliet HJW, Poelsema B. Electronic properties of (2 × 1) and c(4 × 2) domains on Ge(001) studied by scanning tunneling spectroscopy. Phys Rev Lett. 2004;93:066101. doi: 10.1103/PhysRevLett.93.066101. [DOI] [PubMed] [Google Scholar]
- 27.Minato T, et al. The electronic structure of oxygen atom vacancy and hydroxyl impurity defects on titanium dioxide (110) surface. J Chem Phys. 2009;130:124502. doi: 10.1063/1.3082408. [DOI] [PubMed] [Google Scholar]
- 28.Teobaldi G, et al. Modelling STM images of TiO2(110) from first-principles: Defects, water adsorption and dissociation products. Chem Phys Lett. 2007;437:73–78. [Google Scholar]
- 29.Van de Walle CG, Neugebauer J. First-principles calculations for defects and impurities: Applications to III-nitrides. J Appl Phys. 2004;95:3851–3879. [Google Scholar]
- 30.Kresse G, Furthmüller J. Efficient iterative schemes for ab initio total-energy calculations using a plane-wave basis set. Phys Rev B. 1996;54:11169–11186. doi: 10.1103/physrevb.54.11169. [DOI] [PubMed] [Google Scholar]
- 31.Perdew JP, et al. Atoms, molecules, solids, and surfaces: Applications of the generalized gradient approximation for exchange and correlation. Phys Rev B. 1992;46:6671–6687. doi: 10.1103/physrevb.46.6671. [DOI] [PubMed] [Google Scholar]
- 32.Tersoff J, Hamann DR. Theory of the scanning tunneling microscope. Phys Rev B. 1985;31:805–813. doi: 10.1103/physrevb.31.805. [DOI] [PubMed] [Google Scholar]
- 33.Palotás K, Hofer WA. Multiple scattering in a vacuum barrier obtained from real-space wavefunctions. J Phys: Condens Matter. 2005;17:2705–2713. [Google Scholar]
- 34.Henkelman G, Arnaldsson A, Jónsson H. A fast and robust algorithm for Bader decomposition of charge density. Comp Mater Sci. 2006;36:354–360. [Google Scholar]
Associated Data
This section collects any data citations, data availability statements, or supplementary materials included in this article.


