

Abstract
Accurately determining the attenuation along the propagation path leading to a region of interest could significantly improve diagnostic ultrasound tissue characterization since tissue characterization requires exact compensation for the frequency-dependent attenuation along the propagation path. In a previous study (JASA, 124:1367, 2008), it was shown that the total attenuation can be determined by using the backscattered echoes from multiple sources. The preliminary computer simulation results, had an average error between -0.3 to +0.2 dB/MHz for the cases tested with a trend towards increasing error with increasing correlation length (i.e., characteristic size of the tissue microstructure of the scattering medium) and attenuation along the propagation path. Therefore, the goal of this study was to improve the accuracy of previously derived algorithm and reduce the dependence of the algorithm on correlation length and attenuation. In this study, the previous derivations were redone and the assumptions made by the algorithm regarding the scattering properties of the medium and the shape of the backscattered power spectrum were relaxed. The revised algorithm was then verified using computer simulations of five sources (6, 8, 10, 12, and 14 MHz, 50% bandwidth) exposing a homogeneous tissue region. The simulated tissue had microstructure following a Gaussian spatial correlation function (i.e., exp (−0.827(kaeff)2) where k is the wavenumber) with effective radii, aeff, of 5 to 55 μm (one size per simulated case) placed at a density of 250/mm3 (∼5 scatterers/resolution cell for 14 MHz transducer). The attenuation of the tissue was also varied from 0.1 to 0.9 dB/cm-MHz. The computer simulations demonstrated that the modifications significantly improved the accuracy of the algorithm resulting in average errors between -0.04 and 0.1 dB/MHz which is three times better than the error performance of the original algorithm.
Keywords: Tissue characterization, attenuation estimation
I. Introduction
Ultrasound tissue characterization has shown great potential in improving the accuracy of diagnostic medical ultrasound. For example, quantifying the characteristic correlation length and acoustic concentration of scatterers has been able to distinguish between fibroadinomas and carcinomas in implanted tumors in rats [1]. Other investigators have also used tissue characterization to quantify ocular tumors, blood, liver, muscle, myocardial injury, plaque, kidney, prostate, bone, skin, and tissue changes following therapy [2-16]. These techniques are based on quantifying the frequency dependence of the backscatter, and therefore require an accurate estimate of the frequency dependence of the attenuation along the propagation path in order to perform a valid assessment of the tissue. Furthermore much of the difficulty in extending the promising results of tissue characterization to the clinic can be attributed to the lack of a robust algorithm to estimate the frequency dependence of the attenuation along the propagation path as has been known for over 25 years [17]. For example, utilizing tissue characterization to assess ocular tumors has been successfully implemented in the clinic, despite competing technologies such as optical coherence tomography, and much of its success can be attributed to the propagation path being very similar to water which has a known frequency dependent attenuation [10, 17, 18].
In addition to ultrasound tissue characterization, an knowledge of the attenuation along the propagation path would also be beneficial to other applications of medical ultrasound such as ultrasound therapy planning. Currently, high-intensity focused ultrasound (HIFU) is being developed to thermally ablate tumors and other tissue noninvasively [19-21]. In addition to thermal coagulation, the use of ultrasound in various other applications such as drug delivery, opening the blood-brain barrier, destroying biofilms on medical implants, and mechanically destroying or removing tissue in a controlled fashion (i.e., ultrasound histotripsy) is also being explored [22-29]. In order the maximize the effectiveness of these therapeutic applications in the clinic, it is likely that careful therapy planning will be needed to determine which patients are the best candidates and to design the exposure. Such planning is common practice in radiation treatments for cancer. Knowing the total attenuation along the propagation path leading to the targeted tissue region could significantly enhance the accuracy of the therapy planning by allowing the in vivo ultrasound intensity and pressures to be estimated a priori. Of course, such an estimate would also require proper inclusion of nonlinear propagation which is also an active area of research.
We recently developed a new algorithm for estimating the total attenuation along the propagation path by scanning the same tissue region with multiple ultrasound sources and comparing the down-shift in spectral peak frequency between the different sources [30]. Unlike previous algorithms, the new algorithm was able to obtain estimates of attenuation without making overly restrictive assumptions regarding the frequency dependence of the backscatter [31-33] or the homogeneity of the intervening tissue [34, 35]. Unfortunately, the new algorithm had an average error between -0.3 to +0.2 dB/MHz for the cases tested with a trend towards increasing error as the scatterer correlation length (i.e., characteristic size of the tissue microstructure of the scattering medium as described in [36]) and/or the attenuation along the propagation path increased. Therefore, the goal of this study was to reduce the error and the observed dependence on scatterer correlation length and attenuation.
In this paper, we first re-derive the algorithm while relaxing some of the assumptions including an assumption regarding the scattering properties of the medium as will be detailed in the revised derivation. An assumption that the backscattered echoes have a Gaussian power spectrum that was made in the original algorithm is also relaxed by modifying the implementation of the algorithm. The revised algorithm is then verified using computer simulations of spherically focused source exposing an infinite half-space. Lastly, conclusions are drawn based on how the improvement in accuracy might translate to better clinical diagnosis of benign and malignant tumors.
II. Revised Derivation of Algorithm
The backscattered power spectrum received by an ultrasound source from a random distribution of weak scatterers at the focus that satisfy the Born approximation is given by [30, 37]
| (1) |
In eq.1, Fγ (f,a) is the form factor describing the scattering model for the tissue and depends on both frequency, f, and the effective scatterer radius, a, of the tissue. The total attenuation along the propagation path is given by αtotzT where zT is the distance from the aperture plane to the focal plane for the transducer, and αtot is the effective attenuation coefficient for the tissue along the propagation path and is weighted to account for tissue inhomogeneity in the intervening tissue layers between the source and the scattering region of interest (ROI). In our algorithm, we assume that αtot is approximately given by αtot = αof and the goal of our algorithm is to find αo. Also, k is the wave number, and |Vplane (f)|2 is the backscattered power spectrum that would be returned from a rigid plane placed at the focal plane in a water bath and is obtained independently to calibrate the echoes from the tissue.
The remaining term in eq.1, Acomp (f), is a generalized attenuation-compensation function that accounts for focusing and attenuation within the ROI and is given by
| (2) |
In eq. 2, L is the length of the windowing function, gwin, in millimeters that is used to gate the backscattered waveform when selecting the ROI, and αloc is the local attenuation within the ROI. wz is the effective Gaussian depth of focus that results from approximating the field in the focal region with a Gaussian function and can be used to quantify the ultrasound field for both spherically focused and array sources. wz depends linearly on wavelength and is given by wz = 6.01λ (f#)2 for an ideal spherically-focused source where f# is the f-number of the source [37]. As has been shown previously, it is possible to accurately estimate Acomp (f) by first measuring wz for the transducer and then approximating the local attenuation by where αhigh and αlow are the largest and smallest attenuation values expected for the tissue [38]. Therefore, it is possible to compensate for attenuation and focusing within the ROI prior to implementing our algorithm yielding
| (3) |
as was also discussed in our earlier publication [30]. Our earlier work also assumed that the backscattered spectrum was approximately Gaussian such that
| (4) |
where fo is the frequency corresponding to the spectral peak, and quantifies the bandwidth of the received echoes.
In order to develop the algorithm in our earlier work, we assumed that the form factor Fγ (f, aeff) was approximately given by
| (5) |
over the frequency range of interest where A is correlated with the effective scatterer size for the tissue and n ∼ 2 as has been assumed previously [33]. While clearly valid for the Gaussian form factor tissue model, Fgauss(ka) = exp(−0.827(ka)2), that has been used extensively for soft tissue [1, 5, 7], the approximation given by (5) is also valid for a wide variety of other form factors as is illustrated in Figure 1a for the fluid filled sphere form factor, , and Figure 1b for the spherical shell form factor, Fshell (ka) = [jo (2ka)]2. The fluid filled sphere has been used in the past to model soft tissue (like the Gaussian from factor model) while the spherical shell has been used to describe scattering from glass beads in tissue mimicking phantoms. The solid line in these plots is the true value of the form factor while the dashed line is the best fit that was obtained by fitting a function of the form A (ka)n to −ln (Ffluid_sphere(ka)) and − ln (Fshell(ka)) for Figure 1a and 1b respectively. The ka range used to fit the fluid filled sphere form factor was 0.01 to 1.2 while the ka range used for the shell was 0.01 to 0.6. A smaller ka range was used for the shell form factor due to the resonance at a ka of 1.2 impacting the fit. A similar resonance has not been observed in soft tissue, so this restriction on the ka range would only be important when verifying the algorithm using phantoms and would not be applied clinically. The fit of the fluid-filled sphere form factor was limited to 1.2 ka because values less than 1.2 are of the greatest interest when quantifying the tissue microstructure [39]. The best fit yielded
Figure 1.
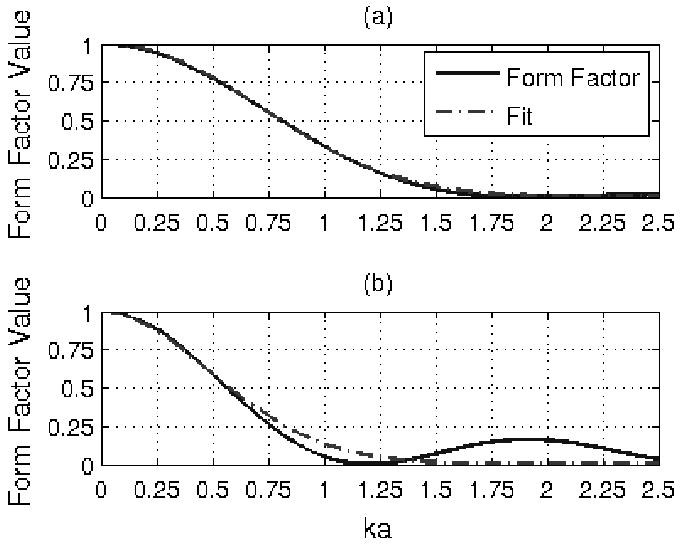
Form factor with fit of the form exp (−A(ka)n) for (a) fluid filled sphere and (b) spherical shell.
| (6) |
Clearly, the approximation of n ∼ 2 is appropriate for most form factors over the ka range of interest. Therefore, unlike the Spectral Fit Algorithm [31-33], the new algorithm has only a weak dependence on the tissue model assumed for the scattering since all three models have approximately the same frequency dependence.
After making the approximations given in (4) and (5), the impact of scattering and attenuation along the propagation path was incorporated as a series of Gaussian transformations on the Gaussian power spectrum yielding
| (7) |
In this equation, is the expected spectral peak frequency, and is the new bandwidth of the backscattered spectrum. and were related to the peak frequency and bandwidth of the echoes returned from a rigid plane placed at the focal plane (i.e., fo and ) in our earlier work [30] by
| (8) |
and
| (9) |
when n∼2.
In our earlier derivations, the term from (8) was assumed to be small compared to and hence was neglected in the rest of the derivation. Since publishing our earlier paper [30], we have determined that neglecting this term resulted in a slight bias in the total attenuation estimates generated by our algorithm (average error between -0.3 to +0.2 dB/MHz) that increased with larger scatterer sizes. Therefore, in this paper, the derivation will be repeated and the term will not be neglected. Instead, we will assume that and therefore keep only first order terms in . Under this new relaxed approximation, (9) becomes allowing (8) to be written as
| (10) |
when we neglect higher order terms in . Dividing (10) by yields the normalized downshift in peak frequency relative to the echoes from the rigid plane placed at the focal plane given by
| (11) |
Measuring ξ(fo) from the backscattered echoes from a ROI using multiple ultrasound transducers (i.e., different fo), fitting a line to ξ(fo) versus fo, and finding the intercept of that line yields the slope of the total attenuation along the propagation path, αo. Theoretically, (11) will yield αo even for inhomogeneous tissues while only requiring echoes from a specific region of interest.
In addition to improving the robustness of our algorithm in the presence of larger scatterer sizes, we also sought to relax some of the assumptions regarding the spectral shape. Recall that our new algorithm assumed that the backscattered power spectrum from tissue was approximately given by a Gaussian function. However, this approximation is typically only valid for a small range of frequencies about the spectral peak frequency and varies for different transducers and excitation conditions. As a result, the assumption tends to breakdown introducing a bias into the estimates as the as the spectral peak for the tissue gets farther away from the spectral peak for the reference (i.e., difference between fo and increases due to large attenuation values). In order to avoid this problem and relax the Gaussian approximation for the spectrum, we decided to first find an approximate value for the total attenuation slope, termed αguess, by
| (12) |
where ξ (fo) is given by (11). αguess would be the attenuation slope under purely Rayleigh scattering (i.e., point scatterers) and therefore is an overestimate of αo. Once αguess is determined, we calculate a new reference spectrum for each source given by
| (13) |
The new reference spectra peak at approximately the same location as the backscattered spectra from the ROI reducing the frequency range over which the Gaussian approximation for the spectral shape needs to be valid. After finding the new reference spectra, we find the new spectral peak value for each reference, , and calculate a new value for . corresponds to
| (14) |
allowing us to determine αo by finding the intercept of the line through and then adding the value of αguess to the intercept value.
III. Computer Simulation Results Validating Revised Algorithm
In order to evaluate the revised algorithm, computer simulations were performed. In the simulations, five spherically focused ultrasound sources exposed exactly the same homogeneous attenuating half-spaces. Spherically focused sources were selected in this initial validation so that a rigid plane placed at the focal plane could be used as reference target. A planar target was desired to simplify our preliminary analysis. However, other methods for quantifying the acoustic field, such as a reference phantom, will be explored in the future. The sources used in the simulations had focal lengths of 5 cm and f-numbers of 4. The center frequencies of the sources were 6, 8, 10, 12, and 14 MHz, and each source had a -3 dB transmitted bandwidth of 50%. These frequencies were selected to capture both the high end of the current diagnostic transducers as well as bridge the gap to some of the higher frequency transducers that have been utilized in tissue characterization experiments.
The sound speed of the half-spaces was 1540 m/s, and the attenuation of the half-spaces was varied from 0.1 dB/cm-MHz to 0.9 dB/cm-MHz in order to assess the dependence of the algorithm on attenuation. These values for attenuation were selected to span the range of most soft tissues in clinical applications. Likewise, a sound speed value of 1540 m/s was selected since this is a reasonable value for most tissue. Only one value of sound speed was used because the algorithm has little dependence on the speed of sound in the tissue provided the location of the focal zone can be approximately determined. The scattering structures within each half-space had Gaussian correlation functions (i.e., form factor of Fγ(f, aeff) = exp(−0.827(kaeff)2)) with an aeff from 5 to 55 μm and were positioned at a density of 250/mm3 (∼5 scatterers per resolution cell for 14 MHz transducer). Every simulated half-space had only a single scatterer size and a constant value of attenuation. We selected our range for scatterer sizes to span the aeff determined for fibroadenomas (52.5±7.0 μm) and carcinomas (14.0±2.3 μm using 20 MHz transducer, 19.9±3.2 μm using 8.5 MHz transducer) in previous animal experiments [1].
For each half-space, 250 independent three dimensional distributions of scatterers were generated and grouped into sets of 25 yielding 10 independent data sets. The backscattered echoes from each distribution using each source (5 different sources) were then simulated, and windowed with a rectangular windowing function in the time domain having a length corresponding to 4.36 mm in tissue depth. The window length of 4.36 mm and the grouping of 25 distributions per set were found to be optimal in our earlier implementation of the algorithm [30]. A rectangular windowing function has previously been shown to yield the best performance when compensating the backscattered power spectrum for windowing, focusing, and local attenuation [38]. After windowing, the power spectra were calculated for all 25 scatterer distributions for each source in each set. The power spectra were then averaged within each set to yield estimates of E [|Vscat (f)|2]compensated for each source after correcting for focusing and attenuation in the ROI. These estimates for E [|Vscat (f)|2]compensated for each source could then be used to obtain 10 estimates of αo, one per independent set, for every half-space using our algorithm.
The results using our modified algorithm are summarized in Figures 2 and 3. In these plots, the symbols represent the average error in the attenuation estimates found for each half-space while the error bars correspond to one standard deviation of the error in the attenuation estimates for each half-space. The figures show the errors in the attenuation estimates both in percent and in dB/MHz as calculated by
Figure 2.
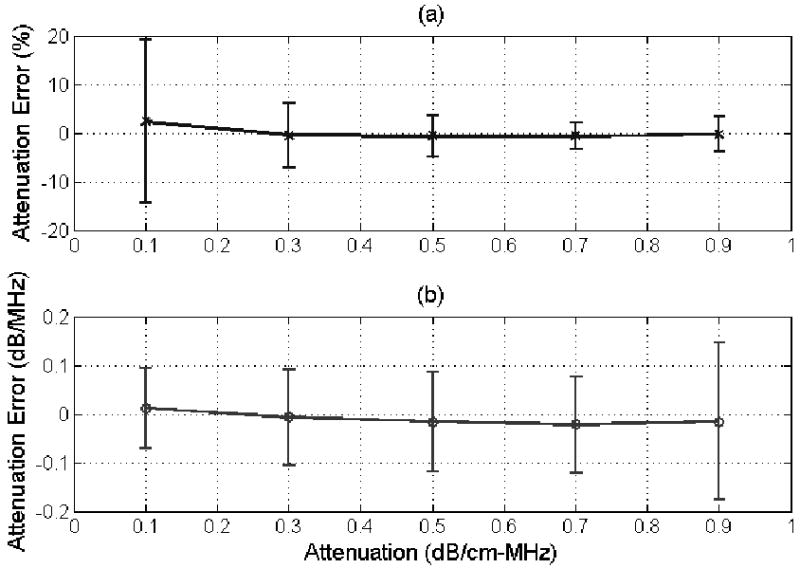
(a) % error and (b) error in dB/MHz in the attenuation estimate for half-space attenuations from 0.1 to 0.9 dB/cm-MHz for a scatterer size of 25 μm using the modified algorithm developed in this paper. The error bars correspond to one standard deviation above and below the mean value.
Figure 3.
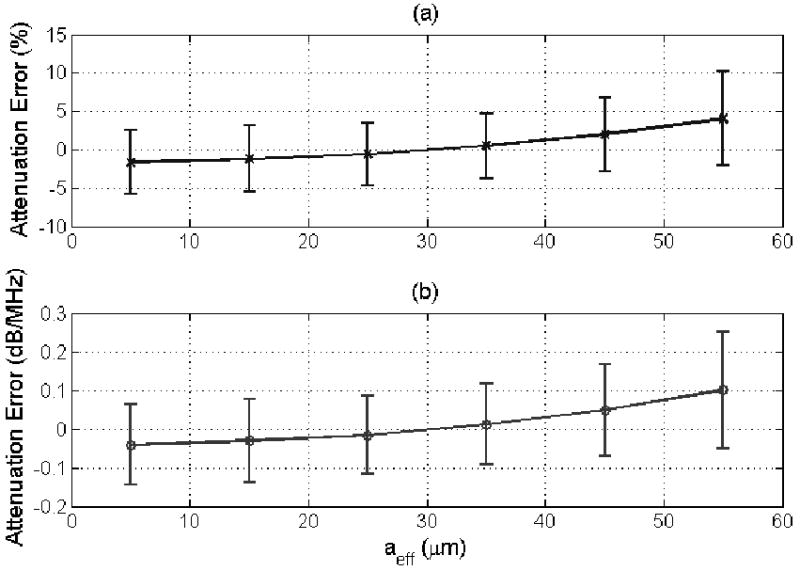
(a) % error and (b) error in dB/MHz in the attenuation estimate for a half-space attenuation of 0.5 dB/cm-MHz for scatterer sizes from 5 to 55 μm using the modified algorithm developed in this paper. The error bars correspond to one standard deviation above and below the mean value.
| (15) |
where αo|Estimated is the estimated value for the attenuation slope found by our algorithm and αo|True is the true value for the attenuation slope for the half-space. The error in percent is more applicable to therapy planning applications while the error in dB/MHz is more relevant in tissue characterization applications [31-33]. Also, recall that zT is the propagation distance into the tissue therefore the error in dB/MHz quantifies the absolute error in the attenuation estimates and can be generalized to different focusing configurations.
When changing the attenuation of the half-space as shown in Figure 2, the average error in the attenuation estimates varies from -0.02 dB/MHz for a half-space attenuation of 0.7 dB/cm-MHz to 0.01 dB/MHz for a half-space attenuation of 0.1 dB/cm-MHz with no trend with half-space attenuation distinguishable. These results are considerably better than the results obtained using our original algorithm (see Figure 4b published in [30]) where the average error in the attenuation estimates monotonically changed from -0.02 to -0.3 dB/MHz as the half-space attenuation changed from 0.1 to 0.9 dB/cm-MHz. Therefore, using our revised algorithm, the accuracy of our estimates (i.e., average error) are clearly independent of the half-space attenuation (Figure 2) and yield accurate estimates as the attenuation is increased from 0.1 to 0.9 dB/cm-MHz (x-axis on plot) unlike our original algorithm [30].
Figure 4.
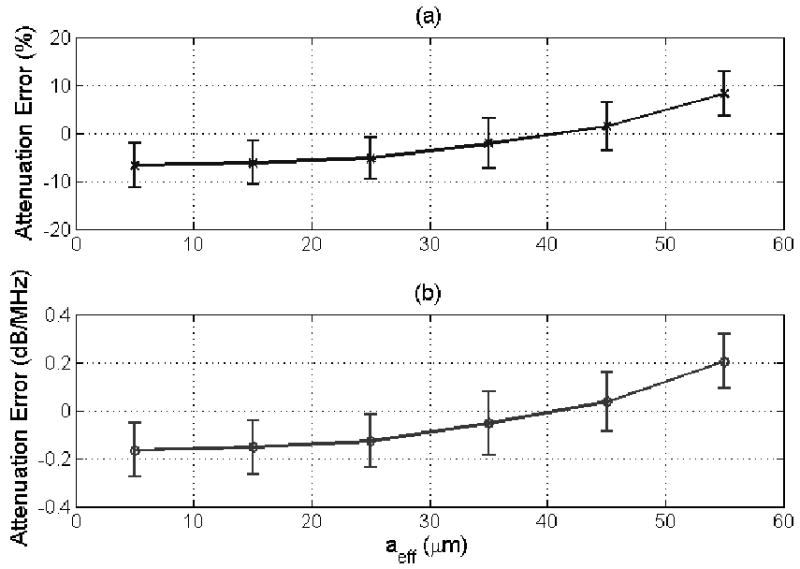
(a) % error and (b) error in dB/MHz in the attenuation estimate for a half-space attenuation of 0.5 dB/cm-MHz for scatterer sizes from 5 to 55 μm using the original algorithm described in [30]. The error bars correspond to one standard deviation above and below the mean value.
The performance of the new algorithm as a function of varying correlation length is also considerably better than our original algorithm. For the new algorithm, shown in Figure 3, the average error in the attenuation estimates increases monotonically with scatterer size from -0.04 dB/MHz for a scatterer size of 5 μm to +0.1 dB/MHz for a scatterer size of 55 μm. Whereas, for the original algorithm [30], shown in Figure 4, the average error in the attenuation estimates increases from -0.17 to +0.2 dB/MHz as the scatterer size increases from 5 to 55 μm. Therefore, the accuracy of the revised algorithm was over twice as good as the original algorithm with a much weaker dependence on scatterer size. There is still some dependence because the revised algorithm still assumes that where A is proportional to the square of the correlation length, aeff.
IV. Discussion/Conclusions
In this paper, we improved the accuracy of our earlier algorithm [30] by relaxing the approximations regarding scatterer size and the Gaussian shape of the power spectrum. The accuracy and precision of our new algorithm was then assessed by computer simulations with varying scatterer sizes (aeff of 5 to 55 μm) and attenuations (0.1 to 0.9 dB/cm-MHz). The magnitude of the largest average error in the attenuation estimates, |ErrordB/MHz|, was 0.1 dB/MHz for new algorithm which was three times smaller than the largest error of 0.3 dB/MHz found using our original algorithm. Therefore, the performance of the revised algorithm is considerably better than the performance of the original algorithm.
Before concluding, it is important that the improvement in the accuracy of the attenuation estimates obtained by the revised algorithm be connected to the future potential clinical impact of the work. To assist with this discussion, the attenuation estimates obtained using both our revised and our original algorithm were used to obtain estimates of aeff as has been done in numerous prior publications [1, 36-38]. In every case, the same echoes that were used to obtain an attenuation estimate were reprocessed using that estimated attenuation to generate a value for the scatterer size. This was done so that the variations in the attenuation estimates would be correctly translated to variations in the scatterer size estimates. The results for the half-spaces with a scatter size of 25 μm and attenuations from 0.1 to 0.9 dB/cm-MHz using the echo data from the simulated 8 MHz source are shown in Figures 5 and 6 for the original and revised algorithm respectively. Data from the 8 MHz source was selected because it would be comparable to earlier experimental data obtained using an 8.5 MHz source aimed at distinguishing between fibroadenomas and carcinomas in animal experiments [1]. Each symbol in the plots corresponds to an attenuation estimate and the corresponding aeff estimate from one of the 10 independent data sets generated for each half-space and used to evaluate the algorithm previously. The largest scatterer size measured for the carcinomas of 24.5 μm and the smallest scatterer size measured for the fibroadenomas of 46 μm as identified from Figure 7 in [1] are also identified as lines in our figures.
Figure 5.
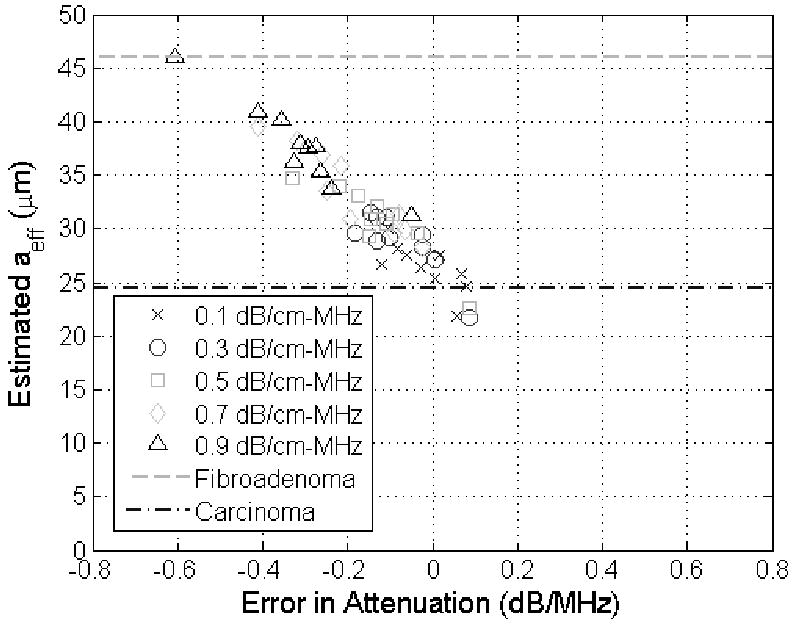
Scatter plot of showing estimated scatter size in μm versus the corresponding error in the attenuation estimate in dB/MHz for half-space attenuations from 0.1 to 0.9 dB/cm-MHz (different symbols) when the true scatterer size was 25 μm using the original algorithm described in [30]. The lines on the plots correspond to the larges scatterer size measured for carcinomas (24.5 μm) and the smallest scatterer size measured for fibroadenomas (46 μm) in animal experiments reported in [1].
Figure 6.
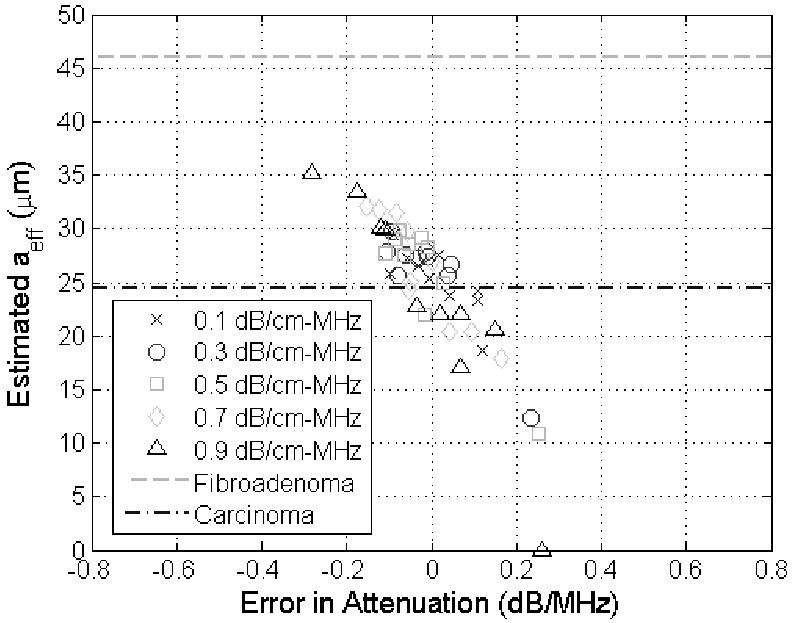
Scatter plot of showing estimated scatter size in μm versus the corresponding error in the attenuation estimate in dB/MHz for half-space attenuations from 0.1 to 0.9 dB/cm-MHz (different symbols) when the true scatterer size was 25 μm using the modified algorithm developed in this paper. The lines on the plots correspond to the larges scatterer size measured for carcinomas (24.5 μm) and the smallest scatterer size measured for fibroadenomas (46 μm) in animal experiments reported in [1].
From Figures 5 and 6, it is clear that the scatterer size is underestimated when the attenuation of the half-space was overestimated (i.e., positive value of attenuation error) and overestimated when the attenuation of the half-space was underestimated (i.e., negative value of attenuation error) as has also been observed previously [32, 33]. In addition, some of the scatterer size estimates using the original algorithm (Figure 5), which should have been 25 μm (i.e., carcinoma – a malignant tumor), are actually closer to 46 μm and could have been wrongly classified as a fibroadenoma (benign tumor) if this were a clinical setting. The aeff values shown in Figure 6, however, found using the revised algorithm are all closer to 25 μm than 46 μm avoiding the possibility of a misdiagnosis in this preliminary case. Therefore, our revised algorithm could have a significant impact in the clinic as tissue characterization continues to develop.
Acknowledgments
This project was supported by Grant # R01 CA111289 from the National Institutes of Health as well as Iowa State University. The content is solely the responsibility of the authors and does not necessarily represent the official views of the National Institutes of Health.
Footnotes
Publisher's Disclaimer: This is a PDF file of an unedited manuscript that has been accepted for publication. As a service to our customers we are providing this early version of the manuscript. The manuscript will undergo copyediting, typesetting, and review of the resulting proof before it is published in its final citable form. Please note that during the production process errors may be discovered which could affect the content, and all legal disclaimers that apply to the journal pertain.
References
- 1.Oelze ML, et al. Differentiation and characterization of rat mammary fibroadenomas and 4T1 mouse carcinomas using quantitative ultrasound imaging. IEEE Transactions on Medical Imaging. 2004;23(6):764–771. doi: 10.1109/tmi.2004.826953. [DOI] [PubMed] [Google Scholar]
- 2.Lizzi FL, et al. Ultrasonic spectral analyses of ocular tissues. The Journal of the Acoustical Society of America. 1976;59(S1):S75. [Google Scholar]
- 3.Silverman RH, et al. Ultrasonic tissue characterization and histopathology in tumor xenografts following ultrasonically induced hyperthermia. Ultrasound Med Biol. 1986;12(8):639–45. doi: 10.1016/0301-5629(86)90185-7. [DOI] [PubMed] [Google Scholar]
- 4.Nassiri DK, Hill CR. The use of angular acoustic scattering measurements to estimate structural parameters of human and animal tissues. The Journal of the Acoustical Society of America. 1986;79(6):2048–2054. doi: 10.1121/1.393213. [DOI] [PubMed] [Google Scholar]
- 5.Lizzi FL, et al. Relationship of ultrasonic spectral parameters to features of tissue microstructure. IEEE Trans UFFC. 1986;33(3):319–329. doi: 10.1109/t-uffc.1987.26950. [DOI] [PubMed] [Google Scholar]
- 6.Wear KA, et al. Differentiation between acutely ischemic myocardium and zones of completed infarction in dogs on the basis of frequency-dependent backscatter. The Journal of the Acoustical Society of America. 1989;85(6):2634–2641. doi: 10.1121/1.397977. [DOI] [PubMed] [Google Scholar]
- 7.Insana MF. Modeling acoustic backscatter from kidney microstructure using an anisotropic correlation function. The Journal of the Acoustical Society of America. 1995;97(1):649–655. doi: 10.1121/1.412287. [DOI] [PubMed] [Google Scholar]
- 8.Feleppa EJ, et al. Typing of prostate tissue by ultrasonic spectrum analysis. Ultrasonics, Ferroelectrics and Frequency Control, IEEE Transactions on. 1996;43(4):609–619. [Google Scholar]
- 9.Hall TJ, et al. Ultrasonic measurement of glomerular diameters in normal adult humans. Ultrasound in Medicine and Biology. 1996;22(8):987–997. doi: 10.1016/s0301-5629(96)00142-1. [DOI] [PubMed] [Google Scholar]
- 10.Lizzi FL, et al. Ultrasonic spectrum analysis for tissue assays and therapy evaluation. International Journal of Imaging Systems and Technology. 1997;8(1):3–10. [Google Scholar]
- 11.Noritomi T, et al. Carotid plaque typing by multiple-parameter ultrasonic tissue characterization. Ultrasound in Medicine & Biology. 1997;23(5):643–650. doi: 10.1016/s0301-5629(97)00013-6. [DOI] [PubMed] [Google Scholar]
- 12.Fontaine I, Cloutier G. Modeling the frequency dependence (5--120 MHz) of ultrasound backscattering by red cell aggregates in shear flow at a normal hematocrit. The Journal of the Acoustical Society of America. 2003;113(5):2893–2900. doi: 10.1121/1.1564606. [DOI] [PubMed] [Google Scholar]
- 13.Padilla F, Peyrin F, Laugier P. Prediction of backscatter coefficient in trabecular bones using a numerical model of three-dimensional microstructure. The Journal of the Acoustical Society of America. 2003;113(2):1122–1129. doi: 10.1121/1.1534835. [DOI] [PubMed] [Google Scholar]
- 14.Raju BI, et al. Quantitative ultrasonic methods for characterization of skin lesions in vivo. Ultrasound in Medicine & Biology. 2003;29(6):825–838. doi: 10.1016/s0301-5629(03)00009-7. [DOI] [PubMed] [Google Scholar]
- 15.Zhong H, et al. Monitoring imaging of lesions induced by high intensity focused ultrasound based on differential ultrasonic attenuation and integrated backscatter estimation. Ultrasound in Medicine & Biology. 2007;33(1):82–94. doi: 10.1016/j.ultrasmedbio.2006.07.034. [DOI] [PubMed] [Google Scholar]
- 16.Kweon-ho N, Dong-guk P, Min C. Ultrasonic backscatter from rat blood in aggregating media under in vitro rotational flow. Ultrasonics, Ferroelectrics and Frequency Control, IEEE Transactions on. 2009;56(2):270–279. doi: 10.1109/TUFFC.2009.1036. [DOI] [PubMed] [Google Scholar]
- 17.Lizzi FL, et al. Theoretical framework for spectrum analysis in ultrasonic tissue characterization. The Journal of the Acoustical Society of America. 1983;73(4):1366–1373. doi: 10.1121/1.389241. [DOI] [PubMed] [Google Scholar]
- 18.Lizzi FL, et al. Ultrasonic spectrum analysis for assays of different scatterer morphologies: Theory and very-high frequenc clinical results. Int J Imaging Syst Technol. 1997;8:3–10. [Google Scholar]
- 19.Hokland SL, et al. MRI-guided focused ultrasound: methodology and applications. Medical Imaging, IEEE Transactions on. 2006;25(6):723–731. doi: 10.1109/tmi.2006.873296. [DOI] [PubMed] [Google Scholar]
- 20.Fujikura K, et al. Effects of Ultrasonic Exposure Parameters on Myocardial Lesions Induced by High-Intensity Focused Ultrasound. J Ultrasound Med. 2006;25(11):1375–1386. doi: 10.7863/jum.2006.25.11.1375. [DOI] [PubMed] [Google Scholar]
- 21.Xu ZL, et al. Activation of Tumor-Infiltrating Antigen Presenting Cells by High Intensity Focused Ultrasound Ablation of Human Breast Cancer. Ultrasound in Medicine & Biology. 2009;35(1):50–57. doi: 10.1016/j.ultrasmedbio.2008.08.005. [DOI] [PubMed] [Google Scholar]
- 22.Hynynen K. Ultrasound for drug and gene delivery to the brain. Advanced Drug Delivery Reviews. 2008;60(10):1209–1217. doi: 10.1016/j.addr.2008.03.010. [DOI] [PMC free article] [PubMed] [Google Scholar]
- 23.Choi JJ, et al. Noninvasive, transcranial and localized opening of the blood-brain barrier using focused ultrasound in mice. Ultrasound in Medicine & Biology. 2007;33(1):95–104. doi: 10.1016/j.ultrasmedbio.2006.07.018. [DOI] [PubMed] [Google Scholar]
- 24.Miller DL, Dou C. Induction of Apoptosis in Sonoporation and Ultrasonic Gene Transfer. Ultrasound in Medicine & Biology. 2009;35(1):144–154. doi: 10.1016/j.ultrasmedbio.2008.06.007. [DOI] [PMC free article] [PubMed] [Google Scholar]
- 25.Karshafian R, et al. Sonoporation by Ultrasound-Activated Microbubble Contrast Agents: Effect of Acoustic Exposure Parameters on Cell Membrane Permeability and Cell Viability. Ultrasound in Medicine & Biology. 2009;35(5):847–860. doi: 10.1016/j.ultrasmedbio.2008.10.013. [DOI] [PubMed] [Google Scholar]
- 26.Lai CY, et al. Quantitative relations of acoustic inertial cavitation with sonoporation and cell viability. Ultrasound in Medicine & Biology. 2006;32(12):1931–1941. doi: 10.1016/j.ultrasmedbio.2006.06.020. [DOI] [PubMed] [Google Scholar]
- 27.Bigelow TA, et al. The Destruction of Escherichia Coli Biofilms Using High-Intensity Focused Ultrasound. Ultrasound in Medicine & Biology. 2009;35(6):1026–1031. doi: 10.1016/j.ultrasmedbio.2008.12.001. [DOI] [PubMed] [Google Scholar]
- 28.Xu Z, et al. Size Measurement of Tissue Debris Particles Generated from Pulsed Ultrasound Cavitational Therapy - Histotripsy. Ultrasound in Medicine & Biology. 2009;35(2):245–255. doi: 10.1016/j.ultrasmedbio.2008.09.002. [DOI] [PMC free article] [PubMed] [Google Scholar]
- 29.Wang Ty, et al. Quantitative ultrasound backscatter for pulsed cavitational ultrasound therapy-histotripsy. Ultrasonics, Ferroelectrics and Frequency Control, IEEE Transactions on. 2009;56(5):995–1005. doi: 10.1109/tuffc.2009.1131. [DOI] [PMC free article] [PubMed] [Google Scholar]
- 30.Bigelow TA. Ultrasound attenuation estimation using backscattered echoes from multiple sources. The Journal of the Acoustical Society of America. 2008;124(2):1367–1373. doi: 10.1121/1.2949519. [DOI] [PMC free article] [PubMed] [Google Scholar]
- 31.Bigelow TA, O'Brien WD., Jr Signal processing strategies that improve performance and understanding of the quantitative ultrasound SPECTRAL FIT algorithm. The Journal of the Acoustical Society of America. 2005;118(3):1808–1819. doi: 10.1121/1.2000752. [DOI] [PubMed] [Google Scholar]
- 32.Bigelow TA, O'Brien WD., Jr Evaluation of the spectral fit algorithm as functions of frequency range and Dkaeff. IEEE Transactions on Ultrasonics, Ferroelectrics, and Frequency Control. 2005;52(11):2003–2010. doi: 10.1109/tuffc.2005.1561669. [DOI] [PubMed] [Google Scholar]
- 33.Bigelow TA, Oelze ML, O'Brien WD., Jr Estimation of total attenuation and scatterer size from backscattered ultrasound waveforms. The Journal of the Acoustical Society of America. 2005;117(3):1431–1439. doi: 10.1121/1.1858192. [DOI] [PubMed] [Google Scholar]
- 34.Tu H, Zagzebski J, Chen Q. Attenuation estimations using envelope echo data: Analysis and simulations. Ultrasound in Medicine & Biology. 2006;32(3):377–386. doi: 10.1016/j.ultrasmedbio.2005.12.001. [DOI] [PubMed] [Google Scholar]
- 35.He P, Greenleaf JF. Application of stochastic analysis to ultrasonic echoes---Estimation of attenuation and tissue heterogeneity from peaks of echo envelope. The Journal of the Acoustical Society of America. 1986;79(2):526–534. doi: 10.1121/1.393540. [DOI] [PubMed] [Google Scholar]
- 36.Insana MF, et al. Describing small-scale structure in random media using pulse-echo ultrasound. The Journal of the Acoustical Society of America. 1990;87(1):179–192. doi: 10.1121/1.399283. [DOI] [PMC free article] [PubMed] [Google Scholar]
- 37.Bigelow TA, O'Brien WD., Jr Scatterer size estimation in pulse-echo ultrasound using focused sources: Theoretical approximations and simulation analysis. Journal of the Acoustical Society of America. 2004;116(1):578–593. doi: 10.1121/1.1757452. [DOI] [PubMed] [Google Scholar]
- 38.Bigelow TA, O'Brien WD., Jr Impact of local attenuation approximations when estimating correlation length from backscattered ultrasound echoes. The Journal of the Acoustical Society of America. 2006;120(1):546–553. doi: 10.1121/1.2208456. [DOI] [PubMed] [Google Scholar]
- 39.Insana MF, Hall TJ. Parametric ultrasound imaging from backscatter coefficient measurements: Image formation and interpretation. Ultrason Imaging. 1990;12:245–267. doi: 10.1177/016173469001200402. [DOI] [PubMed] [Google Scholar]