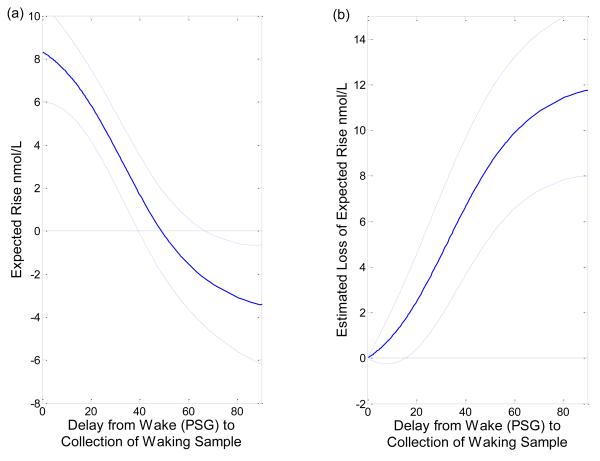
Figure 4.
Figure 4a shows the expected CAR as a function of delay in the taking of the waking sample from wake time and the 95% confidence interval. The CAR decreases as the delay in taking the first sample increases.
Figure 4b shows the expected difference in CAR when the waking sample is taken at wake time versus if there is a delay.

