Abstract
A study was performed to evaluate a computational model used to characterize the influence of vastus medialis obliquus (VMO) function on the patellofemoral pressure distribution. Ten knees were tested in vitro at 40°, 60° and 80° of knee flexion with quadriceps loads applied to represent a normal VMO, and with the VMO force decreased by approximately 50% to represent a weak VMO. The tests were performed with the cartilage intact and with a full thickness cartilage lesion centered on the lateral facet of the patella. The experimental tests were replicated computationally by applying discrete element analysis to a model of each knee constructed from MRI images. Repeated measures statistical comparisons were used to compare computational to experimental data and identify significant (p < 0.05) differences due to the lesion and the applied VMO force. Neither the lateral force percentage nor the maximum lateral pressure varied significantly between the computational and experimental data. Creating a lesion significantly increased the maximum lateral pressure for all comparisons, except for the experimental data at 40°. Both computationally and experimentally, decreasing the VMO force increased the lateral force percentage by approximately 10% for all cases, and each increase was statistically significant. The maximum lateral pressure increase was typically less than 10% but was still significant for the majority of the comparisons focused on VMO strength. The results indicate that computational modeling can be used to characterize how varying quadriceps loading influences the patellofemoral force and pressure distributions while varying the condition of cartilage.
Keywords: patellofemoral joint, computational model, pressure, cartilage, vastus medialis obliquus
INTRODUCTION
Patellofemoral disorders are commonly attributed to an excessive lateral force applied to the patella. Due to the normal valgus orientation of the knee, the quadriceps muscles and the patella tendon apply a force to the patella with a lateral component. The force applied by the vastus medialis obliquus (VMO) has a medial component that can limit the resultant lateral force applied to the patella. In vivo studies have indicated that patients with patellofemoral pain generate less force through the VMO than asymptomatic subjects (Makhsous, et al., 2004; Tang et al., 2001). In vitro, VMO weakness has been shown to elevate lateral patellofemoral pressures (Elias et al., 2009). Overloading lateral cartilage can lead to areas of cartilage degradation, or lesions (Fulkerson and Shea, 1990; Saleh et al., 2005). Cartilage lesions increase the pressure applied to surrounding cartilage (Elias et al., 2009; Huberti et al., 1988) and can lead to pain due to overloading of the subchondral bone (Fulkerson, 2002; Fulkerson and Shea, 1990; Powers, 1998).
The nature of in vitro testing limits the clinical relevance of in vitro experimental data relating VMO function to cartilage loading. In vitro studies do not typically represent the young patient population (Makhsous, et al., 2004; Tang et al., 2001) that seeks treatment for patellofemoral pain, or anatomical conditions, such as femoral anteversion, tibial torsion, or genu valgum, that can contribute to an excessive lateral force applied to the patella. Cartilage lesions can be represented, although variations in the size and position of lesions are limited. Computational simulation of patellofemoral function using models representing symptomatic knees addresses these limitations, although the accuracy of computational models must be evaluated.
The current study was performed to evaluate a computational model used to characterize the influence of VMO function on the patellofemoral force and pressure distributions. The computational modeling technique, based on discrete element analysis (DEA), is similar to a technique that was evaluated previously (Elias et al., 2004). The current model includes modifications applied to improve representation of soft tissues, and includes representation of cartilage lesions, necessitating the current model evaluation.
METHODS
An in vitro study performed to characterize the influence of VMO weakness on the patellofemoral force and pressure distributions (Elias et al., 2009) was computationally replicated. Isometric knee extension was simulated at multiple flexion angles with ten cadaver knees. Loading cables run over pulleys applied forces through the VMO, the vastus lateralis (VL) and the combination of the vastus intermedius/vastus medialis longus/rectus femoris (VI/VML/RF) to represent a normal quadriceps force distribution (VMO = 60 N, VL = 116 N, VI/VML/RF = 420 N) and a force distribution with a weak VMO (VMO = 27 N, VL = 127 N, VI/VML/RF = 432 N). To cover a range that included a transition in pressure from the distal to proximal patella, the two loading conditions were applied at 40°, 60° and 80° of knee flexion. Each knee was tested with the cartilage intact and with a 12 mm diameter full thickness cartilage lesion centered on the lateral facet of the patella. Patellofemoral forces and pressures were measured using thin (0.1 mm thick) film sensors (I-Scan 5051, Tekscan, Boston, MA) inserted into the joint following resection of the lateral retinacular structures. Each sensor was calibrated with a series of 8 loads while sandwiched between two sheets of 3.2 mm thick soft neoprene rubber. The position of the patella ridge was palpated on the sensor for each experimental test.
Each knee was secured to a plastic frame with a hinge joint to enable MRI scans (Signa Excite 1.5T HD, GE Healthcare) with the knee fully extended and flexed to approximately 60°. The same hinged frame supported the knees for the experimental study. The scan with the knee extended was performed with an extremity coil in the sagittal plane using a three-dimensional spoiled gradient echo sequence with fat suppression (TR = 55 ms, TE = 5 ms, flip angle = 40°, field of view = 14 cm), with a slice thickness of 1.5 mm (Cohen et al., 2003). The scan with the knee flexed utilized the full body coil and was T1-weighted (TR = 550 ms, TE = 15 ms, field of view = 25 cm), with a 3 mm slice thickness.
Triangulated surface meshes representing the femur, tibia and patella and the cartilage on the femur and patella were reconstructed from images of the extended knee. Cartilage thickness was determined from the reconstructed cartilage surfaces by projecting surface normals from the articular surface and identifying intersection points at the bone-cartilage interface. Using measurements from the cadaver knees and anatomical landmarks on the patella, the center of attachment of each muscle group on the reconstructed patella was identified. The attachment points of the patella tendon on the distal patella and on the tibial tuberosity were designated similarly. The center of each lesion on the reconstructed patella was also identified. A second model comprised of the bones without cartilage was reconstructed from images of the flexed knee.
Each reconstructed knee was positioned within a graphical representation of the experimental test frame (Figure 1). The femoral shaft was aligned horizontally along a proximal-distal axis with the posterior condyles in a horizontal plane. The femurs from the extended and flexed models of each knee were aligned utilizing an iterative closest point algorithm (Besl and McKay, 1992). The flexion axis was parallel to the hinges. Rotating the tibia from the extended knee about the flexion axis allowed superimposition of the tibias from the two models. The varus-valgus orientation, internal-external rotation and medial-lateral shift of the tibia from the extended knee were also graphically manipulated to allow alignment of the two tibias following flexion, in order to reproduce the experimental orientation of the patella tendon. The flexion axis and the other five degrees of freedom were not changed when the flexion angle was changed, modeling the experimental set-up. The origin of each quadriceps loading cable was replicated in the computational coordinate system, with the VMO force aligned at an angle of 47° medial to the axis of the femur in the coronal plane, the VL force aligned at an angle of 19° lateral to the same axis, and the VI/VML/RF force aligned along the femoral shaft (Farahmand et al., 1998). The anatomical orientation of each muscle in the sagittal plane was also represented. As the knee flexed, points of intersection between each applied force vector and the surface of the distal femur were computationally identified to wrap the forces around the femur.
Figure 1.
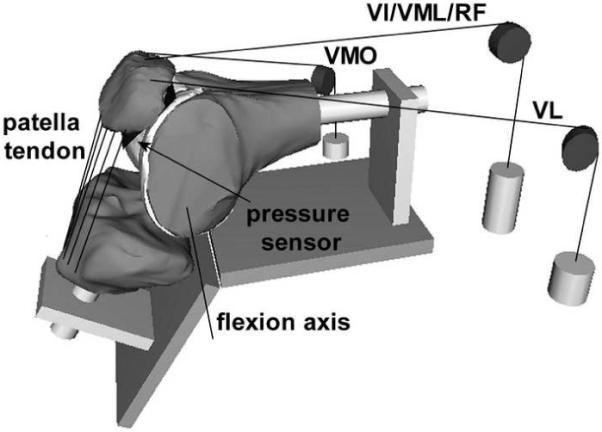
Computational model of a flexed knee, embedded in a graphical representation of the in vitro testing frame. The loading cables used to apply forces through the quadriceps muscles are represented, along with representations of the pulleys and weights. The line segments representing the patella tendon are also shown, along with the sensor position within the patellofemoral joint and the tibiofemoral flexion axis.
At each flexion angle, the patella was initially aligned with a mating surface within the trochlear groove. The ratio of patellofemoral flexion to tibiofemoral flexion was set to 0.65 for each knee (Kumagai et al., 2002). Once the patella was flexed, the patella was translated along the trochlear groove until a tangent to the point of contact on the patellar ridge was aligned with a parallel surface in the groove. The point of contact was halfway along the length of the articular surface at 60°. At 40° and 80°, the point of contact was shifted by one-eighth of the length of the articular surface distally and proximally, respectively, to incorporate proximal translation of the contact area on the patella with knee flexion. At each flexion angle, the remaining degrees of freedom were set to align the patella apex with the deepest point of the trochlear groove and the lateral facet with the lateral ridge of the trochlear groove, producing a representation of the position prior to application of quadriceps forces.
The patellofemoral force and pressure distributions were characterized for each simulation using the DEA technique (Elias et al., 2004; Genda et al., 2001). The femur and patella were treated as rigid bodies, with a surface of compressive springs created along the femoral cartilage. The contact area was limited to the surface of the femoral cartilage within 3 mm of the closest point on the patellar cartilage, with approximately 1,000 springs included in each analysis. The pressure within each spring was assumed to increase nonlinearly with deformation according to the equation (Blankevoort et al., 1991):
where E is the elastic modulus (5 MPa), ν is the Poisson’s ratio (0.45), h is the combined thickness of the cartilage on the femur and patella, and d is the compression of the spring. Each spring element was also assigned a shear stiffness equal to 2% of the compressive stiffness to represent the relatively small contribution of joint friction and cartilage shear stiffness (Elias and Cosgarea, 2006). When a lesion was modeled, the cartilage springs were removed from the lesion area. The patella tendon was modeled with 5 springs, with a total stiffness of 2000 N/mm (Besier et al., 2008). To allow nonlinear deformation, the quadriceps forces were applied in 10 equal steps. In response to applied forces, the patella translated and rotated from the initial position within the groove, with the final position producing equilibrium and minimizing the total potential energy within the system of springs. Force and pressure distributions were characterized in terms of the percentage of the compressive force carried by all springs applied lateral to the patella ridge (lateral force percentage), the maximum lateral pressure, the maximum medial pressure, the mean lateral pressure (total lateral compression divided by lateral contact area), and the mean medial pressure. Because the line representing the ridge experimentally was within a band estimated to be approximately 5 mm wide that could be characterized as the ridge, the maximum medial and lateral pressure measurements excluded an area 5 mm wide along the patella ridge, as was done with the experimental data.
The computational and experimental data were compared at each flexion angle, with the variations in VMO strength and cartilage condition included in a three level ANOVA with repeated measures. The three level ANOVA identified overall significant (p < 0.05) differences between the computational and experimental data for each parameter. If the VMO strength or cartilage condition significantly influenced the data, further statistical tests were performed to compare significant differences between the computational and experimental data. A two level ANOVA with repeated measures on VMO strength and cartilage condition was applied to the computational and experimental data for each parameter. Additional paired t-tests were performed for individual comparisons between weak and normal VMO cases for both cartilage conditions. The influence of the VMO strength on the output was also characterized with weak VMO to normal VMO ratios, calculated by dividing each value obtained for a weak VMO by the corresponding value for a normal VMO.
RESULTS
The computational maximum pressure values and lateral force percentage were similar to the experimental values, although the computational mean pressure values tended to be larger than the experimental values. For a normal VMO force, approximately two-thirds of the compression was applied to lateral cartilage (Figure 2), with no significant differences identified between the computational and experimental data (Table 1). For the maximum lateral pressure (Figure 3) and maximum medial pressure (Figure 4), the computational and experimental data were in better agreement for intact cartilage than for cartilage with a lesion. The computational maximum medial pressure was significantly larger than the experimental maximum medial pressure at 60°. The computational mean lateral pressure (Figure 5) and mean medial pressure (Figure 6) were consistently larger than the experimental values. Significant computational vs. experimental differences were noted for every comparison except for the mean medial pressure at 80°.
Figure 2.
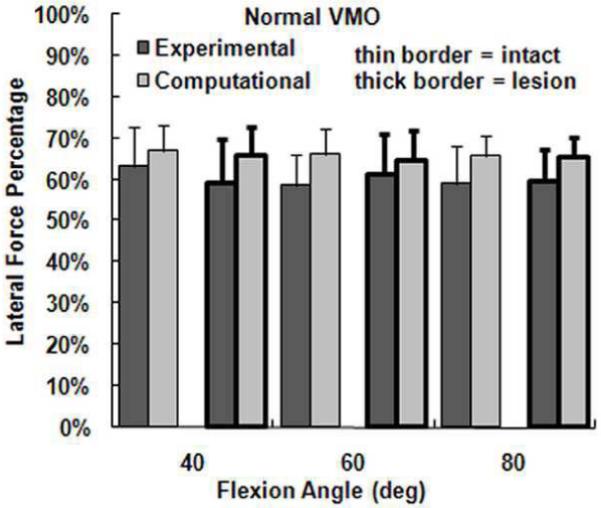
The average experimental and computational lateral force percentage (± standard deviation) for intact cartilage and cartilage with a lateral lesion. Data is shown for the normal VMO force only.
Table 1.
Significant differences for computational vs. experimental and intact cartilage vs. lesion comparisons
| Comp vs. Exp | Intact vs. Lesion, Comp | Intact vs. Lesion, Exp | |
|---|---|---|---|
| Lateral Force % | None | None | None |
| Max Lateral Pressure | None | 40°, 60°, 80° | 60°, 80° |
| Max Medial Pressure | 60° | 40° | None |
| Mean Lateral Pressure | 40°, 60°, 80° | 40°, 60°, 80° | 80° |
| Mean Medial Pressure | 40°, 60° | 40°, 60°, 80° | None |
Comp: Computational; Exp: Experimental
Figure 3.
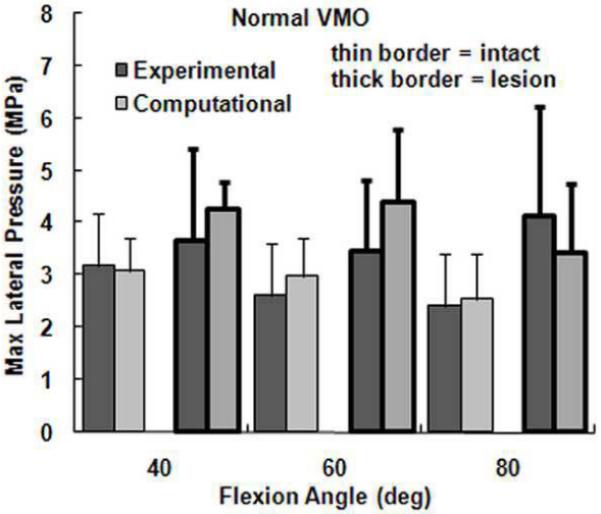
The average experimental and computational maximum lateral pressure (± standard deviation) for intact cartilage and cartilage with a lateral lesion. Data is shown for the normal VMO force only.
Figure 4.
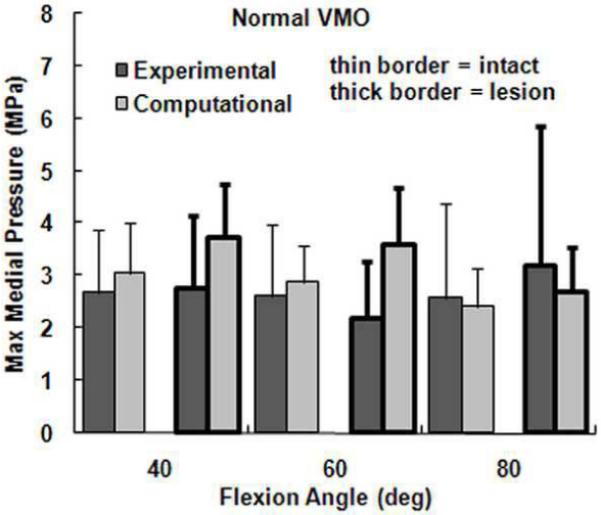
The average experimental and computational maximum medial pressure (± standard deviation) for intact cartilage and cartilage with a lateral lesion. Data is shown for the normal VMO force only.
Figure 5.
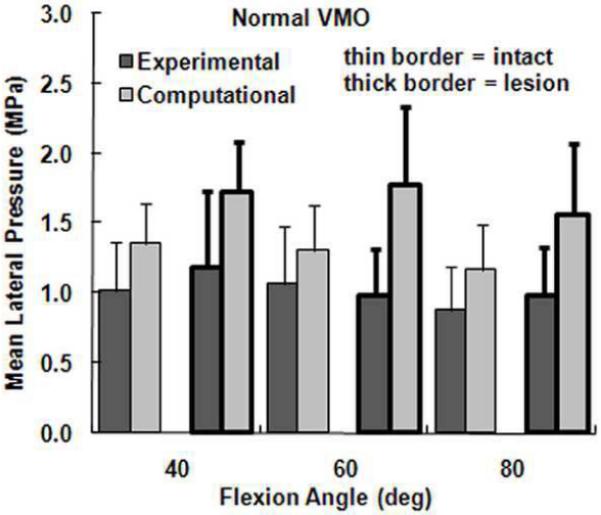
The average experimental and computational mean lateral pressure (± standard deviation) for intact cartilage and cartilage with a lateral lesion. Data is shown for the normal VMO force only.
Figure 6.
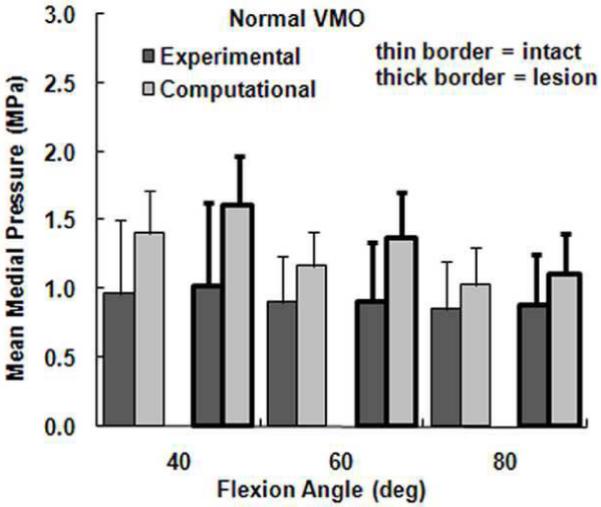
The average experimental and computational mean medial pressure (± standard deviation) for intact cartilage and cartilage with a lateral lesion. Data is shown for the normal VMO force only.
The presence of a lateral cartilage lesion had the greatest influence on the maximum lateral pressure. Computationally, creating a lesion significantly increased the maximum lateral pressure for all three flexion angles, compared to a significant increase at 60° and 80° experimentally (Table 1). The lesion also tended to increase the maximum medial pressure, although the increase was only significant for the computational data at 40°. The lesion decreased the lateral contact area and shifted compression medially, which led to significant increases in both the mean lateral and mean medial pressures at all three flexion angles for the computational data. Experimentally, a lateral lesion significantly increased mean lateral pressure only at 80° and did not significantly influence the mean medial pressure.
Both computationally and experimentally, decreasing the force applied by the VMO produced small, but measurable, lateral shifts in joint compression (Figure 7). Decreasing the VMO force tended to increase the lateral force percentage, the maximum lateral pressure and the mean lateral pressure, and tended to decrease the maximum and mean medial pressure (Table 2). The change in the lateral force percentage was the most consistent, with an average weak VMO to normal VMO ratio of approximately 1.1 for all testing conditions. For each comparison, the lateral force percentage was significantly larger for a weak VMO than for a normal VMO. The weak VMO to normal VMO ratio was less consistent for the other output parameters, but the difference between the two conditions was statistically significant for at least 10 of 12 comparisons for every other parameter, with similar ratio values for the computational and experimental data.
Figure 7.
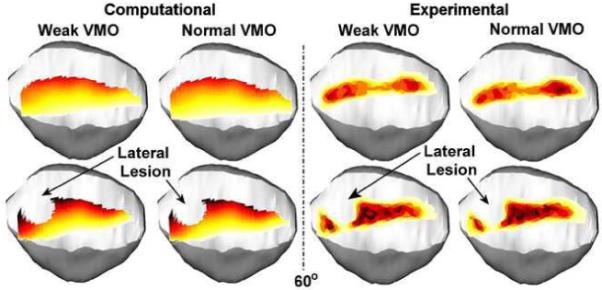
Computationally determined and experimentally determined pressure patterns superimposed over a graphical representation of the patella for one knee at 60° of flexion. The pressure distribution is shown for a weak VMO and a normal VMO, for intact cartilage and cartilage with a lateral lesion. Decreasing the force applied by the VMO shifts pressure laterally on the patella.
Table 2.
Average (± standard deviation) ratios for Weak VMO/Normal VMO
| Intact Cartilage | Lateral Lesion | |||
|---|---|---|---|---|
| Experimental | Computational | Experimental | Computational | |
|
Lateral Force Percentage |
||||
| 40° | 1.12 ± 0.03* | 1.09 ± 0.01* | 1.14 ± 0.11* | 1.08 ± 0.02* |
| 60° | 1.10 ± 0.03* | 1.08 ± 0.01* | 1.10 ± 0.04* | 1.08 ± 0.01* |
| 80° | 1.10 ± 0.05* | 1.08 ± 0.01* | 1.09 ± 0.05* | 1.08 ± 0.01* |
|
Maximum Lateral Pressure |
||||
| 40° | 1.09 ± 0.10* | 1.03 ± 0.05 | 1.06 ± 0.09 | 1.05 ± 0.03* |
| 60° | 1.06 ± 0.06* | 1.05 ± 0.05* | 1.13 ± 0.11* | 1.07 ± 0.03* |
| 80° | 1.05 ± 0.05* | 1.05 ± 0.04* | 1.08 ± 0.10* | 1.10 ± 0.05* |
|
Maximum Medial Pressure |
||||
| 40° | 0.86 ± 0.13* | 0.91 ± 0.03* | 0.85 ± 0.11* | 0.93 ± 0.04* |
| 60° | 0.87 ± 0.06* | 0.93 ± 0.03* | 0.86 ± 0.07* | 0.95 ± 0.03* |
| 80° | 0.89 ± 0.13* | 0.94 ± 0.05* | 0.92 ± 0.09* | 0.96 ± 0.06* |
|
Mean Lateral Pressure |
||||
| 40° | 1.08 ± 0.08* | 1.05 ± 0.01* | 1.07 ± 0.05* | 1.06 ± 0.01* |
| 60° | 1.04 ± 0.06 | 1.06 ± 0.02* | 1.05 ± 0.09 | 1.07 ± 0.02* |
| 80° | 1.04 ± 0.04* | 1.07 ± 0.02* | 1.07 ± 0.07* | 1.07 ± 0.03* |
|
Mean Medial Pressure |
||||
| 40° | 0.83 ± 0.09* | 0.88 ± 0.05* | 0.84 ± 0.15* | 0.91 ± 0.04* |
| 60° | 0.88 ± 0.06* | 0.90 ± 0.05* | 0.87 ± 0.05* | 0.94 ± 0.04* |
| 80° | 0.89 ± 0.07* | 0.90 ± 0.06* | 0.92 ± 0.06* | 0.93 ± 0.07* |
statistically significant difference between normal and weak VMO
DISCUSSION
Because the computational modeling technique has been developed as a tool to investigate VMO function, the primary concern is the accuracy of the computationally determined influence of VMO strength on the patellofemoral force and pressure distributions. Both computationally and experimentally, decreasing the force applied by the VMO shifted compression laterally, increasing the maximum lateral pressure and decreasing the maximum medial pressure. The changes were consistent both computationally and experimentally despite the fact that variations in the pressure distributions were difficult to detect visually. The computational weak VMO to normal VMO ratios were similar to experimental values for both intact cartilage and cartilage with a lesion. Therefore, using computational modeling to further characterize how changes in VMO function influence patellofemoral forces and pressures seems justified.
The value of the computational modeling technique is enhanced by providing realistic magnitudes for patellofemoral force and pressure measurements. The closest agreement between the computational and experimental data occurred for the lateral force percentage and the maximum lateral pressure. The computational maximum medial pressures were similar to the experimental values for intact cartilage, but tended to be larger than the experimental values at 40° and 60° when a lateral lesion was present. When a lateral lesion was present, the computational maximum medial pressure was still consistently lower than the maximum lateral pressure, so quantifying this parameter would not lead to an inaccurate characterization of trends related to the patellofemoral pressure distribution. The computational values for the mean lateral and medial pressure were consistently larger than the experimental values, although the values were closer for intact cartilage than for cartilage with a lesion. These comparisons indicate that the lateral force percentage, the maximum lateral pressure and the maximum medial pressure are the most reliable parameters for computational characterization of the patellofemoral force and pressure magnitudes.
Magnitude differences between the computational and experimental data could be related to the accuracy of either technique. The computational modeling technique includes several approximations, such as representation of cartilage with nonlinear springs, estimation of muscle attachment points, and the method for initially aligning the patella within the trochlear groove at each flexion angle. The current alignment method was utilized instead of fixing motion tracking sensors to the bones due to the need for simulation of function in the future with models representing symptomatic knees of patients. Also, computationally removing springs to represent a defect does not replicate the interaction between an intact layer of cartilage on the femur and a defect on the patella (Gratz et al., 2009), which could contribute to the weaker agreement between computational and experimental data with a lesion present. Experimental error could also contribute to differences in magnitude between computational and experimental data. Sources of experimental error include the sensor influencing contact mechanics (Wu et al., 1998), wrapping the sensor around the patella (Wilson et al., 2003), sensitivity of the sensor to shear loads (Ramappa et al., 2006), hysteresis and drift of the sensors, and cartilage compliance influencing the sensor output. During calibration, the compliance of cartilage was approximated but not duplicated by sandwiching each sensor between sheets of neoprene rubber (Wilson et al., 2003). The non-linear calibration curves developed using rubber could have provided the closest representation of cartilage at the high end of the scale, contributing to a more accurate representation of maximum pressures than mean pressures.
Relatively few studies have been performed to directly compare the output from computational models of the patellofemoral joint to experimental data. Computational kinematic measurements and contact area measurements have been compared to in vitro experimental data and data obtained from in vivo imaging as a means of validation (Besier et al, 2005; Besier et al., 2008; Heegaard et al., 1995; Kwak et al, 2000). One previous study compared in vitro experimental and computational pressure measurements, with a focus on relative changes caused by varying quadriceps loading (Elias et al, 2004). The model used for the previous comparison between computational and experimental pressure measurements also utilized DEA. For the previous study, knee models were reconstructed from CT images, instead of MRI. The patella tendon was represented by force vectors instead of springs, and non-linear cartilage deformation was not included. The current model also includes representation of cartilage lesions, which, to the authors’ knowledge, has not been included in any other patellofemoral computational model.
The current model represents another step in the evolution of a computational model of the patellofemoral joint. Models can be rapidly developed to represent individual knees and easily manipulated to vary loading conditions or include cartilage lesions. The DEA technique allows rapid calculation of the patellofemoral pressure distribution, so studies can include several knees tested at multiple flexion angles. Parametric variations in loading conditions and cartilage conditions that cannot be easily applied in vitro can be applied computationally, and models can be developed to represent the patellofemoral pathology that contributes to overloading lateral cartilage. Based on the current results, computational modeling can characterize how varying quadriceps loading influences specific parameters related to the patellofemoral force and pressure distributions.
ACKNOWLEDGEMENT
The assistance provided by Derek Goerke and Laura Gump related to creation of computational models and collection of computational data, respectively, is greatly appreciated.
Footnotes
Publisher's Disclaimer: This is a PDF file of an unedited manuscript that has been accepted for publication. As a service to our customers we are providing this early version of the manuscript. The manuscript will undergo copyediting, typesetting, and review of the resulting proof before it is published in its final citable form. Please note that during the production process errors may be discovered which could affect the content, and all legal disclaimers that apply to the journal pertain.
CONFLICT OF INTEREST STATEMENT
The study described was supported by Grant Number R03HD048534 from the National Institute of Child Health And Human Development of the National Institutes of Health. The authors have no additional professional or financial affiliations related to the subject of this study.
REFERENCES
- 1.Besier T, Gold G, Beaupré G, Delp S. A modeling framework to estimate patellofemoral joint cartilage stress in vivo. Medicine and Science in Sports and Exercise. 2005;37:1924–30. doi: 10.1249/01.mss.0000176686.18683.64. [DOI] [PubMed] [Google Scholar]
- 2.Besier T, Gold G, Delp S, Fredericson M, Beaupre G. The influence of femoral internal and external rotation on cartilage stresses within the patellofemoral joint. Journal of Orthopaedic Research. 2008;26:1627–35. doi: 10.1002/jor.20663. [DOI] [PubMed] [Google Scholar]
- 3.Besl P, McKay N. A method for registration of 3-D shapes. IEEE Transactions on Pattern Analysis and Machine Intelligence. 1992;14:239–56. [Google Scholar]
- 4.Blankevoort L, Kuiper J, Huiskes R, Grootenboer H. Articular contact in a three-dimensional model of the knee. Journal of Biomechanics. 1991;24:1019–1031. doi: 10.1016/0021-9290(91)90019-j. [DOI] [PubMed] [Google Scholar]
- 5.Cohen Z, Henry J, McCarthy D, Mow V, Ateshian G. Computer simulations of patellofemoral joint surgery. Patient-specific models for tuberosity transfer. American Journal of Sports Medicine. 2003;31:87–98. doi: 10.1177/03635465030310012701. [DOI] [PubMed] [Google Scholar]
- 6.Elias J, Cosgarea A. Technical errors during medial patellofemoral ligament reconstruction could overload medial patellofemoral cartilage: A computational analysis. American Journal of Sports Medicine. 2006;34:1478–1485. doi: 10.1177/0363546506287486. [DOI] [PubMed] [Google Scholar]
- 7.Elias J, Kilambi S, Goerke D, Cosgarea A. Improving vastus medialis obliquus function reduces pressure applied to lateral patellofemoral cartilage. Journal of Orthopaedic Research. 2009;27:578–583. doi: 10.1002/jor.20791. [DOI] [PMC free article] [PubMed] [Google Scholar]
- 8.Elias J, Wilson D, Adamson R, Cosgarea A. Evaluation of a computational model used to predict the patellofemoral contact pressure distribution. Journal of Biomechanics. 2004;37:295–302. doi: 10.1016/s0021-9290(03)00306-3. [DOI] [PubMed] [Google Scholar]
- 9.Farahmand F, Senavongse W, Amis A. Quantitative study of the quadriceps muscles and trochlear groove geometry related to instability of the patellofemoral joint. Journal of Orthopaedic Research. 1998;16:136–43. doi: 10.1002/jor.1100160123. [DOI] [PubMed] [Google Scholar]
- 10.Fulkerson J. Diagnosis and treatment of patients with patellofemoral pain. American Journal of Sports Medicine. 2002;30:447–456. doi: 10.1177/03635465020300032501. [DOI] [PubMed] [Google Scholar]
- 11.Fulkerson J, Shea K. Disorders of patellofemoral alignment. Journal of Bone and Joint Surgery. 1990;72-A:1424–1429. [PubMed] [Google Scholar]
- 12.Genda E, Iwasaki N, Li G, MacWilliams B, Barrance P, Chao E. Normal hip joint contact pressure distribution in single-leg standing--effect of gender and anatomic parameters. Journal of Biomechanics. 2001;34:895–905. doi: 10.1016/s0021-9290(01)00041-0. [DOI] [PubMed] [Google Scholar]
- 13.Gratz KR, Wong BL, Bae WC, Sah RL. The effects of focal articular defects on cartilage contact mechanics. Journal of Orthopaedic Research. 2009;27:584–92. doi: 10.1002/jor.20762. [DOI] [PMC free article] [PubMed] [Google Scholar]
- 14.Heegaard J, Leyvraz P, Curnier A, Rakotomanana L, Huiskes R. The biomechanics of the human patella during passive knee flexion. Journal of Biomechanics. 1995;28:1265–79. doi: 10.1016/0021-9290(95)00059-q. [DOI] [PubMed] [Google Scholar]
- 15.Huberti H, Hayes W. Contact pressures in chondromalacia patellae and the effects of capsular reconstructive procedures. Journal of Orthopaedic Research. 1988;6:499–508. doi: 10.1002/jor.1100060405. [DOI] [PubMed] [Google Scholar]
- 16.Kumagai M, Mizuno Y, Mattessich S, Elias J, Cosgarea A, Chao E. Posterior cruciate ligament rupture alters in vitro knee kinematics. Clinical Orthopaedics and Related Research. 2002;395:241–8. doi: 10.1097/00003086-200202000-00029. [DOI] [PubMed] [Google Scholar]
- 17.Kwak S, Blankevoort L, Ateshian G. A Mathematical Formulation for 3D Quasi-Static Multibody Models of Diarthrodial Joints. Computer Methods in Biomechanics and Biomedical Engineering. 2000;3:41–64. doi: 10.1080/10255840008915253. [DOI] [PubMed] [Google Scholar]
- 18.Makhsous M, Lin F, Koh J, Nuber G, Zhang L. In vivo and noninvasive load sharing among the vasti in patellar malalignment. Medicine and Science in Sports and Exercise. 2004;36:1768–75. doi: 10.1249/01.mss.0000142302.54730.7f. [DOI] [PubMed] [Google Scholar]
- 19.Powers C. Rehabilitation of patellofemoral joint disorders: a critical review. Journal of Orthopaedic and Sports Physical Therapy. 1998;28:345–54. doi: 10.2519/jospt.1998.28.5.345. [DOI] [PubMed] [Google Scholar]
- 20.Ramappa AJ, Apreleva M, Harrold FR, Fitzgibbons PG, Wilson DR, Gill TJ. The effects of medialization and anteromedialization of the tibial tubercle on patellofemoral mechanics and kinematics. American Journal of Sports Medicine. 2006;34:749–756. doi: 10.1177/0363546505283460. [DOI] [PubMed] [Google Scholar]
- 21.Saleh K, Arendt E, Eldridge J, Fulkerson J, Minas T, Mulhall K. Operative treatment of patellofemoral arthritis. Journal of Bone and Joint Surgery. 2005;87-A:659–671. doi: 10.2106/JBJS.D.03035. [DOI] [PubMed] [Google Scholar]
- 22.Tang S, Chen C, Hsu R, Chou S, Hong W, Lew H. Vastus medialis obliquus and vastus lateralis activity in open and closed kinetic chain exercises in patients with patellofemoral pain syndrome: an electromyographic study. Archives of Physical Medicine and Rehabilitation. 2001;82:1441–5. doi: 10.1053/apmr.2001.26252. [DOI] [PubMed] [Google Scholar]
- 23.Wilson D, Apreleva M, Eichler M, Harrold F. Accuracy and repeatability of a pressure measurement system in the patellofemoral joint. Journal of Biomechanics. 2003;36:1909–15. doi: 10.1016/s0021-9290(03)00105-2. [DOI] [PubMed] [Google Scholar]
- 24.Wu J, Herzog W, Epstein M. Effects of inserting a pressensor film into articular joints on the actual contact mechanics. Journal of Biomechanical Engineering. 1998;120:655–9. doi: 10.1115/1.2834758. [DOI] [PubMed] [Google Scholar]


