

Abstract
The purpose of this study was to determine transient functional signal activity in a small, homogeneous group of left temporal lobe epilepsy (TLE) patients, without the use of EEG; and to use one of these activated regions to identify a possible epileptogenic network across the whole brain in this group. Resting functional MRI scanning was performed on five left TLE patients who underwent selective amygdalohippocampectomy resulting in seizure control and ten healthy control subjects. Activation maps of functional signal peaks were calculated using a data-driven analysis, 2dTCA, across the group of patients. In addition to the expected region of activation in the left anterior hippocampus, the results of the 2dTCA analysis revealed activity in the bilateral insular cortex and default-mode network which are not commonly reported using fMRI, but are supported by other electrical and functional changes. The region of activation corresponding to the anterior hippocampal region of resection (presumably the epileptogenic region) was used as a seed region for fMRI functional connectivity analysis. This revealed increased negative connectivity in the patients as compared to controls across a network including thalamic, brainstem, frontal and parietal regions consistent with theories of inhibited function in subcortical and cortical structures during ictal propagation.
Keywords: temporal lobe epilepsy, brain, functional MRI, connectivity
1. Introduction
Localization of blood oxygenation level dependent (BOLD) signal Magnetic Resonance Imaging (MRI) changes in response to ictal or interictal epileptiform activity can provide valuable and unique information in the assessment of patients with focal (Kobayashi et al., 2006a) and generalized epilepsies (Labate et al., 2005). Most previous studies that have investigated this activity in individual patients have formed their conclusions regarding the population based on similarities across the individuals. However, a few studies have combined relatively homogeneous groups of patients into single analyses to better quantify the level of statistical confidence in the group results. The majority of these group investigations focused on generalized epilepsies (Gotman et al., 2005), though one study focused on temporal lobe epilepsy (TLE) (Laufs et al., 2007). All of these investigations were performed using a combination of EEG and functional MRI (fMRI) which localizes regions that have a specified BOLD signal temporal response (hemodynamic response function, HRF) corresponding to epileptiform activity observed on scalp EEG. However, it is known that much epileptiform activity may not reach the scalp (Tao et al., 2005) and that the HRF of the scalp activity can vary across regions, individuals and time (Bagshaw et al., 2004). This can severely limit the usefulness and success rate of simultaneous EEG and fMRI (Di Bonaventura et al., 2006). The technical and financial issues in implementing the MRI-compatible EEG can also make this impractical for many clinical sites. Therefore, a group analysis of BOLD signal epilepsy-related activations which does not rely on scalp EEG or a pre-defined HRF may offer distinct advantages and provide unique insight into the regions involved in the generation and/or propagation of epileptiform activity.
In addition to localizing regions involved in the epileptiform activity, BOLD fMRI can also be used to determine relationships between these regions. This can be done by quantifying the linear correlations between the low frequency (<0.1 Hz) fluctuations of the BOLD signals of two or more distinct regions (Biswal et al., 1995). This functional connectivity has been measured between regions in healthy controls, as well as several patient groups to determine functional networks across the brain. To date little is known regarding the effects of TLE on functional connectivity across brain networks. However, evidence suggests that connectivity across primarily mesial temporal epileptogenic (Bettus et al., 2008) and functional (Waites et al., 2006; Addis et al., 2007; Wagner et al., 2007; Frings et al., 2008) networks is reduced in these patients.
When studying functional connectivity of the mesial temporal lobe structures, one must consider that the subregions within the mesial temporal lobe have been found to correlate with distinct cortical networks in healthy subjects (Kahn et al., 2008). Also, the definition of these subregions in patients with hippocampal sclerosis or other structural abnormalities may be difficult. Thus, determining functional connectivity between regions defined by functional activation across the group may be more sensitive to epilepsy related changes than using anatomically defined mesial temporal lobe structures.
In this study, our first aim was to use a data-driven, model-free fMRI analysis technique which we have modified and developed, 2dTCA (Liu et al., 2000; Morgan et al., 2007; Morgan et al., 2008b; Morgan and Gore 2009), to determine transient BOLD signal activity in a small, homogeneous group of temporal lobe epilepsy patients, without the use of EEG. We hypothesized that this analysis may highlight brain regions important in the epileptogenic process, whose activity is not necessarily identified on scalp EEG. Our second aim was to use an activated brain region found using 2dTCA to identify a possible epileptogenic network across the whole brain in the group of TLE patients and compare this to a group of healthy controls. We suggest that this analysis will provide a more specific map of regions/networks affected by the epileptogenic activity across the brain than those generated by a small number of anatomically defined regions.
2. Methods
2.1 Subjects
A homogeneous group of five left TLE patients (3F/2M, mean age 34.8 ± 7.4 yrs) who were part of a larger investigation (Morgan et al., 2007) were reanalyzed for this study. All had standard clinical assessments performed including the following: detailed seizure history, neurological examination, interictal and ictal scalp-sphenoidal EEG monitoring with analysis of seizure semiology on video, brain MRI, and positron emission tomography (PET). The inclusion criteria were left mesial temporal epileptogenic zone based on the presurgical evaluation results and freedom from disabling seizures for at least one year after selective amygdalohippocampectomy. The five patients in the current study were all those who met these inclusion criteria from the larger investigation above. Four had left mesial temporal sclerosis confirmed by tissue pathology, and one had a left hippocampal lesion of increased T2 signal. Ten healthy controls were also included (5F/5M, mean age 28.2 ± 5.0 yrs). All healthy controls and four of five patients were right handed by self-report. No healthy control subject had a history of neurological, psychiatric or medical conditions as determined by interview. Written informed consent was obtained prior to scanning of all subjects in accordance with Institutional Review Board guidelines and in compliance with the Declaration of Helsinki.
2.2 MRI scanning
All MRI imaging was performed using a Philips Achieva 3T MRI scanner (Philips Healthcare, Inc., Best, Netherlands) prior to surgery. Patients remained on their regular medications during the MRI scans. Scanning included a three-dimensional high-resolution T1-weighted volume (1 mm × 1 mm × 1 mm) and a two-dimensional, T1-weighted high-resolution image set for functional overlay covering the whole brain (256×256, FOV = 240 mm, 4.5 mm thick/0.5 mm gap, 30 axial slices). Functional scanning was performed using T2* weighted gradient-echo, echo planar BOLD fMRI scans with subject instructed to hold still with eyes closed (64 × 64, 3.75 mm × 3.75 mm, FOV = 240 mm, 4.5 mm thick/0.5 mm gap, TE=35 ms, TR = 2 sec, 200 volumes per series). Patients underwent two to three series (depending on time and patient cooperation) and healthy controls had one resting BOLD series acquired. For patients, only one BOLD series was analyzed for this study.
2.3 Image analysis
The images were analyzed using the following procedure using SPM5 image analysis software [http://www.fil.ion.ucl.ac.uk/spm/software/spm5/]. All functional BOLD image sets were corrected for slice timing effects, motion corrected and spatially normalized to the Montreal Neurological Institute (MNI) template using co-registration to the three-dimensional and two-dimensional T1-weighted structural image sets as intermediate steps. This resulted in functional image series of 47 × 56 × 46 voxels (4 × 4 × 4 mm). These images were spatially smoothed using a 7 mm FWHM kernel.
The next step in the analysis was to determine regions of BOLD response in the patient data. This conventionally is done by acquiring concurrent EEG data and using this to identify times at which interictal epileptiform activity occurred during the fMRI acquisition (Gotman et al., 2006). Then an event-related, general linear model (GLM) type analysis is performed to localize this activity. In this study, EEG was not acquired. Instead, a data-driven temporal clustering approach, 2dTCA (Liu et al., 2000; Morgan et al., 2007), was utilized to search each voxel’s fMRI time course for transient BOLD “peaks” and then to cluster those voxel time courses whose timings of peaks were similar. Here we define the term BOLD “peaks” as transient changes in the BOLD signal that are at least 1.5 standard deviations greater than the mean through time.
The 2dTCA method is a modification of the temporal clustering algorithm (TCA) first introduced by Liu et al. (Liu et al., 2000) to find the temporal response and location of eating-related neural activity. In the original study, a signal of interest was defined as the maximum BOLD signal across time. These signal maxima of all voxels across the brain were mapped into a histogram where the x-axis indicated the time point and the y-axis showed the number of voxels in the brain that had a maximum at that time point. Peaks in the histogram indicated times at which many voxels reached their maxima simultaneously suggesting timing of responses to the eating stimulus. The TCA algorithm was later implemented to identify times at which BOLD signals experienced a transient “peak” (instead of maximum) in order to detect epileptic spiking (Morgan et al., 2004). However, all sources of BOLD signal spiking would be mapped to a single histogram, revealing a fundamental susceptibility of the technique to artifacts, particularly to head motion (Hamandi et al., 2005).
In order to separate the transient signals coming from different sources, we then developed the 2dTCA analysis (Morgan et al., 2008b; Morgan and Gore 2009). This method creates separate histograms for signals with different timing. In our case we map all BOLD time courses which share a time of maximum signal increase in the same histogram. This modification of the original algorithm can create separate histograms that may be from different sources, thereby separating signals of interest from similar signals caused by motion, noise or other confounds. This algorithm is illustrated and validated in phantoms in (Morgan et al., 2008b), while further validation in normal controls and a more thorough exploration of several parameters in the algorithm can be found in (Morgan and Gore 2009). These resulting histograms have peaks indicating when many voxels experience the transient peak in BOLD signal. We consider these histograms as timing profiles that can be used as regressors in the GLM. Because the number of voxels that are included in each of the histograms can vary greatly, they are normalized by subtracting the mean and dividing by the standard deviation before being used as regressors.
The five patient fMRI datasets (one for each subject) were analyzed together (concatenated) for BOLD response timing using the 2dTCA algorithm implemented in Matlab (The MathWorks, Inc., Natick, MA). The resulting histograms were normalized and were used as regressors of interest in a GLM in a fixed-effects group analysis with the global time course (average time course of all voxels in the brain) and six motion time courses from SPM5 (three translations and three rotations) included as confounds. An activation map was created using each regressor of interest separately with a minimum t-statistic of t>4 with cluster size 5 (approximately p<0.01 corrected for multiple comparisons). These map(s) represent regions of transient BOLD activation across the group of five patients.
From these activation maps, an activated cluster was identified which most likely localizes the epileptiform interictal activity based on the region of resection in the left anterior hippocampus across the group. The average time course across all voxels in this region in each patient was determined as the seed time course for the connectivity analysis of each patient. The seed time course was low-pass filtered at a cutoff frequency of 0.1 Hz and the global time course and six motion time courses were regressed out of the seed time course. All of the preprocessed functional images were also low pass filtered at the same cutoff frequency as the seed. Then the seed time course, the global time course and the six motion time courses for each individual patient were used as regressors in a GLM in a fixed-effects group analysis using the low-pass filtered fMRI images. This analysis yields voxels whose time courses are correlated with the seed time course and is considered a map of functional connectivity across the group (Biswal et al., 1995). The analysis was repeated using the same seed region in the ten healthy controls as a group. Both positive and negative correlations were determined across each group. To identify regions of significant connectivity, the MNI coordinates of activated clusters in the connectivity maps were converted to Talairach coordinate estimates using an SPM5 supplied function (mni2tal.m, http://imaging.mrc-cbu.cam.ac.uk/imaging/MNITalairach). These Talairach coordinate estimates were then identified in the brain using a standard Talairach atlas.
Finally, we compared the connectivity to the seed region between the patients and the healthy controls. To do this, the contrast image of this first level analysis (beta weight of each voxel of the seed regressor of interest) of each subject was then entered into a second-level, two-sample t-test of patients vs. healthy controls.
3. Results
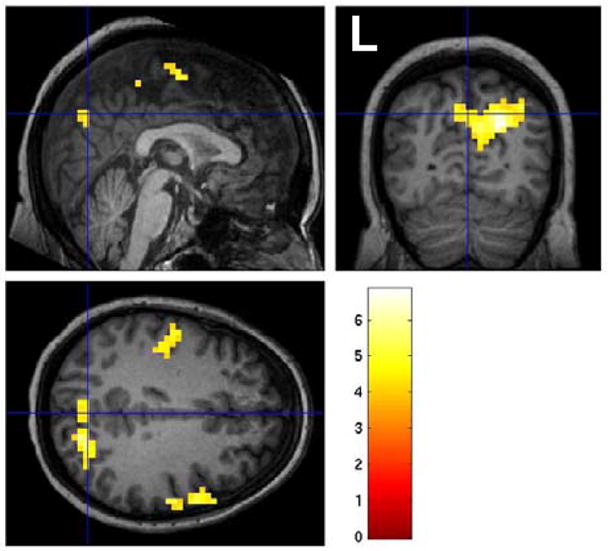
The motion correction using SPM5 revealed maximum translations in the x, y, and z directions to be 0.60 mm, 1.06 mm, and 1.91 mm, respectively in the five patients, and 1.31 mm, 0.89 mm, and 1.70 mm in the ten controls. All were considered acceptable and all datasets were used for the rest of the analysis. The 2dTCA analysis yielded four unique histograms or peak timing profiles of transient BOLD activation resulting in four activation maps (p<0.01 corrected for multiple comparisons) (Figure 1). The 2dTCA normalized histogram regressor for one patient is shown with each map. Map #1 shows the most prominent activation bilaterally centered around the insular cortex. Maps #2 and #3 include regions of activation in the posterior cingulate and bilateral inferior parietal cortices and middle frontal gyrus most commonly associated with the so-called default-mode network (Raichle et al., 2001). Map #4 demonstrates primarily activation in the left anterior hippocampus. This region coincides with the region of resection as shown and is used as the seed region for the connectivity analysis (Figure 2).
Figure 1.

Group localization of transient BOLD peaks across five TLE patients determined using 2dTCA (p<0.01 corrected for multiple comparisons). Four different transient BOLD peak timing profiles were determined and so four maps were created localizing this activity. Color bars represent T-values. Below each map is the plot of the 2dTCA normalized regressor from one of the five patients used to create each map.
Figure 2.

Activated cluster seed region compared to region of resection in a single subject. a) Post-surgical T2-weighted MRI image showing resected region of left anterior hippocampus in a single patient. b) Activated cluster from group activation map #4 from Figure 1. Color bar represents T-values. Cross hairs are shown in the same location in each figure to illustrate agreement between resection and activated region.
The group connectivity map to the left anterior hippocampus seed region across the five patients is shown in Figure 3 (p<0.001 FWE cluster 10). The MNI coordinates and the descriptions of the significant coordinates are given in Table 1. The strongest positive connectivity was found in the left and right parahippocampal regions, while negative connectivity (implying an inverse relationship) was strongest in the right inferior parietal regions and pre- and post-central gyrus regions of the frontal lobe. Figure 4 and Table 2 provide the same connectivity information for the group of ten healthy controls at the same statistical threshold. While the positive connectivity in the controls is very similar to the patients, the strongest negative connectivity in the controls occurs in the left occipital lobe and left middle temporal gyrus. The regions with greater functional connectivity to the left anterior hippocampus seed region in the controls compared to the TLE patients are given in Figure 5 and Table 3 (p < 0.005 uncorrected, cluster size 10). No regions were significant at the p<0.001 FWE cluster 10 level used in each group connectivity map. These regions significant at the reduced level generally corresponded to those found to have increased negative connectivity in TLE including thalamus, pre- and post-central gyrus regions, and superior parietal regions. No regions showed greater positive connectivity to the seed in the patients compared to the controls at either level.
Figure 3.

Functional connectivity to left anterior hippocampus (arrow) across group of five left TLE patients (p<0.001 FWE cluster 10). a) Positive connectivity to seed region. b) Negative connectivity to seed region. Color bars represent T-values.
Table 1.
Significant clusters of connectivity to left anterior hippocampus seed region for group of five left TLE patients (p<0.001 FWE, cluster 10)
| type of response | max T-value | MNI coordinates (mm) | region | ||
|---|---|---|---|---|---|
| x | y | z | |||
| positive | 29.96 | −24 | −24 | −12 | seed, left parahippocampal gyrus (BA 28) |
| positive | 12.08 | 24 | −24 | −12 | right parahippocampal gyrus (BA 28) |
| positive | 11.28 | 12 | −36 | −8 | right cerebellum |
| positive | 8.56 | 8 | −52 | 4 | right posterior cingulate (BA 29) |
| negative | 9.88 | 32 | −48 | 44 | right inferior parietal (BA 40) |
| negative | 7.92 | 36 | −24 | 56 | right precentral gyrus (BA 4) |
| negative | 7.12 | 40 | −24 | 44 | right post central gyrus (BA 3) |
| negative | 9.11 | 24 | −72 | 44 | right superior parietal lobe (BA 7) |
| negative | 8.51 | −12 | −80 | −20 | left cerebellum |
| negative | 6.72 | −20 | −88 | −20 | left occipital lobe (BA 18) |
| negative | 8.39 | −52 | −12 | 36 | left precentral gyrus (BA 6) |
| negative | 7.95 | 12 | −44 | 64 | right post central gyrus (BA 3) |
| negative | 7.93 | 4 | −32 | 56 | right paracentral lobule (BA 6) |
| negative | 8.05 | 0 | −24 | 0 | left brainstem |
| negative | 5.95 | 12 | −16 | 0 | right thalamus |
| negative | 6.88 | 4 | −76 | −4 | right occipital lobe (BA 18) |
| negative | 6.52 | 0 | −72 | 4 | left occipital lobe, cuneus (BA 30) |
| negative | 6.12 | 24 | −76 | −16 | right occipital lobe (BA 18) |
| negative | 6.57 | 20 | −12 | 72 | right superior frontal gyrus (BA 6) |
| negative | 6.33 | −16 | −68 | 4 | left posterior cingulate (BA 30) |
| negative | 6.08 | −16 | −72 | 16 | left occipital lobe, cuneus (BA 18) |
Figure 4.

Functional connectivity to left anterior hippocampus (arrow) across group of ten healthy controls (p<0.001 FWE cluster 10). a) Positive connectivity to seed region. b) Negative connectivity to seed region. Color bars represent T-values.
Table 2.
Significant clusters of connectivity to left anterior hippocampus seed region for group of ten healthy controls (p<0.001 FWE, cluster 10)
| type of response | max T-value | MNI coordinates (mm) | region | ||
|---|---|---|---|---|---|
| x | y | z | |||
| positive | 38.01 | −20 | −16 | −12 | left lateral globus pallidus |
| positive | 22.04 | 20 | −16 | −16 | right parahippocampal gyrus (BA 28) |
| positive | 15.39 | 20 | 8 | −16 | right frontal lobe (BA 34) |
| positive | 7.02 | 20 | 24 | 12 | right caudate |
| negative | 8.64 | −24 | −68 | 24 | left occipital lobe, precuneus (BA 31) |
| negative | 7.88 | −32 | −56 | 20 | left middle temporal gyrus (BA 39) |
| negative | 7.61 | 24 | −44 | 44 | right frontal lobe (BA 5) |
| negative | 7.61 | −20 | −20 | 44 | left cingulate gyrus (BA 24) |
| negative | 6.46 | −20 | −36 | 48 | left post central gyrus (BA 3) |
Figure 5.

Difference between connectivity to left anterior hippocampus (arrow) between group of five left TLE patients and ten healthy controls patients (p<0.005 uncorrected, cluster 10). Map shows regions where connectivity to seed is increased in controls over TLE patients due to increased negative connectivity in TLE patients (see discussion). No other changes were detected at this significance level. Color bars represent T-values.
Table 3.
Significant clusters of difference in connectivity to left anterior hippocampus seed region between group of five left TLE patients and ten healthy controls (p<0.005 uncorrected, cluster 10)
| max T-value | MNI coordinates (mm) | region | ||
|---|---|---|---|---|
| x | y | z | ||
| 10.13 | 4 | −24 | 0 | right thalamus |
| 4.05 | −24 | −20 | 4 | left basal ganglia |
| 5.72 | 24 | −64 | 56 | right superior parietal lobe (BA 7) |
| 5.28 | 24 | −60 | 32 | right precuneus (BA 7) |
| 4.6 | 32 | −44 | −20 | right fusiform gyrus (BA 37) |
| 4.14 | 24 | −52 | −16 | right cerebellum |
| 4.42 | 4 | −28 | 56 | right medial frontal gyrus (BA 6) |
| 3.68 | 8 | −36 | 60 | right paracentral lobule (BA 6) |
| 3.53 | 12 | −44 | 64 | right post central gyrus (BA 3) |
| 3.14 | 4 | −76 | 0 | right occipital lobe (BA 18) |
| 4.2 | −8 | −56 | −16 | left cerebellum |
| 4.06 | −20 | −24 | 64 | left precentral gyrus (BA 4) |
| 3.97 | 60 | 12 | 12 | right inferior frontal gyrus (BA 44) |
| 3.39 | 64 | 0 | 12 | right precentral gyrus (BA 6) |
| 3.15 | 60 | 4 | 24 | right inferior frontal gyrus (BA 9) |
| 3.79 | −20 | −88 | 12 | left middle occipital gyrus (BA 18) |
| 3.72 | −28 | −84 | 4 | left middle occipital gyrus (BA 19) |
| 3.34 | −20 | −92 | −4 | left lingual gyrus (BA 17) |
| 3.73 | 16 | −28 | 72 | right precentral gyrus (BA 4) |
| 3.57 | 36 | −20 | 72 | right precentral gyrus (BA 6) |
| 3.72 | −44 | 36 | 8 | left inferior frontal gyrus (BA 46) |
4. Discussion
In this study we identified a region of activation in the left anterior hippocampus believed to correspond to the epileptogenic zone. We then created a map of all other regions functionally connected to this left hippocampal volume across the group. We compared this connectivity map to one produced from the same region in a group of healthy control subjects, and found increased negative connectivity in the patients as compared to controls across a network including thalamic, brainstem, frontal and parietal regions.
4.1 2dTCA group activation maps
The maps of BOLD signal peaks created by 2dTCA showed significant activation in the left anterior hippocampus (map #4) as expected and found by others in individual (Aghakhani et al., 2006; Kobayashi et al., 2006a) and in a group analysis (Laufs et al., 2007) using EEG/fMRI and also using 2dTCA (Morgan et al., 2007). However, the strong activation in the insular cortex (map #1) has not been previously reported as a significant finding in TLE using fMRI, but the role of the insular cortex in TLE is supported by other functional imaging methods. With [18F] flourodeoxyglucose (FDG) PET, interictal hypometabolism was found in the ipsilateral insula when mesial TLE patients were compared to other types of TLE patients (Chassoux et al., 2004) and healthy controls (Bouilleret et al., 2002). Measurements of cerebral blood flow made interictally with [15O]PET (Giovacchini et al., 2007) showed significant decreases in bilateral insular blood flow as compared to controls and ictal 99m-Tc ethyl cystinate dimer single photon emission tomography (ictal SPECT) (Kim et al., 2008) showed significant increases in the bilateral insula in mesial TLE compared to neocortical epilepsy. These functional changes can be explained by the intracranial electrical recordings obtained by Isnard, et al. (Isnard et al., 2000) in which the insula was invaded by ictal discharges in all patients and even originated in the insula in some. In addition, eight of 21 patients had insular interictal epileptiform discharges. Interestingly, the interictal insular discharges were almost always asynchronous from those arising from the hippocampus, and the ictal discharges arising from the hippocampus sometimes took up to 30 seconds to propagate to the insula. If the majority of the discharges detected by scalp EEG in TLE are generated from the hippocampus, then the asynchrony between the hippocampal and insular discharges may explain why the insula is not identified as activated with EEG/fMRI, but is detected by 2dTCA.
The 2dTCA activation maps #2 and #3 revealed activations usually referred to as part of the default-mode network (Raichle et al., 2001; Buckner et al., 2008) which is believed to represent baseline brain activities at rest, but which is suspended during specific goal oriented tasks. This network was not detected using 2dTCA in a previous study of controls (Morgan et al., 2008a), but has been found to be negatively activated in response to interictal activity using EEG/fMRI in generalized epilepsy (Salek-Haddadi et al., 2003) and is hypothesized to be related to the brief state of reduced responsiveness occurring with spike-and-wave discharges (Gotman et al., 2005). In TLE, individual patient analyses with EEG/fMRI have revealed only a few cases of default-mode deactivation (Kobayashi et al., 2006b; Salek-Haddadi et al., 2006), but it has been detected on the group level (Laufs et al., 2007) and detected as areas of hypoperfusion using SPECT (Dupont et al., 2009). In the fMRI group analysis, the HRF was varied a few seconds in time to account for differences in the timing of the response. This suggests that the HRF of this deactivation varies temporally across EEG spiking. Because EEG/fMRI is most sensitive to those signals with direct and static temporal relationships to the EEG spiking, this response may not be detected via this method.
The fact that 2dTCA detected positive BOLD changes while EEG/fMRI detects negative changes is more difficult to interpret. One possibility is that weaker negative BOLD changes occur in the default-mode network at times near the EEG events with temporal variation, but that positive BOLD changes occur at times even less temporally correlated to the EEG events. We examined this possibility by creating an activation map of negative BOLD responses occurring at times when the positive BOLD responses are occurring in the hippocampus. In other words, we created a negative contrast map of the 2dTCA regressor from map #4. This is shown in Figure 6 and shows only minimal default-mode network activation primarily in the posterior cingulate cortex as might be expected if the HRF varies temporally. The physiological basis for the positive BOLD activity in this network is unknown, but may be the result of propagation of signal along the large number of cortical inputs from the hippocampal formation to the retrosplenial cortex adjacent to the posterior cingulate cortex (Kobayashi and Amaral 2003; Buckner et al., 2008).
Figure 6.
Negative BOLD signal changes temporally correlated with positive BOLD changes in the left anterior hippocampus in left TLE patients (Figure 1, map #4) (p<0.01 corrected for multiple comparisons). Color bars represent T-values.
4.2 Positive functional connectivity maps
The left anterior hippocampal region activated in map #4 coincides with the region resected that resulted in seizure control (Figure 2), suggesting that this activated region defines the origin of the epileptogenic activity across the group. Therefore, we used this activated region as a seed region in the functional connectivity analysis to find all regions in the brain with correlating BOLD signal fluctuations. The positive functional connectivity maps created from the TLE patients (Figure 3a, Table 1) and the healthy controls (Figure 4a, Table 2) both show the strongest connection to the left parahippocampal regions and to the right hippocampus and medial temporal regions and the temporal poles. This has been previously reported in healthy controls at rest (Rombouts et al., 2003). The controls’ connectivity also extends into the anterior cingulate and the posterior cingulate. These findings agree with those of Buckner et al., who considered the hippocampus as part of the default-mode network and determined that it has the strongest connections to the ventro-medial prefrontal cortex and the posterior cingulate/retrospenial cortex, and the weakest connectivity to the bilateral inferior parietal cortices of this network (Buckner et al., 2008). The patients’ connectivity map appears very similar in general, but with less extension to the frontal lobe and cerebellum.
4.3 Negative functional connectivity maps
Negative functional connectivity to a seed region in this work is defined as negative inter-regional correlation, which can arise from regions with BOLD signals fluctuating 180° out of phase with one another. This anti-correlation has previously been associated between working memory task activated regions and the default-mode network and has been hypothesized to reflect opposing or competitive processes within the brain. Others have argued that in fMRI, anti-correlations may be introduced in error by the regression of the global signal in the preprocessing of the images (Murphy et al., 2008). In this work, the global signal has been regressed, but the negative connectivity map to the left anterior hippocampus in left TLE patients reveals regions with an interesting relationship to this seed. The regions of reduced connectivity in the fronto-central regions, cingulate, medial occipital lobe and thalamus agree with regions of cortical thinning found in TLE by MRI-based cortical thickness analysis (Lin et al., 2007), hypometabolism by PET (Arnold et al., 1996) or perfusion changes by ictal SPECT (Blumenfeld et al., 2004; Tae et al., 2005). In the healthy controls, the negative connectivity was much less widespread occurring only in a small region of the cingulate and fronto-central regions and in the left precuneus.
4.4 Difference in connectivity between TLE and controls
When functional connectivity maps between the group of TLE patients and the healthy controls were compared statistically, we found greater connectivity in the controls compared to the TLE patients in mostly the same regions as we found negative connectivity in the TLE patients (Figures 3b, 5 and Tables 1, 3). This would suggest that there was not increased connectivity in the controls, but rather stronger anti-correlations in the patients with the strongest changes found in the thalamus. To verify this we calculated the average beta value in the linear model corresponding to the hippocampal seed time course across the entire negative connectivity network (p < 0.005 uncorrected, cluster 10) for each subject. This beta value represents the correlation of the seed time course to each voxel time course in the map, after regressing out the motion and global signal. The average beta value across the TLE patients and healthy controls was −5.4 and 2.5, respectively, showing that the TLE patients had a stronger connectivity relationship in the network than the controls. This relationship was one of anti-correlation or possible phase difference (i.e. temporal lag).
This anti-correlation or phase lagged relationship between the hippocampus and thalamus in TLE may be related to the structural atrophy and gray matter reductions found in these regions using MRI voxel based morphometry methods (McMillan et al., 2004) and suggested by the reduction of N-acetyl aspartate to creatine ratios determined by MRI spectroscopy (Hetherington et al., 2007). Electrographically, activity within the thalamus has been detected in concurrence with mesial temporal seizures with latency times ranging from 0–77 seconds (Bertram et al., 2001; Guye et al., 2006; Rosenberg et al., 2006). Lack of interictal electrical activity reported in this region and others in the negative connectivity network may explain the few reports of activity detected there by previous fMRI methods in unilateral mesial TLE patients (Aghakhani et al., 2006).
The physiological basis of this anti-correlated network may be explained by the findings of Englot et al.(Englot et al., 2008). In rat models of epilepsy during partial limbic seizures they found increases in oxygen metabolism and neuronal activity in the hippocampus with simultaneous decreases in the frontal cortex. They note that these decreases persist into the postictal period suggesting an association with impaired consciousness seen in this period. These results imply that this negative functional connectivity map including the thalamus, brainstem, cerebellum and frontal and parietal regions may delineate a network of ictal propagation as proposed by Norden and Blumenfeld (Norden and Blumenfeld 2002) described by the “network inhibition hypothesis”. This theory proposes that complex partial seizures arising from the temporal lobe propagate to both the medial thalamus and upper brain stem and then to the frontal and parietal association cortices. The frontal regions of the negative connectivity map found here, however, are not part of the association cortex where Blumenfeld et al. (Blumenfeld et al., 2004) measured perfusion decreases, but do coincide with several regions of perfusion increases several seconds after seizure onset (Blumenfeld et al., 2004; Tae et al., 2005). Also, the timing delay of this propagation may explain the negative correlation of this network to the hippocampus, rather than a positive one. Overall, more evidence is needed to clarify or validate this theory in relation to the findings of this study.
4.5 Limitations and potential errors
The relatively low number of epilepsy patients included in this study may lead to reduced sensitivity to the effects of interest including group activation and connectivity differences. However, in order to maintain an acceptable level of homogeneity across the group, the inclusion/exclusion criteria were restrictive. This raises the possibility that the fixed effects analysis used for determining the TLE group activation map may be dominated by a single dataset. We explored this possibility by examining the activation maps of each individual and qualitatively comparing them to the group results, i.e the left hippocampus map, the bilateral insula map and the default-mode network map. We found that three of the five patients showed peaks of activation in the left hippocampus or left mesial temporal lobe region at the p<0.01 level (t>4 cluster size 10). However, at a reduced threshold (t>2) four of five patients had large clusters of activation along the left hippocampus and the other had a very small, weaker cluster in the left posterior region of the hippocampus.
Considering the default-mode network activation maps, we found all five subjects had activation at the p<0.01 level in these regions. Three out of the five subjects had bilateral insula activation map from the other 2dTCA regressor at the p<0.01 level. We, therefore, feel confident that the activation results are representative of the group and not of a single individual patient. On the other hand, these results also suggest the ability of 2dTCA to detect activation in a single patient, however this study does not address this issue directly.
One potential source of error in the measurement of functional connectivity is physiological noise. Correlations across regions can be introduced by cardiac and respiratory changes (Bhattacharyya and Lowe 2004; Birn et al., 2006) across the brain independent of neuronally driven BOLD responses. The effect of these confounding signals on measures of functional connectivity can be reduced or minimized using linear regression. It has been determined that regression of the global time course has the greatest influence on connection strength, however regression of white matter and cerebrospinal fluid signals may also be helpful (Weissenbacher et al., 2009). The results presented here were determined using only global signal regression, but when the analyses were repeated including white matter and cerebrospinal fluid signal regressors, the results were the same. It should be noted that while negative correlations can be detected without global time course removal (Chang and Glover 2009; Fox et al., 2009), it possible for this process to introduce negative correlations between regions (Murphy et al., 2008). Therefore, the negative connectivity results are interpreted with caution as described above.
Finally, the lack of concurrent EEG with this study limits our ability to interpret the electrical correlates of the timing profiles generated by the 2dTCA algorithm. This information will be essential in a full evaluation of this method outside the scope of this work. However, simultaneous scalp EEG cannot be regarded as the gold standard for identifying generators of BOLD spiking in epilepsy as evidenced by Jacobs et al., in their recent study that showed a large variability in shape and timing of the HRF with respect to the scalp EEG spikes (Jacobs et al., 2009). In many patients, the BOLD responses preceding the spikes were more localizing than later responses making the appropriate analysis technique unclear. In addition, Flanagan et al., describes the numerous potential errors in marking up the EEG spikes in EEG/fMRI studies and the effect each has on the fMRI results (Flanagan et al., 2009). Therefore, the role and importance of data-driven analyses of these data cannot be disregarded. For the purposes of this study, the goal was to identify a region of BOLD spiking which was concurrent with the epileptogenic region determined by seizure freedom after resection. The results show that the 2dTCA was useful for this purpose. Future studies will be directed at comparing the results of 2dTCA with simultaneous EEG.
In conclusion, this work represents the first known study to use a data-driven, model-free approach to localize possible seizure-related BOLD activity in a homogeneous group of TLE patients, and to use an activated region as a seed in a connectivity analysis across the whole brain. In addition to the expected region of activation in the left anterior hippocampus, the results of the 2dTCA group analysis revealed regions of activity in the insular cortex and default-mode network which are not commonly reported in temporal lobe epilepsy using fMRI. This highlights the utility of including data-driven BOLD fMRI techniques to model-driven EEG/fMRI analyses of epileptogenic activity. The use of a full brain connectivity analysis with an activated region as the seed revealed a network in the patients that is consistent with theories of inhibited function in subcortical and cortical structures during ictal propagation. Overall, these results illustrate the potential value of the use of these methods to further elucidate the networks and mechanisms involved in the epileptogenic process.
Acknowledgments
This project was supported by the Epilepsy Foundation (VLM) and National Institutes of Health 5R01NS055822 (VLM, BAK).
Footnotes
Publisher's Disclaimer: This is a PDF file of an unedited manuscript that has been accepted for publication. As a service to our customers we are providing this early version of the manuscript. The manuscript will undergo copyediting, typesetting, and review of the resulting proof before it is published in its final citable form. Please note that during the production process errors may be discovered which could affect the content, and all legal disclaimers that apply to the journal pertain.
Contributor Information
Victoria L. Morgan, Email: victoria.morgan@vanderbilt.edu.
John C. Gore, Email: john.gore@vanderbilt.edu.
Bassel Abou-Khalil, Email: bassel.abou-khalil@vanderbilt.edu.
References
- Addis DR, Moscovitch M, McAndrews MP. Consequences of hippocampal damage across the autobiographical memory network in left temporal lobe epilepsy. Brain. 2007;130:2327–2342. doi: 10.1093/brain/awm166. [DOI] [PubMed] [Google Scholar]
- Aghakhani Y, Kobayashi E, Bagshaw AP, Hawco C, Benar CG, Dubeau F, Gotman J. Cortical and thalamic fMRI responses in partial epilepsy with focal and bilateral synchronous spikes. Clin Neurophysiol. 2006;117:177–191. doi: 10.1016/j.clinph.2005.08.028. [DOI] [PubMed] [Google Scholar]
- Arnold S, Schlaug G, Niemann H, Ebner A, Luders H, Witte OW, Seitz RJ. Topography of interictal glucose hypometabolism in unilateral mesiotemporal epilepsy. Neurology. 1996;46:1422–1430. doi: 10.1212/wnl.46.5.1422. [DOI] [PubMed] [Google Scholar]
- Bagshaw AP, Aghakhani Y, Benar CG, Kobayashi E, Hawco C, Dubeau F, Pike GB, Gotman J. EEG-fMRI of focal epileptic spikes: analysis with multiple haemodynamic functions and comparison with gadolinium-enhanced MR angiograms. Human Brain Mapping. 2004;22:179–192. doi: 10.1002/hbm.20024. [DOI] [PMC free article] [PubMed] [Google Scholar]
- Bertram EH, Mangan PS, Zhang D, Scott CA, Williamson JM. The midline thalamus: alterations and a potential role in limbic epilepsy. Epilepsia. 2001;42:967–978. doi: 10.1046/j.1528-1157.2001.042008967.x. [DOI] [PubMed] [Google Scholar]
- Bettus G, Guedj E, Joyeux F, Confort-Gouny S, Soulier E, Laguitton V, Cozzone PJ, Chauvel P, Ranjeva JP, Bartolomei F, Guye M. Decreased basal fMRI functional connectivity in epileptogenic networks and contralateral compensatory mechanisms. Hum Brain Mapp. 2008;30:1580–1591. doi: 10.1002/hbm.20625. [DOI] [PMC free article] [PubMed] [Google Scholar]
- Bhattacharyya PK, Lowe MJ. Cardiac-induced physiologic noise in tissue is a direct observation of cardiac-induced fluctuations. Magn Reson Imaging. 2004;22:9–13. doi: 10.1016/j.mri.2003.08.003. [DOI] [PubMed] [Google Scholar]
- Birn RM, Diamond JB, Smith MA, Bandettini PA. Separating respiratory-variation-related fluctuations from neuronal-activity-related fluctuations in fMRI. Neuroimage. 2006;31:1536–1548. doi: 10.1016/j.neuroimage.2006.02.048. [DOI] [PubMed] [Google Scholar]
- Biswal B, Yetkin FZ, Haughton VM, Hyde JS. Functional connectivity in the motor cortex of resting human brain using echo-planar MRI. Magn Reson Med. 1995;34:537–541. doi: 10.1002/mrm.1910340409. [DOI] [PubMed] [Google Scholar]
- Blumenfeld H, McNally KA, Vanderhill SD, Paige AL, Chung R, Davis K, Norden AD, Stokking R, Studholme C, Novotny EJ, Jr, Zubal IG, Spencer SS. Positive and negative network correlations in temporal lobe epilepsy. Cereb Cortex. 2004;14:892–902. doi: 10.1093/cercor/bhh048. [DOI] [PubMed] [Google Scholar]
- Bouilleret V, Dupont S, Spelle L, Baulac M, Samson Y, Semah F. Insular cortex involvement in mesiotemporal lobe epilepsy: a positron emission tomography study. Ann Neurol. 2002;51:202–208. doi: 10.1002/ana.10087. [DOI] [PubMed] [Google Scholar]
- Buckner RL, Andrews-Hanna JR, Schacter DL. The brain’s default network: anatomy, function, and relevance to disease. Ann N Y Acad Sci. 2008;1124:1–38. doi: 10.1196/annals.1440.011. [DOI] [PubMed] [Google Scholar]
- Chang C, Glover GH. Effects of model-based physiological noise correction on default mode network anti-correlations and correlations. Neuroimage. 2009;47:1448–1459. doi: 10.1016/j.neuroimage.2009.05.012. [DOI] [PMC free article] [PubMed] [Google Scholar]
- Chassoux F, Semah F, Bouilleret V, Landre E, Devaux B, Turak B, Nataf F, Roux FX. Metabolic changes and electro-clinical patterns in mesio-temporal lobe epilepsy: a correlative study. Brain. 2004;127:164–174. doi: 10.1093/brain/awh014. [DOI] [PubMed] [Google Scholar]
- Di Bonaventura C, Vaudano AE, Carni M, Pantano P, Nucciarelli V, Garreffa G, Maraviglia B, Prencipe M, Bozzao L, Manfredi M, Giallonardo AT. EEG/fMRI study of ictal and interictal epileptic activity: Methodological issues and future perspectives in clinical practice. Blackwell Publishing; 2006. pp. 52–58. [DOI] [PubMed] [Google Scholar]
- Dupont P, Zaknun JJ, Maes A, Tepmongkol S, Vasquez S, Bal CS, Van Paesschen W, Carpintiero S, Locharernkul C, Dondi M. Dynamic perfusion patterns in temporal lobe epilepsy. Eur J Nucl Med Mol I. 2009;36:823–830. doi: 10.1007/s00259-008-1040-6. [DOI] [PubMed] [Google Scholar]
- Englot DJ, Mishra AM, Mansuripur PK, Herman P, Hyder F, Blumenfeld H. Remote effects of focal hippocampal seizures on the rat neocortex. J Neurosci. 2008;28:9066–9081. doi: 10.1523/JNEUROSCI.2014-08.2008. [DOI] [PMC free article] [PubMed] [Google Scholar]
- Flanagan D, Abbott DF, Jackson GD. How wrong can we be? The effect of inaccurate mark-up of EEG/fMRI studies in epilepsy. Clin Neurophysiol. 2009;120:1637–1647. doi: 10.1016/j.clinph.2009.04.025. [DOI] [PubMed] [Google Scholar]
- Fox MD, Zhang DY, Snyder AZ, Raichle ME. The Global Signal and Observed Anticorrelated Resting State Brain Networks. J Neurophysiol. 2009;101:3270–3283. doi: 10.1152/jn.90777.2008. [DOI] [PMC free article] [PubMed] [Google Scholar]
- Frings L, Schulze-Bonhage A, Spreer J, Wagner K. Reduced interhemispheric hippocampal BOLD signal coupling related to early epilepsy onset. Seizure. 2008;18:153–157. doi: 10.1016/j.seizure.2008.06.015. [DOI] [PubMed] [Google Scholar]
- Giovacchini G, Bonwetsch R, Herscovitch P, Carson RE, Theodore WH. Cerebral blood flow in temporal lobe epilepsy: a partial volume correction study. European journal of nuclear medicine and molecular imaging. 2007;34:2066–2072. doi: 10.1007/s00259-007-0499-x. [DOI] [PubMed] [Google Scholar]
- Gotman J, Grova C, Bagshaw A, Kobayashi E, Aghakhani Y, Dubeau F. Generalized epileptic discharges show thalamocortical activation and suspension of the default state of the brain. Proc Natl Acad Sci U S A. 2005;102:15236–15240. doi: 10.1073/pnas.0504935102. [DOI] [PMC free article] [PubMed] [Google Scholar]
- Gotman J, Kobayashi E, Bagshaw AP, Benar CG, Dubeau F. Combining EEG and fMRI: a multimodal tool for epilepsy research. J Magn Reson Imaging. 2006;23:906–920. doi: 10.1002/jmri.20577. [DOI] [PubMed] [Google Scholar]
- Guye M, Regis J, Tamura M, Wendling F, McGonigal A, Chauvel P, Bartolomei F. The role of corticothalamic coupling in human temporal lobe epilepsy. Brain. 2006;129:1917–1928. doi: 10.1093/brain/awl151. [DOI] [PubMed] [Google Scholar]
- Hamandi K, Salek Haddadi A, Liston A, Laufs H, Fish DR, Lemieux L. fMRI temporal clustering analysis in patients with frequent interictal epileptiform discharges: comparison with EEG-driven analysis. Neuroimage. 2005;26:309–316. doi: 10.1016/j.neuroimage.2005.01.052. [DOI] [PubMed] [Google Scholar]
- Hetherington HP, Kuzniecky RI, Vives K, Devinsky O, Pacia S, Luciano D, Vasquez B, Haut S, Spencer DD, Pan JW. A subcortical network of dysfunction in TLE measured by magnetic resonance spectroscopy. Neurology. 2007;69:2256–2265. doi: 10.1212/01.wnl.0000286945.21270.6d. [DOI] [PubMed] [Google Scholar]
- Isnard J, Guenot M, Ostrowsky K, Sindou M, Mauguiere F. The role of the insular cortex in temporal lobe epilepsy. Ann Neurol. 2000;48:614–623. [PubMed] [Google Scholar]
- Jacobs J, Levan P, Moeller F, Boor R, Stephani U, Gotman J, Siniatchkin M. Hemodynamic changes preceding the interictal EEG spike in patients with focal epilepsy investigated using simultaneous EEG-fMRI. Neuroimage. 2009;45:1220–1231. doi: 10.1016/j.neuroimage.2009.01.014. [DOI] [PubMed] [Google Scholar]
- Kahn I, Andrews-Hanna JR, Vincent JL, Snyder AZ, Buckner RL. Distinct cortical anatomy linked to subregions of the medial temporal lobe revealed by intrinsic functional connectivity. J Neurophysiol. 2008;100:129–139. doi: 10.1152/jn.00077.2008. [DOI] [PMC free article] [PubMed] [Google Scholar]
- Kim BJ, Hong SB, Seo DW. Differences in ictal hyperperfusion of limbic-related structures between mesial temporal and neocortical epilepsy. Epilepsy Res. 2008;81:167–175. doi: 10.1016/j.eplepsyres.2008.05.010. [DOI] [PubMed] [Google Scholar]
- Kobayashi E, Bagshaw AP, Benar CG, Aghakhani Y, Andermann F, Dubeau F, Gotman J. Temporal and extratemporal BOLD responses to temporal lobe interictal spikes. Epilepsia. 2006a;47:343–354. doi: 10.1111/j.1528-1167.2006.00427.x. [DOI] [PubMed] [Google Scholar]
- Kobayashi E, Bagshaw AP, Grova C, Dubeau F, Gotman J. Negative BOLD responses to epileptic spikes. Hum Brain Mapp. 2006b;27:488–497. doi: 10.1002/hbm.20193. [DOI] [PMC free article] [PubMed] [Google Scholar]
- Kobayashi Y, Amaral DG. Macaque monkey retrosplenial cortex: II. Cortical afferents. J Comp Neurol. 2003;466:48–79. doi: 10.1002/cne.10883. [DOI] [PubMed] [Google Scholar]
- Labate A, Briellmann RS, Abbott DF, Waites AB, Jackson GD. Typical childhood absence seizures are associated with thalamic activation. Epileptic Disord. 2005;7:373–377. [PubMed] [Google Scholar]
- Laufs H, Hamandi K, Salek-Haddadi A, Kleinschmidt AK, Duncan JS, Lemieux L. Temporal lobe interictal epileptic discharges affect cerebral activity in “Default mode” brain regions. Human Brain Mapping. 2007;28:1023–1032. doi: 10.1002/hbm.20323. [DOI] [PMC free article] [PubMed] [Google Scholar]
- Lin JJ, Salamon N, Lee AD, Dutton RA, Geaga JA, Hayashi KM, Luders E, Toga AW, Engel J, Jr, Thompson PM. Reduced neocortical thickness and complexity mapped in mesial temporal lobe epilepsy with hippocampal sclerosis. Cereb Cortex. 2007;17:2007–2018. doi: 10.1093/cercor/bhl109. [DOI] [PubMed] [Google Scholar]
- Liu Y, Gao JH, Liu HL, Fox PT. The temporal response of the brain after eating revealed by functional MRI. Nature. 2000;405:1058–1062. doi: 10.1038/35016590. [DOI] [PubMed] [Google Scholar]
- McMillan AB, Hermann BP, Johnson SC, Hansen RR, Seidenberg M, Meyerand ME. Voxel-based morphometry of unilateral temporal lobe epilepsy reveals abnormalities in cerebral white matter. Neuroimage. 2004;23:167–174. doi: 10.1016/j.neuroimage.2004.05.002. [DOI] [PubMed] [Google Scholar]
- Morgan VL, Gore JC. Detection of irregular, transient fMRI activity in normal controls using 2dTCA: Comparison to event-related analysis using known timing. Hum Brain Mapp. 2009 doi: 10.1002/hbm.20760. [DOI] [PMC free article] [PubMed] [Google Scholar]
- Morgan VL, Gore JC, Abou-Khalil B. Cluster analysis detection of functional MRI activity in temporal lobe epilepsy. Epilepsy Research. 2007;76:22–33. doi: 10.1016/j.eplepsyres.2007.06.008. [DOI] [PMC free article] [PubMed] [Google Scholar]
- Morgan VL, Gore JC, Szaflarski JP. Temporal clustering analysis: What does it tell us about the resting state of the brain? Med Sci Monit. 2008a;14:CR345–352. [PMC free article] [PubMed] [Google Scholar]
- Morgan VL, Li Y, Abou-Khalil B, Gore JC. Development of 2dTCA for the detection of irregular, transient BOLD activity. Hum Brain Mapp. 2008b;29:57–69. doi: 10.1002/hbm.20362. [DOI] [PMC free article] [PubMed] [Google Scholar]
- Morgan VL, Price RR, Arain A, Modur P, Abou-Khalil B. Resting functional MRI with temporal clustering analysis for localization of epileptic activity without EEG. Neuroimage. 2004;21:473–481. doi: 10.1016/j.neuroimage.2003.08.031. [DOI] [PubMed] [Google Scholar]
- Murphy K, Birn RM, Handwerker DA, Jones TB, Bandettini PA. The impact of global signal regression on resting state correlations: Are anti-correlated networks introduced? Neuroimage. 2008 doi: 10.1016/j.neuroimage.2008.09.036. [DOI] [PMC free article] [PubMed] [Google Scholar]
- Norden AD, Blumenfeld H. The role of subcortical structures in human epilepsy. Epilepsy Behav. 2002;3:219–231. doi: 10.1016/s1525-5050(02)00029-x. [DOI] [PubMed] [Google Scholar]
- Raichle ME, MacLeod AM, Snyder AZ, Powers WJ, Gusnard DA, Shulman GL. A default mode of brain function. Proc Natl Acad Sci U S A. 2001;98:676–682. doi: 10.1073/pnas.98.2.676. [DOI] [PMC free article] [PubMed] [Google Scholar]
- Rombouts SA, Stam CJ, Kuijer JP, Scheltens P, Barkhof F. Identifying confounds to increase specificity during a “no task condition”. Evidence for hippocampal connectivity using fMRI. Neuroimage. 2003;20:1236–1245. doi: 10.1016/S1053-8119(03)00386-0. [DOI] [PubMed] [Google Scholar]
- Rosenberg DS, Mauguiere F, Demarquay G, Ryvlin P, Isnard J, Fischer C, Guenot M, Magnin M. Involvement of medial pulvinar thalamic nucleus in human temporal lobe seizures. Epilepsia. 2006;47:98–107. doi: 10.1111/j.1528-1167.2006.00375.x. [DOI] [PubMed] [Google Scholar]
- Salek-Haddadi A, Diehl B, Hamandi K, Merschhemke M, Liston A, Friston K, Duncan JS, Fish DR, Lemieux L. Hemodynamic correlates of epileptiform discharges: an EEG-fMRI study of 63 patients with focal epilepsy. Brain Res. 2006;1088:148–166. doi: 10.1016/j.brainres.2006.02.098. [DOI] [PubMed] [Google Scholar]
- Salek-Haddadi A, Lemieux L, Merschhemke M, Friston KJ, Duncan JS, Fish DR. Functional magnetic resonance imaging of human absence seizures. Ann Neurol. 2003;53:663–667. doi: 10.1002/ana.10586. [DOI] [PubMed] [Google Scholar]
- Tae WS, Joo EY, Kim JH, Han SJ, Suh YL, Kim BT, Hong SC, Hong SB. Cerebral perfusion changes in mesial temporal lobe epilepsy: SPM analysis of ictal and interictal SPECT. Neuroimage. 2005;24:101–110. doi: 10.1016/j.neuroimage.2004.08.005. [DOI] [PubMed] [Google Scholar]
- Tao JX, Ray A, Hawes-Ebersole S, Ebersole JS. Intracranial EEG substrates of scalp EEG interictal spikes. Epilepsia. 2005;46:669–676. doi: 10.1111/j.1528-1167.2005.11404.x. [DOI] [PubMed] [Google Scholar]
- Wagner K, Frings L, Halsband U, Everts R, Buller A, Spreer J, Zentner J, Schulze-Bonhage A. Hippocampal functional connectivity reflects verbal episodic memory network integrity. Neuroreport. 2007;18:1719–1723. doi: 10.1097/WNR.0b013e3282f0d3c5. [DOI] [PubMed] [Google Scholar]
- Waites AB, Briellmann RS, Saling MM, Abbott DF, Jackson GD. Functional connectivity networks are disrupted in left temporal lobe epilepsy. Ann Neurol. 2006;59:335–343. doi: 10.1002/ana.20733. [DOI] [PubMed] [Google Scholar]
- Weissenbacher A, Kasess C, Gerstl F, Lanzenberger R, Moser E, Windischberger C. Correlations and anticorrelations in resting-state functional connectivity MRI: A quantitative comparison of preprocessing strategies. Neuroimage. 2009;47:1408–1416. doi: 10.1016/j.neuroimage.2009.05.005. [DOI] [PubMed] [Google Scholar]