

Abstract
Cerebral cortical slow-wave activity (SWA) is prominent during sleep and also during ketamine-induced anesthesia. SWA in EEG recordings is closely linked to prominent fluctuations between up- and down-states in the membrane potential of pyramidal neurons. However, little is known about how the cerebellum is linked into SWA and whether slow oscillations influence sensory cerebellar responses. To examine these issues, we simultaneously recorded EEG from the cerebral cortex (SI, MI, and SMA), local field potentials at the input stage of cerebellar processing in the cerebellar granule cell layer (GCL) and inferior olive (IO), and single unit activity at the output stage of the cerebellum in the deep cerebellar nuclei (DCN). We found that in ketamine-anesthetized rats, SWA was synchronized between all recorded cortical areas and was phase locked with local field potentials of the GCL, IO, and single unit activity in the DCN. We found that cortical up-states are linked to activation of GCL neurons but to inhibition of cerebellar output from the DCN, with the latter an effect likely mediated by Purkinje cells. A partial coherence analysis showed further that a large portion of SWA shared between GCL and DCN was transmitted from the cortex, since the coherence shared between GCL and DCN was diminished when the effect of cortical activity was subtracted. To determine the causal flow of information between structures, a directed transfer function was calculated between the simultaneous activities of SI, MI, SMA, GCL and DCN. This analysis showed that the primary direction of information flow was from cortex to the cerebellum, and that SI had a stronger influence than other cortical areas on DCN activity. The strong functional connectivity with SI in particular is in agreement with previous findings of a strong cortical component in cerebellar sensory responses.
Keywords: Rat, Deep Cerebellar Nuclei, Cerebral Cortex, Single Unit Activity, Local Field Potential, Directed Transfer Function
Coherence between the cerebellar and cerebral SI cortices has been demonstrated in awake animals at frequencies of 10-25 Hz during both motor expectancy in primates (Courtemanche and Lamarre, 2005) and active whisking in rats (O'Connor et al., 2002). Coherence in this frequency band has also been observed between DCN unit activity and MI cortex during a grip task in primates (Soteropoulos and Baker, 2006). These data point to a close functional link between cerebral cortical and cerebellar processing and to the presence of distinct behaviorally-dependent modes of synchronization. A specific mode of global synchronization that has been studied extensively in cortex, thalamus, and basal ganglia circuits consists of 0.5-4 Hz slow-wave activity (SWA), and is present in slow wave sleep in rats (Endo et al., 1997, Simasko and Mukherjee, 2009) but also prominent under ketamine/xylazine anesthesia (Steriade et al., 1993a, Magill et al., 2000, Goldberg et al., 2003). Much of the detailed work on somatosensory processing in cerebellar cortex (Bower and Woolston, 1983, Bower and Kassel, 1990) and the DCN (Rowland and Jaeger, 2005) has been performed in ketamine/xylazine anesthetized rodents. Even in the anesthetic state, significant cortical contributions to tactile sensory responses has been discovered both in cerebellar cortex (Morissette and Bower, 1996) and the DCN (Rowland and Jaeger, 2008). Due to the ongoing thalamo-cortical SWA in this condition it becomes an important question whether cerebellar activity is tied into this rhythm and whether cerebellar sensory responses are gated by it. In cortex sensory responses can be modulated depending on the phase of SWA oscillations, and may actually be increased during cortical down-states (Petersen et al., 2003, Sachdev et al., 2004). On the other hand, global SWA may generally depress thalamo-cortical sensory processing (Steriade, 2000). To better understand sensory responses in the cerebellum, we wanted to address the question of whether cortical SWA can also entrain cerebellar structures, and whether cerebellar sensory responses are conditioned by SWA in any way. Although DCN neurons have been shown to burst rhythmically in animals anesthetized with ketamine (Rowland and Jaeger, 2005), the question of whether this activity represents entrainment of the cerebellum by cortical SWA has not been addressed. An additional question is whether the inferior olive (IO) is tied into the SWA rhythm, as it has been shown to be strongly linked to cerebellar sensory responses and cortical activity (Brown and Bower, 2002, Llinas et al., 2002, Rowland and Jaeger, 2008).
We have approached these questions through simultaneous DCN single unit recordings with cortical EEG recordings tracking SWA, and local field potential (LFP) recordings in the cerebellar granule cell layer (GCL) and the IO. We performed cross-correlation, coherence and partial coherence analyses to determine functional interactions between these structures during ketamine anesthesia. We also applied a multivariate auto-regressive (MVAR) model fit to these time series data in order to generate a plausible model for the direction of causality between these structures, known as the directed transfer function (DTF). Based on our finding that strong coupling at the SWA frequency exists between all recorded structures, we examine the hypothesis that sensory responsive vs. non-responsive DCN neurons may be embedded differently in this network.
Experimental Procedures
All procedures were approved by the Institutional Animal Care and Use Committee of Emory University and were in accordance with National Institutes of Health guidelines.
Surgery
Twenty-three male Sprague-Dawley rats (Charles River Laboratories, Inc., Wilmington, MA) (mean weight = 405.6 ± 77.8 g; mean age = 69 ± 18.5 days) were anesthetized with a loading dose of ketamine (125 mg/kg), xylazine (6.5 mg/kg) and acepromazine (1.25 mg/kg). A continuous supplemental dose of this mixture was infused intraperitoneally (ip) at a low rate throughout the experiment to suppress the foot withdrawal reflex. The heart rate was monitored, and a heated pad was used to maintain body temperature at 36°C. The animals respired naturally.
Animals were secured in a head-centered stereotactic frame. After incising the scalp, small holes for placing EEG leads were drilled into the calvarium. The cerebellum was also exposed. An acrylic dam was fashioned around the surgical site and sealed by gluing the animal's skin to the acrylic wall. Warm mineral oil was poured into the dam to preserve tissue integrity during the experiment.
Sensory stimulation
A detailed description of the air-puff stimulation methods used in the present study has been provided in previous publications (Rowland and Jaeger, 2005, Rowland and Jaeger, 2008). Briefly, a picospritzer was used to direct 5 ms pulses of compressed air via a glass pipette to small regions of the upper lip. These air-puffs resulted in a brief pressure pulse to a small stimulated area similar to a touch with a tactile stimulator.
Recording
Cerebral Cortex
Electroencephalographic (EEG) recordings were obtained from the cerebral cortex using stainless steel bone screws (diameter 1.17 mm) affixed over specific regions of the cerebrum as electrodes. These screws were cold soldered to wire leads with silver epoxy (#3021, von Roll ISOLA USA, Inc., New Haven, CT, USA). Electrode placements were atlas-based in all animals. Recordings were made from the primary somatosensory cortex (SI), primary motor cortex (MI), and supplementary motor area (SMA). The delineations of the rat cerebral cortical areas outlined in Zilles (1985) were closely followed for placing the various EEG leads. These were: SI (1 mm posterior and 5 mm lateral to bregma), MI (3 mm anterior and 3 mm lateral to bregma), and SMA (5 mm anterior and 2 mm lateral to bregma). In accordance with Zilles's nomenclature (1985), these cortical areas correspond to parietal area 1 (Par 1), frontal area 1 (Fr1), and frontal area 2 (Fr2), respectively (see also Zilles, 1990).
Note that all unspecified references to ‘cortex’ will refer hereafter to the cerebral cortex and not cerebellar cortex.
Cerebellar Granule Cell Layer
Local field potential (LFP) recordings were obtained in the cerebellar granule cell layer (GCL) with a 5 MΩ epoxy-insulated tungsten wire microelectrode (#575300, A-M Systems, Inc., Carlsborg, WA, USA). The electrode was positioned 500 μm vertically below the pial surface of folium crus IIa, 3.5 mm laterally from the midline of the vermis and in the middle of the folium rostro-caudally. To verify our recording site, in one experiment, we placed a small extracellular deposit of Chicago Sky Blue (see method described in next section) at the coordinates described above. Post-mortem histological processing of this specimen revealed the marker precisely within the GCL of the central region of folium crus IIa. For controls, a limited number of recordings from the GCL were also made from the vermis (1 mm and 2 mm laterally from the midline) at the same rostro-caudal level and depth as recordings in crus IIa (data not shown).
Deep Cerebellar Nuclei
Single units in the deep cerebellar nuclei (DCN) were recorded with glass micropipettes (#TW120F-3, World Precision Instruments, Inc., Sarasota, FL, USA) filled with 2% Chicago Sky Blue in 0.5 M sodium acetate. The glass electrodes were pulled from 1.2 mm OD capillaries with filament to a tip diameter of 5-10 μm (mean impedance = 5 MΩ). Recordings were performed in all regions of the medial, interposed and lateral nuclei. In some experiments, 5 μA of continuous current with the electrode as positive were used to emit the electrode solution containing Chicago Sky Blue from the tip of the electrode at the end of recording. This typically produced a local accumulation of the blue-colored solution subjacent to the electrode tip measuring 50 – 150 μm in diameter that remained stable throughout histological processing of the tissue and allowed for post-mortem histological reconstruction of selected recording sites.
Inferior Olive
Glass electrodes prepared as described above for DCN neurons were used to obtain LFP recordings in the IO. The rostral dorsal accessory olive was targeted 3-4 mm below the surface of the brainstem using an angled approach. The electrode was positioned 0.5 mm lateral to the vermal midline and 0.5 – 1 mm caudal to the vermal uvula. The recording site in IO was marked with Chicago Sky Blue as described above and only experiments for which the resulting blue dot was found to lie within the IO (see Supp. Fig. 3A for an example) were used for further analysis.
Data Acquisition
Spontaneous activity was recorded simultaneously from the cerebral cortex, GCL and DCN for 10 trials of 10 seconds each or alternatively for 1 trial lasting 100 seconds. Recordings incorporated one, two or all cortical areas. Additional experiments included simultaneous recordings of cerebral cortex, IO and DCN using these same parameters. Raw data containing obvious significant artifacts, as seen by visual examination of the traces, were excluded from final analyses. EEG signals from the cerebral cortex and LFP signals from GCL and IO were amplified 1,000× and filtered online between 0.1 and 500 Hz using a differential AC amplifier (#1700, A-M Systems, Inc., Carlsborg, WA, USA). DCN recordings were amplified 10,000× and filtered online between 300 Hz and 5 kHz. All signals were sampled at 10 kHz. Data acquisition was performed using a custom-built software interface in the LabView platform. Silver wires chlorided by immersion in commercial bleach were used as reference electrodes for all recordings. The chlorided end of grounding wires was implanted under the skin behind the skull. At this location no EEG signal is present to contaminate the recording, though a small neck EMG and heart rate artifacts could be picked up at this site.
Histology
At the end of each experiment, animals were given a lethal dose of Pentobarbital (125 mg/kg) ip and perfused transcardially with 0.01 M KPBS followed by 15% sucrose in 10% phosphate buffered formalin. The brain was removed and placed in the latter solution for 24 hours and subsequently into a 30% sucrose in 10% phosphate buffered formalin solution for an additional 24 hours. After thorough fixation, the cerebellum was sectioned in 50 μm slices and counterstained with cresyl violet to enhance the boundaries of the inferior olive and deep cerebellar nuclei. In 29 out of 58 DCN recordings, the locations of the blue dots within the nuclei were used to confirm neuronal recording tracks documented during the experiment (Rowland and Jaeger, 2005, Rowland and Jaeger, 2008).
Data Analysis
Burst Detection
DCN neurons have been observed to be more ‘bursty’ in the presence of ketamine (Rowland and Jaeger, 2005) than in the presence of other anesthetic agents such as urethane. We quantified the burstiness of individual DCN neurons with a burst detection algorithm (Legéndy and Salcman, 1985, Goldberg et al., 2003). This method identifies individual spikes representing the start time or end time of a burst of spikes by maximizing the value of the Poisson Surprise, denoted S, which is the negative of the logarithm of the probability of the occurrence of a particular burst of spikes under the assumption of a Poisson process.
Correlation analyses
For the computation of auto- and crosscorrelograms, DCN neuron spikes were convolved with a Gaussian kernel (sigma = 5 ms). The Gaussians of all spikes were summed, which results in an analog trace representing a slightly smoothed instantaneous spike rate (Paulin, 1996, Rowland and Jaeger, 2005, Rowland and Jaeger, 2008). Correlograms involving DCN spiking were then computed in the analog domain between this trace and field potential traces using inbuilt Matlab functions, as were correlograms only involving field potential traces. In order to estimate the 99% confidence intervals (CIs) for the correlograms, we time-reversed one of the signals (for autorcorrelograms it is the same signal) and recalculated the estimate. This procedure maintains the overall autocorrelation structures of the two signals but destroys their temporal relationship thereby generating the expected correlation given the null hypothesis of no correlation. The CIs were 2.5 standard deviations of the resulting correlograms with the inverted signal (Goldberg et al., 2003).
Power Spectrum
In each recording, data from all signals were digitally refiltered offline between 1 and 400 Hz. Power spectra for filtered signals were estimated by Thompson's multitaper method using 7 Slepian sequences with a large degree of overlap (∼90%) between consecutive time bins (Percival and Walden, 1993).
Coherency, Coherence and Partial Coherence
Coherency is a frequency domain measure of the linear relation between two signals. Specifically, the coherency between two signals, which is a complex number confined to the unit circle, is defined as the cross-spectrum between two signals normalized by the square root of the product of the auto-spectra of the two signals (Halliday et al., 1995). Therefore, the coherence between two signals, which is the square of the absolute value of the coherency, will be high when the two signals share the same frequency band and maintain a relative constant phase relationship between them and low where they do not. The value of coherence is between 0 and 1. The partial coherence between two signals given a third one is the residual coherence that remains between the two signals after subtracting the linear dependence of each of the two signals on a third signal (Halliday et al., 1995). The auto- and cross-spectra used to determine coherence and partial coherence were calculated using Welch's method (Percival and Walden, 1993). To transform DCN neuron spike trains into a continuous time series for coherence analysis, individual spikes were represented as Kronecker delta functions divided by the sampling rate (Perkel et al., 1967).
Directed Transfer functions (DTF)
Estimation of coherence and partial coherence cannot reveal causal relationships between the signals recorded in the brain. In an attempt to discover a plausible set of causal relationships between the various simultaneously recorded signals that is consistent with the correlations measured between the signals, we implemented the directed transfer function, or DTF, method (Kaminski et al., 2001). This analysis fits a multivariate autoregressive (MVAR) model to the simultaneously recorded time series. In the case of univariate time series one uses an autoregressive model (e.g., comprised of a sequence of real scalars) to generate the transfer function of the model, which is a function of frequency. The DTF is a generalization of this method to an MVAR process. In this case the scalar coefficients of the autoregressive model are generalized to k-by-k real matrices, where k is the number of variates in the time series. The DTF is a k-by-k matrix in which each component of the matrix is a function of frequency. In general the function in the i,j component is unequal to the function in the j,i component. This gives rise to an interpretation of directionality or causality in the process: if the function in the j,i component is larger in some sense than the function in the i,j component then the ith signal is said to “cause” the jth signal. This definition is related to and generalizes the notion of Granger causality in a bivariate time series (Kaminski et al., 2001). It is important to note that by fitting a DTF to the data, we are only generating a plausible set of causal relationships among the signals, which by no means reveals the true causal relationships. This caveat is exacerbated by the fact that the model is fit only to the observed data, while many more unobserved signals exist in the brain, which would generally change the predicted causal links between the observed signals, were they included (Kaminski et al., 2001). Nevertheless, when the MVAR and DTF analysis consistently finds across animals a set of causal relations among the recorded signals, it raises the likelihood that the functional connectivity in the signal reflects the derived set of causal relationships. We estimated the MVAR models, and their appropriate orders, using Neumaier and Schneider's ARFIT module (Neumaier and Schneider, 2001, Schneider and Neumaier, 2001). The mean was removed from each channel and was normalized by its standard deviation so that all signals had the same variance and were unitless. This normalization was necessary so that the comparison of the amplitude of the components of the DTF matrix would be meaningful across samples and between different components of the matrix (aside, of course, from comparing the i,j to the j,i components). The DTF was calculated from the MVAR matrices as described in Kaminski et al (2001).
All data analysis was performed in Matlab (The Mathworks, Inc., Natick, MA, USA). Standard parametric and nonparametric tests were used to determine statistically significant differences between groups.
Results
All cortical areas maintain a common oscillatory rhythm in the presence of slow-wave activity
In rats under ketamine anesthesia, a slow rhythm of 1-2.5 Hz predominated in the raw EEG signal in all cortical areas recorded (SMA, MI, SI; Fig. 1A and B). Slow-wave activity (SWA) in these areas were typically persistent, but the amplitude and regularity could wax and wane over episodes of seconds to minutes. Nevertheless, the average autocorrelation of cortical EEGs collected over 100 s trial periods generally indicated robust rhythmicity in the average signal (Fig. 2A top panel). Contreras & Steriade (1995) established that during SWA in animals anesthetized with ketamine and xylazine, surface-positive deflections in the EEG are coincident with cellular depolarization of cortical neurons underneath. Based on these findings, we interpret positive deflections in our EEG electrodes as representative of up-states, or activation, within populations of neurons below the electrode.
Figure 1. Common oscillatory rhythms in the cerebral cortex and cerebellum.

A: Simultaneous EEG signal recordings from the SMA, MI and SI cortical regions in one animal (see METHODS). All regions maintain a 1.5-2.5 Hz oscillation throughout the recording period. Vertical calibration bar (in μV): SMA (25); MI (50); SI (100). B: Inset of shaded area in A. Spindle oscillations are superimposed on the peaks of slower waves (marked by filled circles). Same vertical calibration as in A. C: Simultaneous cortical (SI) EEG, local field potential (LFP) activity in the granule cell layer (GCL) and single unit activity (SUA) in the DCN from same animal as in A and B. The EEG signal oscillates antiphasic to the GCL LFP and DCN signals (see shaded areas). A burst detection algorithm was used to determine burst onset and offset times during DCN spike activity. Black lines mark the detection of bursts based on Poisson Surprise values (see METHODS). Vertical calibration bar (in μV): SI (200); GCL (67); DCN (200). D: Table of mean frequencies of all filtered signals calculated from power spectra peaks.
Figure 2. Phase relationships among cortical and cerebellar rhythms.

A: Autocorrelograms of each signal reveal the oscillatory signature of each structure (data from same single animal as Fig. 1). The correlations were computed from a single 100 s trial of neural activity. Shaded areas represent 99% confidence intervals and were constructed by time reversal of each signal. B: Cross-correlograms of all pairwise signal combinations reveal that the cortical signal is anticorrelated with both the GCL LFP and DCN SUA and that the GCL LFP and DCN SUA are positively correlated. Shaded areas constructed as in A (data from same single animal as Fig. 1). Cross-correlation analyses between GCL multi-unit activity and LFP recordings indicate that negative deflections in the GCL LFP signal represent activation of granule cells (see RESULTS). C: DCN spike times representing only burst onset or burst offset times were used to compute a burst-triggered average for the GCL and cortical signals (data from same single animal as Fig. 1). D: To determine the phase relationship between DCN bursting and SWA accurately, a sine wave was fit to the burst-triggered averages (red traces in panel C) using the Matlab nlinfit function. The phase of the fitted sine wave with respect to the triggering event was used to determine the phase relationship to SWA. The average phase angle between burst onset and cortical SWA was 205 ° for SMA, 230 ° for MI, and 205 ° for SI (Fig. 2D). The burst offset was equally well time-locked to cortical SWA, but at phase angles of -25 °, -11° and 0.7°, respectively(Fig. 2D). Thus, the total duration of bursts was very close to 0.5 of the cortical SWA period. With respect to phase relationship with cortical SWA, the phase GCL LFP phase relationship was DCN bursting was reversed, as would be expected from the antiphasic relationship between cortex and GCL. The n's above each bar indicate the number of acceptable sine wave fits that were present out of the total pool of simultaneous recordings available. The criteria for acceptable fits were a frequency between 1.5 and 2.5 Hz and an average residual error not exceeding 25% of the absolute amplitude of the original average EEG or GCL LFP waveform.
Both GCL local field potentials and DCN single-unit activity were strongly coupled to cortical SWA
In an earlier study (Rowland and Jaeger, 2005), we reported the activity of individual DCN neurons under ketamine anesthesia to be bursty in their spontaneous firing patterns. Given the abundance of projections from the cerebral cortex to the cerebellum (Allen and Tsukahara, 1974), our aim in the present study was to quantify the correlation structure between cerebellar and cerebral cortical activity during SWA under ketamine anesthesia. To this end, we recorded simultaneous activity from the cerebral cortex and the contralateral cerebellar GCL and DCN during spontaneous activity (Fig. 1C) and lip stimulation trials. A particular area of interest in cortex was SI, as this area shows coincident sensory responses to lip stimulation as do DCN neurons (Rowland and Jaeger, 2008).
We found that SWA with the same frequency of 1.5 - 2.5 Hz as in cortex was also present and robust in cerebellar cortical GCL field potential recordings (Fig. 1C, 2A middle panel), though additional activity at higher frequencies was also visible (Fig. 1C), and the autocorrelation (Fig. 2A, middle panel) revealed less rhythmicity than in SI. The relationship between SWA in cortex and GCL in raw data traces appeared to be antiphasic (see shaded areas in Fig. 1C), which was borne out by a cross-correlation analysis revealing that on average positive deflections in cortex were coincident with negative deflections in the GCL (Fig. 2B, top panel). Several studies have shown that granule cell spiking is correlated with negative deflections of the GCL LFP (Morissette and Bower, 1996, Hartmann and Bower, 1998, 2001, Courtemanche et al., 2002). Therefore our results indicate simultaneous periods of spiking in cerebral cortex and the cerebellar GCL.
The burst rhythm of single unit activity in the DCN also appeared to be locked to cortical SWA in raw data traces as DCN bursting occurred predominantly during cortical negative and GCL positive deflections (see shaded areas, Fig. 1C). A robust phase locking of DCN unit activity to the SWA was supported by the strong cross-correlation between DCN spike activity and SWA in cortex and GCL (SMA – 51/54, MI – 27/28, SI – 26/27 and GCL – 55/58 cross-correlations exceeded the 99% confidence interval, nb examples in Fig. 2B, middle and lower panels, 2C). This phase locking of DCN spiking to SWA was more or less evident in different recordings depending on the regularity of GCL oscillations in a particular animal and/or the degree of burstiness in the single unit under study. In almost all cases with significant cross-correlations, DCN unit activity was anticorrelated with EEG deflections in cortex (SMA – 48/51, MI – 18/23, SI – 21/24 and GCL 44/58), whereas cross-correlation peaks between DCN unit activity and GCL LFP were positive (44/58). This finding indicates that DCN units had a higher likelihood of firing during cortical down-states, and were quiescent or firing at much reduced rates during cortical up-states.
A burst detection algorithm (Legéndy and Salcman, 1985) was employed to quantitatively analyze spike bursting patterns in DCN neurons (Fig. 1C, see Methods). Using this algorithm, we calculated a burst-triggered average of cortical EEG and GCL LFP activity for the precise onset and offset of DCN neuron burst times (Fig. 2C). We found a highly precise phase relationship between DCN burst on- and offsets and SWA in cortex and GCL. In fact, the average burst triggered EEG or GCL-LFP can be well fit to a sine wave between 1.5 and 2.5 Hz for a approximately 50% of paired DCN and EEG (or GCL LFP) recordings (see Fig. 2C,D legend for details). In these cases the burst duration was very close to one-half of the SWA rhythm period, and DCN bursting occurred during down-states in cortex and positive LFP deflections in the GCL. On average there was a 40° phase delay between the GCL LFP sine wave fit and the onset of calculated bursts, which is equivalent to 58 ms for a mean SWA frequency of 1.89 Hz (Fig. 1D). However, the calculated bursts often did not include the initial few spikes of visually apparent bursts (Fig. 1C), which is due to the maximization of Poisson surprise as the measure of burst onset in the Legéndy and Salcman (1985) algorithm. This was nonetheless a better algorithm to detect bursting in DCN neurons than identifying first and last spikes in bursts, because complete silencing between bursts was not present in many cases, and bursting had to be judged by significant increases in spike frequency. Therefore, our results in general indicate a significant speedup of DCN spiking that lasts for one half of the SWA period and is coincident with cortical down-states.
Coherence analysis revealed global interactions between multiple cortical areas and DCN firing
We computed the power spectrum of the activity in each signal in order to establish the relative distribution of frequencies present in the cerebral cortex, cerebellar granule cell layer and deep cerebellar nuclei during the SWA state. The high incidence of SWA in the cortex during ketamine anesthesia has been previously described (Steriade et al., 1993b). In agreement with these findings, we found that the most prominent peak in the power spectrum for each signal in our animals was between 1.5 and 2.5 Hz reflecting the SWA frequency band (Fig. 1D and 3A). Additional activity between 4 and 30 Hz was also represented in the power spectrum, though much less pronounced than SWA. In addition, spindle activity was often present (Fig. 1B). In contrast, gamma (30-80 Hz) and fast oscillations (80-200 Hz) were notably absent (Fig. 3A).
Figure 3. Time-resolved coherence analysis of cortico-cerebellar communication.
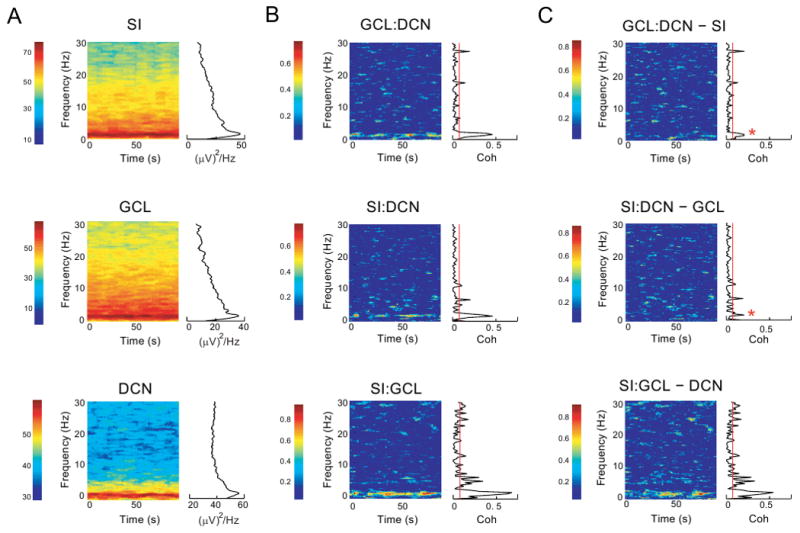
A: Power spectrograms are shown for each signal in a simultaneous 100 s recording trial of SI, GCL and DCN from a single animal (same animal as in Figs. 1 and 2). The spectrograms show their largest peak between 1.5 and 2.5 Hz for all three signals. These slow frequency bands are maintained throughout the entire 100 s recording period for all signals. Gamma (30-80 Hz) and fast oscillations (80-200 Hz) were absent from the power spectra of these signals. These high frequency oscillations are therefore not included in the spectrograms depicted. Colors indicate power in (mV)2/Hz as denoted by the color scale. B: A time-resolved coherogram is calculated from corresponding power spectra shown in A (same animal). The mean GCL:DCN peak coherence when all paired recordings were analyzed (n=28) occurred at 2.09 ± 0.16 Hz, CTX:DCN peak coherence occurred at 1.99 ± 0.1 Hz (n=49), and CTX:GCL peak coherence occurred at 2.18 ± 0.09 Hz (n=50). This coherence was intermittent in time, but frequently observed over episode of tens of seconds. Note that there was no significant persistent coherence present between 4 and 30 Hz despite the presence of these frequencies in the power spectrum. Colors indicate the strength of coherence on a scale from 0 - 1.0). C: Partial coherence analysis between pairs of structures was performed by subtracting the component of coherence predictable from the activity of a third structure. The coherence between GCL:DCN and SI:DCN was significantly reduced by subtracting the component predictable from SI and GCL activity, respectively. In contrast, the SWA signal present in the spike train of a single DCN neuron subtracted little from the SI:GCL coherence in this animal. Color scales as in B. Asterisks in top and middle panels indicate significant reductions in coherence for the entire population of GCL:DCN and CTX:DCN recordings, respectively (see Fig. 4)
Coherence analysis is ultimately better suited to demonstrate interactions between structures than cross-correlation because it is frequency resolved and can also be used to generate a time-frequency decomposition of the signal. The coherence between all pairwise combinations of SI:GCL, SI:DCN, and GCL:DCN in a typical recording displayed a single prominent peak at approximately 2 Hz (Fig. 3B). Despite a limited presence of frequencies between 4-30 Hz in the power spectra, a coherence in this frequency band was generally not observed in contrast to data from awake primates (Courtemanche and Lamarre, 2005)
In our overall sample of recordings we found a very high average coherence of approximately 0.8 between SMA, MI and SI signals at 2Hz (n=9, Fig. 4A,B). There were significant phase differences between cortical areas, however, with SMA leading MI and SI. No significant phase difference existed between MI and SI (Fig. 4C). The coherence between each cortical area and the GCL was about half as strong as cortico-cortical coherence (Fig. 4F) and slightly less between each cortical area and DCN single unit activity (Fig. 4E). The lowest coherence was found between GCL and DCN single unit activity, although it still exceeded an average of 0.2 (Fig. 4D). Next, we wished to determine whether the SWA coherence between different structures was due to a single global underlying oscillation. We tested this using partial coherence analysis, which measures the residual coherence between two signals after removing their linear dependence on a third signal (Magill et al., 2004). The pairwise cortico-cortical coherences were significantly reduced after removing the linear dependence of the third recorded area (Fig. 4A). Nevertheless, the residual coherence was far above zero in all cases. Similarly, when the dependence of cortical areas were subtracted from the GCL:DCN coherence a significant reduction was observed (p < 0.05 for all cortical areas – SMA, MI and SI; cf. in a single animal Fig. 3B, top panel and Fig. 3C top panel; see Fig 4D for population data). We also found a similar significant decrease in partial coherence between cortex and DCN after removing the linear predictor of GCL's influence upon these two structures (p < 0.05 for all cortical areas; cf. Fig. 3B, middle panel and Fig. 3C middle panel; Fig 4E). Taken together these findings seem to suggest a somewhat more complex picture than a single source of SWA, but rather strongly coupled oscillations across different cortical areas that each contribute to coherent activity with the cerebellum. A small reduction in coherence between CTX and GCL was observed after removing the DCN signal (Fig. 4F). This effect is probably due to the reflection of global SWA in DCN single unit spike rate modulation. As coherence analysis cannot reveal which structure drives which in a shared oscillation a different approach is necessary to address this question. The directed transfer function (DTF) analysis described below was employed to help clarify this issue.
Figure 4. Partial coherence analysis reveals cortex and GCL as significant predictors in CTX-GCL-DCN recordings.

For each pairwise combination of signals in a recording, the maximum coherence between the two signals was determined for the frequency range of 0.5 to 4 Hz and compared with the partial coherence calculated by subtracting the cross spectrum of a third simultaneously recorded signal. Recordings in which the maximum coherence in this range did not exceed the upper confidence limit were excluded from analysis. A: The contribution of each cortical area to the network was evaluated using partial coherence analysis. The coherence between each pair of cortical areas was compared after removing the third cortical signal. This resulted in a significant reduction in coherence for all cortical areas (SMA:MI with SI removed, p = 0.004, n = 9, paired t-test; SMA:SI with MI removed, p < 0.001, n = 9, paired t-test; MI:SI with SMA removed, p = 0.004, n = 9, paired t-test) B: The frequency at which the peak coherence was measured between cortical pairs occurred in the 1.5 – 2.5 Hz range (SMA:MI, 2.21 ± 0.28 Hz; SMA:SI, 1.87 ± 0.21 Hz; MI:SI, 1.87 ± 0.21 Hz). These frequencies were not different between cortical pairs (p = 0.550, n = 9, Kruskal-Wallis test) C: There was a significant (p<0.05) phase shift in the oscillation between SMA and SI and SMA and MI at the frequency of peak coherence, but not between MI and SI (SMA:MI, 9.43 ± 2.04 deg; SMA:SI, 17.90 ± 4.48 deg; MI:SI, 6.91 ± 4.03 deg, n = 9). D: Removing the cortical signal significantly reduced the coherence shared between GCL and DCN for all cortical areas (SMA, p < 0.001, n = 25; MI, p = 0.004, n = 12; SI, p = 0.011, n = 11; paired t-test used for all comparisons). E: Similarly, removing the GCL signal significantly reduced the coherence shared between CTX and DCN for all cortical areas (SMA, p < 0.001, n = 26; MI, p = 0.007, n = 12; SI, p = 0.023, n = 11; paired t-test used in all comparisons). F: Removing the DCN signal significantly reduced the coherence shared between GCL and SMA and MI but not SI (SMA, p < 0.001, n = 27; MI, p = 0.034, n = 12; SI, p = 0.105, n = 11; paired t-test used in all comparisons). Standard error bars plotted in panels A-F.
Olivary involvement in global SWA
In four animals, we recorded from SI, IO and a single DCN neuron simultaneously in order to determine the relationship of IO activity to cortico-cerebellar SWA. We found that the IO oscillated in phase with the cortex and DCN in most recordings (Fig. 5A and C). The cross-correlation shown indicated that IO LFPs were negative when cortex was in up-states (Fig. 5B). The coherence between SI and IO was very strong, with a mean value of 0.68 at a peak frequency of 1.87 ± 0.5 Hz (Fig. 5D, top panel, n= 1 animal, and 5E, n = 4 animals). The mean peak coherence between IO and DCN was much lower at 0.26, and the peak frequency of this coherence was higher at 2.93 ± 0.4 Hz (n=3 animals). This may point to the existence of a separate channel of communication between the IO and the cortex and the IO and cerebellum. In fact, in 2 out of 4 recordings, removing the linear prediction of IO activity did not decrease the coherence shared between SI and the DCN (Fig. 5E, n = 4 animals). It should also be noted that LFP recordings in the IO likely reflect population postsynaptic currents with cortical excitation and DCN inhibition superposed. Single unit recordings in the IO in anesthetized rats, on the other hand, support the presence of appreciable slow-wave modulated 10 Hz spiking (Chorev et al., 2007) and marked single spike synchrony through gap-junction coupling (Leznik and Llinas, 2005). Therefore strongly variable and complex SWA coupling between IO and DCN units is not surprising.
Figure 5. IO oscillates in phase with cortex and DCN but did not consistently show influence on SI:DCN coherence.
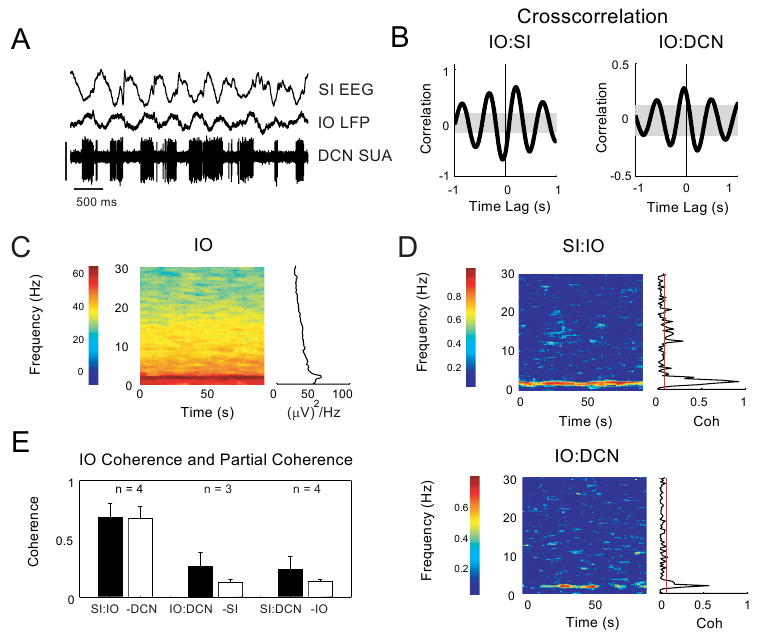
A: Raw data from a single animal showing simultaneous recordings from SI EEG, IO LFP and DCN SUA during SWA. Vertical calibration bar (in μV): SI (1000), IO (500), DCN (1000). B: Cross-correlation plots show that IO is antiphasic to SI and in phase with DCN (data from same animal as in A). C: A spectrogram plot of IO spontaneous activity during slow wave oscillations shows robust SWA and the presence of activity at lower power up to 30 Hz. (data from same animal as in A). D: Coherograms for SI:IO (top panel) and IO:DCN (bottom panel) show a robust peak at SWA frequencies (data from same animal as in A). E. Coherence between all paired signals is compared to the partial coherence when the third signal is removed. For each pair of signals, the maximum coherence was determined for the frequency range of 0.5 to 4 Hz and compared to the partial coherence calculated by removing the third signal. (standard error bars plotted; see RESULTS section).
Relation of sensory responsive and non-responsive DCN neurons to SWA is very similar
In a previous study we found that in all cerebellar nuclei a subpopulation of neurons strongly responded to tactile stimulation of the face and forelimbs (Rowland and Jaeger, 2005). Here we used coherence analysis to determine whether DCN neurons with sensory responses were differentially involved in the cortico-cerebellar SWA. Our data did not support this hypothesis, however, as the peak coherence between cortex and responsive neurons (n = 36) or nonresponsive neurons (n = 13) was very similar (t-test, p > 0.05, Fig 6A and B). We also tested whether the degree of coherence with cortical oscillations could predict parameters of individual response components in responsive neurons but found no such effect (p > 0.05, Fig. 6C). Additionally, the coherence between different cortical areas (SMA, MI, SI) and responsive or non-responsive DCN neurons was very similar (Fig. 7A-C). The coherence between GCL and responsive and non-responsive DCN neurons was also very similar, and was moderately reduced when the linear prediction of any cortical area was subtracted (Fig. 7D-F). These results suggest that neurons unresponsive to lip stimulation do not constitute a separate population of neurons with a different relationship to cortical information flow.
Figure 6. Responsive and nonresponsive neurons show no difference in coherence with cortical slow rhythms.
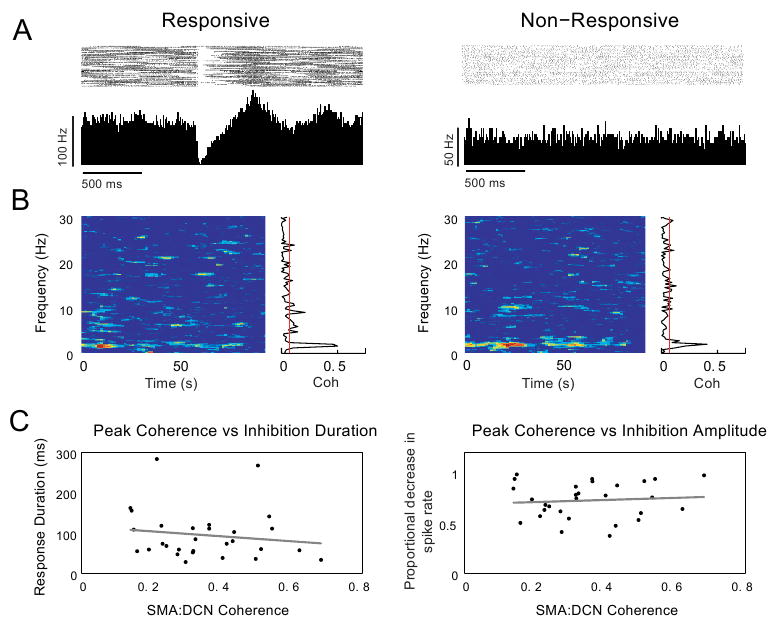
A-B: Coherence with cortical slow rhythms was compared between DCN neurons responsive to air puff stimulation of the lip and those that were non-responsive. In this example, a responsive and non-responsive neuron (peri-stimulus histograms and raster plots during stimulus-evoked activity shown in A) share the same coherence peak and profile (coherence during spontaneous activity of the same respective neurons shown in B; cf. left panels in A and B (responsive neuron) with right panels in A and B (nonresponsive neuron) (n = 1 animal). C: Coherence with cortical slow rhythms also does not predict the duration or amplitude of DCN neuron response components. A linear regression analysis showed no correlation between the response durations or amplitudes of the short-latency excitation (p > 0.05, n = 34), inhibition (p > 0.05, n = 57) or long-latency excitation (p > 0.05, n = 35) components to the peak frequency of coherence in responsive neurons. Scatter plots for inhibition duration and amplitude vs. peak coherences are shown in C.
Figure 7. Cortex significantly influences coherence between the GCL and both responsive and nonresponsive DCN neurons.

A-C: The peak coherence of the different cortical areas with both responsive and nonresponsive neurons was compared. The bar graphs show no difference in the peak coherence between SMA (p = 0.62, t-test), MI (p = 0.63, t-test) or SI (p = 0.60, t-test) and responsive or nonresponsive DCN neurons to air puff stimuli to the face. D-F: A comparison of the change in coherence when the cortical signal is removed from GCL:DCN coherence shows a significant difference in the SMA (resp: p < 0.001, Wilcoxon signed rank test, nonresp: p = 0.001, Wilcoxon signed rank test), MI (resp: p < 0.001, paired t-test, nonresp: p = 0.72, paired t-test), and SI (resp: p = 0.002, paired t-test) cortical areas. Only the SI cortical signal did not significantly influence GCL:DCN coherence with nonresponsive neurons (p = 0.133, paired t-test). Standard error bars plotted in all graphs.
In our previous study detailing DCN responses to air-puff stimuli (Rowland and Jaeger, 2005) we found that responses could be elicited regardless of the level of activity during the last 100 ms preceding the stimulus. However, we did not perform a quantitative analysis of possible changes in response strength in relation to SWA modulation of DCN activity. Given the findings in this study we re-analyzed a population of DCN neurons classified as responsive (n=36) or unresponsive (n = 13) to lip stimulation, which showed some degree of SWA modulation in their baseline activity. Because the rate of DCN firing was modulated by the SWA rhythm we could estimate the SWA phase at the time of sensory stimulation by tracking the time of the preceding maximum in DCN firing rate. Our analysis of spike counts during the short latency excitatory (SLE) or the inhibitory (INH) response periods as a function of SWA phase at time of stimulation did show that each response component was modulated by the relation between stimulus time and SWA phase (Supp. Fig. 2). Specifically a significant increase in spike count was observed during both response periods when the stimulus occurred closer to a preceding rate maximum (Supp. Fig. 2B,C), which we showed to be related to cortical down-states above. Strong sensory responses during cortical down states are not surprising given that somatosensory cortex may show a heightened sensitivity to sensory input during down states (Sachdev et al., 2004). However, we found a weakening of inhibition and a strengthening of excitation with the same phase relationship to SWA. Furthermore, both responsive and unresponsive neurons showed a similar increase in spike count during the response time windows as a function of SWA phase (see Supp. Fig. 2 for details). These results suggest that sensory responses are in fact not strongly modulated by the phase of SWA, but that a change in DCN neuron excitability aligned with SWA phase leads to varying spike counts during the sensory response time window.
DTF analysis suggests cortical driving of the DCN
As discussed above, the partial coherence approach seemed to indicate that the coherence between any two structures recorded was partially explained by the coupling of each of these structures with a third one. Thus, it was hard to identify which structure is truly the driver of the oscillatory activity. In order to better understand the functional connectivity between cortex and cerebellum during SWA, we wished to reveal the causal links or direction of “information flow” between these structures. Strictly speaking, correlation and coherence measurements cannot reveal causality in a network. However, fitting a multivariate autoregressive (MVAR) model to simultaneously recorded data sources from the network can generate a plausible set of causal relationships that is consistent with the data. The outcome of this MVAR analysis gives rise to a directed transfer function (DTF), from which a statistical form of causality between structures in the network, termed Granger causality, can be inferred (Kaminski and Blinowska, 1991, Kaminski et al., 2001). DTF essentially measures how well activity from one structure can linearly predict the activity of a second structure and vice versa. As described in the Methods section, the DTF lends itself to an interpretation concerning the direction of information flow between two structures, and thus can be very helpful in determining the functional connectivity between two or more structures (Sharott et al., 2005). We used a set of 9 separate recording sessions of 5 simultaneously recorded regions including EEEGs from SMA, MI and SI, the LFP from the GC, and a single neuron recording from the DCN. The outcome of this analysis is a 5-by-5 matrix, which can then be used to glean the “direction of information flow” between any pair of recorded structures. This is done by looking at the two entries in this matrix that represent the mutual transfer function between them. Figure 8A depicts the DTF from S1 to DCN and vice versa. In this case the “flow of information” runs predominantly from the former to latter, as is evident from the asymmetry between the values of these mutual DTFs. Moreover, the DTF, that is a function of frequency, demonstrates that the influence of S1 on DCN is mostly in SWA band of frequencies. Because each signal is normalized by its own standard deviation, once can also compare the degree of asymmetry among the various disjoint pairs in the matrix. In order to quantify the degree of asymmetry between any pair of structures, we chose to integrate the DTF over the SWA frequency (0.5 - 4 Hz) band and compare the resulting values. Thus, figure 8B demonstrates that the DCN is influenced by all cortical regions in the SWA band, however it is predominantly influenced by SI. Expanding this analysis to all the 10 disjoint pairs for the 5-by-5 matrix demonstrated further that SI to MI and SMA connections were stronger than the reverse connections (p < 0.05, Suppl. Fig. 1), but that there was no such directionality between MI and SMA. Furthermore, MI and SI showed a similar directionality in their connection to the GCL, which however reached significance (p < 0.05) only between SI and GC (Suppl. Fig. 1). These relations are in overall agreement with the concept that SWA oscillations may be driven through thalamo-cortical oscillators (Steriade, 2000), and that thalamo-cortical oscillations in different areas of cortex converge at the level of cerebellar circuits.
Figure 8. DTF analysis reveals net information flow in cerebrocerebellar network.

Applying a 5-way DTF algorithm (see METHODS) to simultaneous recordings in SMA, MI, SI, GCL and DCN shows significant directionality of all cortical areas, especially SI, toward the DCN. A-B. The area under the DTF curve was calculated for all pairwise combinations of signals recorded in nine animals. In A, the superimposed curves show the calculated DTF functions for SI to DCN and DCN to SI directions in one animal. The peaks of the curves occur in the SWA frequency range. In B, the mean area under the DTF curve was compared between both directions for each pair of signals by subtraction. The difference in areas under the DTF curves was significantly larger for the SI to DCN direction than for SMA to DCN but not MI to DCN (p = 0.027, n = 9, one-way ANOVA with Tukey's post-hoc test, standard error bars plotted). The DTF analysis was restricted to a slow frequency range of 0.5 – 4 Hz.
Discussion
Our results show that in rats anesthetized with ketamine-xylazine a strong entrainment exists between the cerebral cortex, cerebellum, and IO in the form of a predominantly slow 1.5-2.5 Hz rhythm. An analysis of the phase-locking between these structures suggests that the feedforward communication between the cortex and the DCN in this rhythm is dominated by cerebro-ponto-granular activation of Purkinje cells and subsequent inhibition of DCN neurons and not through direct excitation by ponto-nuclear fibers. Different cortical areas (SMA, MI, SI) all showed strong coherence with GCL field potentials and DCN single unit activity in cerebellum, and our DTF analysis supported independent functional input from each cortical area to both GCL and DCN. These findings are in good agreement with other recent studies indicating slow frequency oscillations of Purkinje cells in ketamine anesthetized rats (Loewenstein et al., 2005) that are also correlated with cortical SWA (Ros et al., 2009).
Convergent functional connections between the cortex and DCN mediated by Purkinje cell inhibition
Previous work has shown that ketamine anesthesia can lead to separate functional axes in the coherence between cortical and subcortical structures despite the presence of global SWA (Magill et al., 2004). In particular this study showed that cortical - subthalamic and cortical - pallidal coherence were independent from each other. The network relations we uncovered in the cerebellum through partial coherence and DTF analyses reflect a similar theme in that multiple cortical areas (SMA, MI, SI) all showed partially independent slow-wave interactions with both the input (GCL) and the output (DCN) side of the cerebellum. Interestingly, slow-wave modulation of even single DCN neurons reflected significant influences of each cortical area, suggesting a high degree of cortical convergence. This result lends a new level of explanation to our previous finding that sensory tactile responses in the DCN were present in all three nuclei and that receptive fields are extremely large (Rowland and Jaeger, 2005). The pronounced intermediate-latency inhibitory responses found in our previous study with tactile stimulation are also in agreement with a stronger cerebral cortical connection via Purkinje cell inhibition than via direct mossy fiber excitation as revealed by the observed antiphasic relationship between DCN spike activity and cortical up-states.
Cerebellar activity in sleep and wake states
In their review, Andre and Arrighi (2003) suggested that different sleep states are accompanied by shifts in cerebro-cerebellar communication properties. In waking and paradoxical sleep, which are both characterized by high frequency bands in the EEG, cortico-cerebellar processing is reinforced. In contrast, slow-wave sleep (SWS), in which the EEG profile resembles the ketamine anesthetized state, invokes a reduction in the communication between the DCN and VL thalamus (Steriade et al., 1971a). In at least two studies, oscillation frequencies have been shown to be different in the cerebellum between sleep and waking states (Kaplan, 1981, Pellerin and Lamarre, 1997). When single unit activity was recorded from the deep cerebellar nuclei in unanesthetized, chronically implanted cats during successive sleep-wake cycles, changes in firing rate and burst activity were found during SWS (Steriade et al., 1971a, b, Palmer, 1979). Nevertheless, Armstrong and colleagues found active responses in DCN neurons to cutaneous stimulation in both anesthetized and awake cats (Armstrong et al., 1973, Armstrong and Rawson, 1979). Armstrong's data, along with our own, suggest that while cerebro-cerebellar information flow may be reorganized during SWS, and by extension ketamine anesthesia, the DCN nevertheless retain the capacity to respond to sensory input and to generate precise temporal patterns. Our finding that DCN neurons can response to sensory stimulation during all phases of the SWA rhythm provide similar results to a study of somatosensory cortex, in which can strong sensory responses during down-states associated with ketamine induced SWA were found (Sachdev et al., 2004),
Cerebellar oscillations and sensorimotor integration
Oscillatory activity is dominant in slow-wave sleep and during anesthesia, but it is also readily observed during waking states in many brain structures, including the cerebellum. A 3-5 Hz slow-wave activity correlated between cerebellar and cortical LFPs was found to persist in awake rodents in a recent study (Ros et al., 2009). This study also showed a strong correlation between SWA in the LFP of cerebellar cortex and the LFP of cerebral cortex in ketamine anesthetized rats and reached conclusions very similar to our own. Correlations between cortex and cerebellum in awake rodents are more diverse than during anesthesia, however. Hartman and Bower (Hartmann and Bower, 1998) found that the GCL engages in widely synchronized 7-8 Hz oscillations in waking rats during periods of inactivity. Courtemanche & Lamarre (2005) observed synchronization between the cerebellum and cortex in monkeys trained to perform both passive and active expectancy reward tasks. O'Connor et al (2002) observed synchronization between the cerebellum and neocortex during whisking movements in rats. Soteropoulos & Baker (2006) observed coherent oscillations (10-40 Hz) in the cerebellum and motor cortex during an extended grip task in monkeys. Together, these studies indicate that cerebellar oscillations can be observed in a wide variety of behavioral contexts and occur at different frequencies even in the waking state. Our understanding of the ultimate functional significance of any of these oscillations is incomplete at this time. It is also unclear whether different oscillations set up different functional connectivity patterns, or maybe more likely engage the same set of structures in different modes of processing. Certainly the widespread observation of coherence between cerebral cortex and the cerebellum in different oscillatory modes reveals a strong functional interrelationship between these structures and provides strong evidence that cortex and cerebellum form a functional unit during sensorimotor integration. Our findings in the present study in conjunction with the previously observed time locked extended sensory response patterns in cortex, IO, and DCN (Rowland and Jaeger, 2008) suggest that even sensory processing in the cerebellum in anesthetized animals is highly interdependent with cortical function. Our findings also suggest that an anesthetized state can serve as a valuable substrate for studying sensory processing in connected brain networks, and that in the cerebellum sensory responses were remarkably unaffected by ongoing slow-wave oscillations.
Supplementary Material
Acknowledgments
The authors wish to acknowledge Lauren Job and Svetlana Olypher for technical assistance in this study. We also thank Jeremy Edgerton, Su Li, and Cengiz Gunay for contributing Matlab scripts for of data analysis.
Grants: This work was supported by RO1 NIMH MH065634 and F31 GM020685.
Abbreviations
- DCN
deep cerebellar nuclei
- DTF
directed transfer function
- EEG
electroencephalogram
- GCL
granule cell layer
- IO
inferior olive
- LFP
local field potential
- M1
primary motor cortex
- MVAR
multivariate autoregressive
- SI
primary somatosensory cortex
- SMA
supplementary motor area
- SWA
slow wave activity
Footnotes
Publisher's Disclaimer: This is a PDF file of an unedited manuscript that has been accepted for publication. As a service to our customers we are providing this early version of the manuscript. The manuscript will undergo copyediting, typesetting, and review of the resulting proof before it is published in its final citable form. Please note that during the production process errors may be discovered which could affect the content, and all legal disclaimers that apply to the journal pertain.
References
- Allen GI, Tsukahara N. Cerebrocerebellar communication systems. Physiol Rev. 1974;54:957–1006. doi: 10.1152/physrev.1974.54.4.957. [DOI] [PubMed] [Google Scholar]
- Andre P, Arrighi P. Hipnic modulation of cerebellar information processing: implications for the cerebro-cerebellar dialogue. Cerebellum. 2003;2:84–95. doi: 10.1080/14734220309403. see comment. [DOI] [PubMed] [Google Scholar]
- Armstrong DM, Cogdell B, Harvey RJ. Responses of interpositus neurones to nerve stimulation in chloralose anaesthetized cats. Brain Research. 1973;55:461–466. doi: 10.1016/0006-8993(73)90314-4. [DOI] [PubMed] [Google Scholar]
- Armstrong DM, Rawson JA. Responses of neurones in nucleus interpositus of the cerebellum to cutaneous nerve volleys in the awake cat. J Physiol. 1979;289:403–423. doi: 10.1113/jphysiol.1979.sp012744. [DOI] [PMC free article] [PubMed] [Google Scholar]
- Bower JM, Kassel J. Variability in tactile projection patterns to cerebellar folia crus IIA of the Norway rat. J Comp Neurol. 1990;302:768–778. doi: 10.1002/cne.903020409. [DOI] [PubMed] [Google Scholar]
- Bower JM, Woolston DC. Congruence of spatial organization of tactile projections to granule cell and Purkinje cell layers of cerebellar hemispheres of the albino rat: vertical organization of cerebellar cortex. J Neurophysiol. 1983;49:745–766. doi: 10.1152/jn.1983.49.3.745. [DOI] [PubMed] [Google Scholar]
- Brown IE, Bower JM. The influence of somatosensory cortex on climbing fiber responses in the lateral hemispheres of the rat cerebellum after peripheral tactile stimulation. Journal of Neuroscience. 2002;22:6819–6829. doi: 10.1523/JNEUROSCI.22-15-06819.2002. [DOI] [PMC free article] [PubMed] [Google Scholar]
- Chorev E, Yarom Y, Lampl I. Rhythmic episodes of subthreshold membrane potential oscillations in the rat inferior olive nuclei in vivo. J Neurosci. 2007;27:5043–5052. doi: 10.1523/JNEUROSCI.5187-06.2007. [DOI] [PMC free article] [PubMed] [Google Scholar]
- Contreras D, Steriade M. Cellular basis of EEG slow rhythms: a study of dynamic corticothalamic relationships. Journal of Neuroscience. 1995;15:604–622. doi: 10.1523/JNEUROSCI.15-01-00604.1995. [DOI] [PMC free article] [PubMed] [Google Scholar]
- Courtemanche R, Lamarre Y. Local field potential oscillations in primate cerebellar cortex: synchronization with cerebral cortex during active and passive expectancy. Journal of Neurophysiology. 2005;93:2039–2052. doi: 10.1152/jn.00080.2004. [DOI] [PubMed] [Google Scholar]
- Courtemanche R, Pellerin JP, Lamarre Y. Local field potential oscillations in primate cerebellar cortex: modulation during active and passive expectancy. J Neurophysiol. 2002;88:771–782. doi: 10.1152/jn.2002.88.2.771. [DOI] [PubMed] [Google Scholar]
- Endo T, Schwierin B, Borbely AA, Tobler I. Selective and total sleep deprivation: Effect on the sleep EEG in the rat. Psychiatry Res. 1997;66:97–110. doi: 10.1016/s0165-1781(96)03029-6. [DOI] [PubMed] [Google Scholar]
- Goldberg JA, Kats SS, Jaeger D. Globus pallidus discharge is coincident with striatal activity during global slow wave activity in the rat. Journal of Neuroscience. 2003;23:10058–10063. doi: 10.1523/JNEUROSCI.23-31-10058.2003. [DOI] [PMC free article] [PubMed] [Google Scholar]
- Halliday DM, Rosenberg JR, Amjad AM, Breeze P, Conway BA, Farmer SF. A framework for the analysis of mixed time series/point process data--theory and application to the study of physiological tremor, single motor unit discharges and electromyograms. Progress in Biophysics & Molecular Biology. 1995;64:237–278. doi: 10.1016/s0079-6107(96)00009-0. [DOI] [PubMed] [Google Scholar]
- Hartmann MJ, Bower JM. Oscillatory activity in the cerebellar hemispheres of unrestrained rats. J Neurophysiol. 1998;80:1598–1604. doi: 10.1152/jn.1998.80.3.1598. [DOI] [PubMed] [Google Scholar]
- Hartmann MJ, Bower JM. Tactile responses in the granule cell layer of cerebellar folium crus IIa of freely behaving rats. J Neurosci. 2001;21:3549–3563. doi: 10.1523/JNEUROSCI.21-10-03549.2001. [DOI] [PMC free article] [PubMed] [Google Scholar]
- Kaminski M, Ding M, Truccolo WA, Bressler SL. Evaluating causal relations in neural systems: granger causality, directed transfer function and statistical assessment of significance. Biological Cybernetics. 2001;85:145–157. doi: 10.1007/s004220000235. [DOI] [PubMed] [Google Scholar]
- Kaminski MJ, Blinowska KJ. A new method of the description of the information flow in the brain structures. Biological Cybernetics. 1991;65:203–210. doi: 10.1007/BF00198091. [DOI] [PubMed] [Google Scholar]
- Kaplan BJ. Feline spontaneous cerebellar rhythmic activity: topographical, behavioral and spectral analysis. Physiology & Behavior. 1981;26:1013–1018. doi: 10.1016/0031-9384(81)90202-x. [DOI] [PubMed] [Google Scholar]
- Legéndy CR, Salcman M. Bursts and recurrences of bursts in the spike trains of spontaneously active striate cortex neurons. J Neurophysiol. 1985;53:926–939. doi: 10.1152/jn.1985.53.4.926. [DOI] [PubMed] [Google Scholar]
- Leznik E, Llinas R. Role of gap junctions in synchronized neuronal oscillations in the inferior olive. Journal of Neurophysiology. 2005;94:2447–2456. doi: 10.1152/jn.00353.2005. [DOI] [PubMed] [Google Scholar]
- Llinas R, Leznik E, Makarenko VI. On the amazing olivocerebellar system. Annals of the New York Academy of Sciences. 2002;978:258–272. doi: 10.1111/j.1749-6632.2002.tb07573.x. [DOI] [PubMed] [Google Scholar]
- Loewenstein Y, Mahon S, Chadderton P, Kitamura K, Sompolinsky H, Yarom Y, Hausser MH. Bistability of cerebellar Purkinje cells modulated by sensory stimulation. Nature Neuroscience. 2005;8:202–211. doi: 10.1038/nn1393. [DOI] [PubMed] [Google Scholar]
- Magill PJ, Bolam JP, Bevan MD. Relationship of activity in the subthalamic nucleus-globus pallidus network to cortical electroencephalogram. Journal of Neuroscience. 2000;20:820–833. doi: 10.1523/JNEUROSCI.20-02-00820.2000. [DOI] [PMC free article] [PubMed] [Google Scholar]
- Magill PJ, Sharott A, Bolam JP, Brown P. Brain state-dependency of coherent oscillatory activity in the cerebral cortex and basal ganglia of the rat. Journal of Neurophysiology. 2004;92:2122–2136. doi: 10.1152/jn.00333.2004. [DOI] [PubMed] [Google Scholar]
- Morissette J, Bower JM. Contribution of somatosensory cortex to responses in the rat cerebellar granule cell layer following peripheral tactile stimulation. Experimental Brain Research. 1996;109:240–250. doi: 10.1007/BF00231784. [DOI] [PubMed] [Google Scholar]
- Neumaier A, Schneider T. Estimation of parameters and eigenmodes of multivariate autoregressive models. Acm Transactions on Mathematical Software. 2001;27:27–57. [Google Scholar]
- O'Connor SM, Berg RW, Kleinfeld D. Coherent electrical activity between vibrissa sensory areas of cerebellum and neocortex is enhanced during free whisking. Journal of Neurophysiology. 2002;87:2137–2148. doi: 10.1152/jn.00229.2001. [DOI] [PubMed] [Google Scholar]
- Palmer C. Interpositus and fastigial unit activity during sleep and waking in the cat. Electroencephalogr Clin Neurophysiol. 1979;46:357–370. doi: 10.1016/0013-4694(79)90137-8. [DOI] [PubMed] [Google Scholar]
- Paulin MG. System identification of spiking sensory neurons using realistically constrained nonlinear time series models. In: Gath I, Inbar G, editors. Advances in Processing and Pattern Analysis of Biological Signals. 1996. pp. 183–194. [Google Scholar]
- Pellerin JP, Lamarre Y. Local field potential oscillations in primate cerebellar cortex during voluntary movement. J Neurophysiol. 1997;78:3502–3507. doi: 10.1152/jn.1997.78.6.3502. [DOI] [PubMed] [Google Scholar]
- Percival DB, Walden AT. Spectral Analysis for Physical Applications: Multivariate and Conventional Univariate Techniques. Cambridge University Press; 1993. [Google Scholar]
- Perkel D, Gerstein G, Moore G. Neuronal spike trains and stochastic point processes. II. Simultaneous spike trains. Biophysical Journal. 1967;7:419–440. doi: 10.1016/S0006-3495(67)86597-4. [DOI] [PMC free article] [PubMed] [Google Scholar]
- Petersen CCH, Hahn TTG, Mehta M, Grinvald A, Sakmann B. Interaction of sensory responses with spontaneous depolarization in layer 2/3 barrel cortex. Proceedings of the National Academy of Sciences of the United States of America. 2003;100:13638–13643. doi: 10.1073/pnas.2235811100. [DOI] [PMC free article] [PubMed] [Google Scholar]
- Ros H, Sachdev RNS, Yu Y, Sestan N, McCormick DA. Neocortical Networks Entrain Neuronal Circuits in Cerebellar Cortex. J Neurosci. 2009;29:10309–10320. doi: 10.1523/JNEUROSCI.2327-09.2009. [DOI] [PMC free article] [PubMed] [Google Scholar]
- Rowland NC, Jaeger D. Coding of tactile response properties in the rat deep cerebellar nuclei. Journal of Neurophysiology. 2005;94:1236–1251. doi: 10.1152/jn.00285.2005. [DOI] [PubMed] [Google Scholar]
- Rowland NC, Jaeger D. Responses to Tactile Stimulation in Deep Cerebellar Nucleus Neurons Result From Recurrent Activation in Multiple Pathways. Journal of Neurophysiology. 2008;99:704–717. doi: 10.1152/jn.01100.2007. [DOI] [PubMed] [Google Scholar]
- Sachdev RN, Ebner FF, Wilson CJ. Effect of subthreshold up and down states on the whisker-evoked response in somatosensory cortex. Journal of Neurophysiology. 2004;92:3511–3521. doi: 10.1152/jn.00347.2004. [DOI] [PubMed] [Google Scholar]
- Schneider T, Neumaier A. Algorithm 808: ARfit - A matlab package for the estimation of parameters and eigenmodes of multivariate autoregressive models. Acm Transactions on Mathematical Software. 2001;27:58–65. [Google Scholar]
- Sharott A, Magill PJ, Bolam JP, Brown P. Directional analysis of coherent oscillatory field potentials in the cerebral cortex and basal ganglia of the rat. J Physiol-London. 2005;562:951–963. doi: 10.1113/jphysiol.2004.073189. [DOI] [PMC free article] [PubMed] [Google Scholar]
- Simasko SM, Mukherjee S. Novel analysis of sleep patterns in rats separates periods of vigilance cycling from long-duration wake events. Behav Brain Res. 2009;196:228–236. doi: 10.1016/j.bbr.2008.09.003. [DOI] [PMC free article] [PubMed] [Google Scholar]
- Soteropoulos DS, Baker SN. Cortico-cerebellar coherence during a precision grip task in the monkey. Journal of Neurophysiology. 2006;95:1194–1206. doi: 10.1152/jn.00935.2005. [DOI] [PubMed] [Google Scholar]
- Steriade M. Corticothalamic resonance, states of vigilance and mentation. Neuroscience. 2000;101:243–276. doi: 10.1016/s0306-4522(00)00353-5. [DOI] [PubMed] [Google Scholar]
- Steriade M, Apostol V, Oakson G. Clustered firing in the cerebello-thalamic pathway during synchronized sleep. Brain Research. 1971a;26:425–432. [PubMed] [Google Scholar]
- Steriade M, Apostol V, Oakson G. Control of unitary activities in cerebellothalamic pathway during wakefulness and synchronized sleep. Journal of Neurophysiology. 1971b;34:389–413. doi: 10.1152/jn.1971.34.3.389. [DOI] [PubMed] [Google Scholar]
- Steriade M, Nunez A, Amzica F. Intracellular analysis of relations between the slow (< 1 Hz) neocortical oscillation and other sleep rhythms of the electroencephalogram. Journal of Neuroscience. 1993a;13:3266–3283. doi: 10.1523/JNEUROSCI.13-08-03266.1993. [DOI] [PMC free article] [PubMed] [Google Scholar]
- Steriade M, Nunez A, Amzica F. A novel slow (< 1 Hz) oscillation of neocortical neurons in vivo: depolarizing and hyperpolarizing components. Journal of Neuroscience. 1993b;13:3252–3265. doi: 10.1523/JNEUROSCI.13-08-03252.1993. [DOI] [PMC free article] [PubMed] [Google Scholar]
- Zilles K. The Cortex of the Rat: A Stereotaxic Atlas. Springer-Verlag; 1985. [Google Scholar]
- Zilles K. Anatomy of the Neocortex: Cytoarchitecture and Myeloarchitecture. In: Kolb B, Tees RC, editors. The Cerebral Cortex of the Rat. 1990. pp. 77–112. [Google Scholar]
Associated Data
This section collects any data citations, data availability statements, or supplementary materials included in this article.