

Abstract
C57Bl/6 mice were administered a high fat, Western diet (WD, 41% fat) or a very high fat lard diet (HFL, 60% fat), and evaluated for cognitive ability using the Stone T-maze and for biochemical markers of brain inflammation. WD consumption resulted in significantly increased body weight and astrocyte reactivity, but not impaired cognition, microglial reactivity, or heightened cytokine levels. HFL increased body weight, and impaired cognition, increased brain inflammation, and decreased BDNF. Collectively, these data suggest that while different diet formulations can increase body weight, the ability of high fat diets to disrupt cognition is linked to brain inflammation.
Keywords: metabolic syndrome, neurodegeneration, obesity, oxidative stress, Western diet
1. INTRODUCTION
The incidence of obesity is increasing worldwide, and is especially pronounced in industrialized nations, including the United States. Obesity rates for American adults nearly doubled from 13.3% to 32.1% during the years 1960 to 2004, while the percentage of overweight Americans during the same period increased from 44.8% to 66% (2006). These numbers highlight an important issue in public health, as obesity is closely associated with an enhanced risk for a myriad of diseases, including type 2 diabetes, cardiovascular disease, gastrointestinal and respiratory difficulties, stroke, and many types of cancer (reviewed in (Haslam and James, 2005)). In the United States, long-term consumption of diets high in fat and calories appears to be a primary cause of obesity. While the exact mechanisms regarding how obesity detrimentally affects health remain unclear, increased inflammation is a key physiologic feature of obesity (reviewed in (Hotamisligil, 2006)). More specifically, obesity is closely associated with a pattern of chronic inflammation characterized by abnormal cytokine production, increased acute-phase reactants and other mediators, and activation of a network of inflammatory signaling pathways (Chandalia and Abate, 2007). Indeed, inflammatory markers correlate tightly with the degree of obesity and insulin resistance (Pickup and Crook, 1998) and are predictive of vascular disease risk as well (Rader, 2000). The inflammatory response that emerges in the presence of obesity seems to be triggered by, and to reside predominantly in adipose tissue, although other sites like the liver might also participate (Shoelson et al., 2007). Inflammatory and innate immune responses are also activated by increased levels of serum lipids, such as cholesterol and saturated long-chain fatty acids (Kennedy et al., 2009), (Averill and Bornfeldt, 2009).
The clinical complications of obesity are now becoming understood to include effects on brain physiology and function. For example, studies have reported deficits in learning, memory, and executive function in obese as compared to nonobese patients (Elias et al., 2003), (Elias et al., 2005), (Waldstein and Katzel, 2006). Furthermore, regression studies associate increased body mass index (BMI) with decreased brain volume (Ward et al., 2005). Other studies have confirmed alterations of brain morphology in overweight and obese young adults, and further show that clinical obesity is associated with reductions in focal gray matter volume and enlarged orbitofrontal white matter, particularly in the frontal lobe (Pannacciulli et al., 2006).
Although the physiologic mechanisms whereby obesity adversely affects the brain are poorly understood, both experimental and human studies have shown that brain function is sensitive to inflammatory pathways and mediators. For example, the highest levels of cytokine binding have been demonstrated in certain areas associated with learning and memory, including regions of the cortex and hippocampus (Parnet et al., 2002). Furthermore, cytokines such as IL-1β and IL-6 can disrupt neurophysiologic mechanisms involved in cognition and memory (Bellinger et al., 1995), (Jankowsky and Patterson, 1999) (Gemma and Bickford, 2007). Additionally, performance in the Morris water maze, a behavioral task dependent on spatial learning, is impaired by infection or peripheral immune activation (Barrientos et al., 2006), (Sparkman et al., 2006). Finally, dementing disorders such as Alzheimer’s disease are believed to be mediated in part via excessive brain inflammation (Benveniste et al., 2001), (Combs, 2009), and indeed, studies indicate that obesity and metabolic syndrome are important risk factors for the development of Alzheimer’s disease (Luchsinger and Gustafson, 2009). Thus, these studies were undertaken to better understand how diet-induced obesity disrupts brain function, and were designed to specifically evaluate the association of brain inflammation and cognitive disruption. To this end, separate cohorts of middle-aged male C57Bl/6 mice were administered either a high fat, Western diet (WD, 41% calories from fat) or a very high fat lard diet (HFL, 60% calories from fat) and examined for cognitive ability and for biochemical markers of brain inflammation.
2. MATERIALS AND METHODS
Diets and Animals
The Institutional Animal Care and Use Committee approved all experimental protocols which were compliant with NIH guidelines on the use of experimental animals. Middle-aged (12 months old) male C57Bl/6 mice were purchased from the National Institute on Aging contract facility maintained by Charles River Laboratories (Wilmimgton, MA), and all diets were purchased from Research Diets (New Brunswick, NJ), and were provided in pelleted form. Animals had ad libitum access to feed formulations and water throughout the study. In initial studies, mice were placed on the Western diet (WD, D12079B), which is composed of 41% fat (butterfat and corn oil) and 29% sucrose, or its corresponding control diet (C-WD, 98052602) for 21 weeks. Formula and composition for WD and C-WD diets are shown in Table 1. In the following study, mice of the same age were placed in the High Fat Lard diet (HFL, D12492) which is composed of 60% fat (pork lard) or its corresponding low fat control diet (C-HFL, D12450B) for 16 weeks. Formula and composition for HFL and C-HFL are shown in Table 2. For both studies, body weight of all mice was measured weekly throughout the duration of diet exposure, mice were humanely euthanatized after diet exposure, and brain tissues were immediately collected and stored in −80°C.
Table 1. WD and C-WD formulation and composition.
Diets were purchased from Research Diets (New Brunswick, NJ), maintained at −80 °C until administered, and were provided in pelleted form.
| WD (D12079B) formula | C-WD (98052602) formula | |||
|---|---|---|---|---|
| gm | kcal | gm | kcal | |
| Protein % | 20 | 17 | 17 | 17 |
| Carb % | 50 | 43 | 71 | 73 |
| Fat % | 21 | 40 | 4 | 10 |
| Total | 100 | 100 | ||
| Kcal/gm | 4.68 | 3.91 | ||
| Casein, 80 mesh | 195 | 780 | 195 | 780 |
| DL-Methionine | 3 | 12 | 3 | 12 |
| Corn Starch | 50 | 200 | 404.4 | 1617.6 |
| Maltodextrin 10 | 100 | 400 | 100 | 400 |
| Sucrose | 341 | 1364 | 341 | 1364 |
| Cellulose, BW200 | 50 | 0 | 50 | 0 |
| Milk Fat (Anhyd) | 200 | 1800 | 0 | 0 |
| Corn Oil | 10 | 90 | 52.5 | 472.5 |
| Cholesterol | 1.5 | 0 | 1.5 | 0 |
| Ethoxyquin | 0.04 | 0 | 0.04 | 0 |
| Salts S10001 | 35 | 0 | 35 | 0 |
| Calcium Carbonate | 4 | 0 | 4 | 0 |
| Vitamin Mix V10001 | 10 | 40 | 10 | 40 |
| Choline Bitartrate | 2 | 0 | 2 | 0 |
| FD&C Red Dye #40 | 0 | 0 | 0.1 | 0 |
| Total | 1001.54 | 4686 | 1198.54 | 4686.1 |
Table 2. HFL and C-HFL formulation and composition.
Diets were purchased from Research Diets (New Brunswick, NJ), maintained at −80 °C until administered, and were provided in pelleted form.
| HFL (D12492) formula | C-HFL (D12450B) formula | |||
|---|---|---|---|---|
| gm | kcal | gm | kcal | |
| Protein % | 26.2 | 20 | 19.2 | 20 |
| Carb % | 26.3 | 20 | 67.3 | 70 |
| Fat % | 34.9 | 60 | 4.3 | 10 |
| Total | 100 | 100 | ||
| Kcal/gm | 5.24 | 3.85 | ||
| Casein, 80 mesh | 200 | 800 | 200 | 800 |
| L-Cystine | 3 | 12 | 3 | 12 |
| Corn Starch | 0 | 0 | 315 | 1260 |
| Maltodextrin 10 | 125 | 500 | 35 | 140 |
| Sucrose | 68.8 | 275.2 | 350 | 1400 |
| Cellulose, BW200 | 50 | 0 | 50 | 0 |
| Soybean Oil | 25 | 225 | 25 | 225 |
| Lard* | 245 | 2205 | 20 | 180 |
| Mineral Mix, S10026 | 10 | 0 | 10 | 0 |
| DiCalcium Phosphate | 13 | 0 | 13 | 0 |
| Calcium Carbonate | 5.5 | 0 | 5.5 | 0 |
| Potassium Citrate, 1 H2O | 16.5 | 0 | 16.5 | 0 |
| Vitamin Mix V10001 | 10 | 40 | 10 | 40 |
| Choline Bitartrate | 2 | 0 | 2 | 0 |
| FD&C Blue Dye #1 | 0.05 | 0 | 0.05 | 0 |
| Total | 773.85 | 4057 | 1055.05 | 4057 |
Typical analysis of cholesterol in lard = 0.95mg/gm. Cholesterol (mg)/4057 kcal = 232.8; cholesterol (mg)/kg = 300.8.
Behavioral analysis of cognitive performance: Stone T-maze
Cognitive ability was tested behaviorally on all mice with a newly-designed five-segmented, Stone T-maze, using a protocol modified from previously published procedures (Pistell et al., 2009). Briefly, performance in this maze requires the mouse to learn the correct sequence of 13 consecutive left and right turns to reach the goal box and successfully escape the maze. Mice are motivated to escape because they are required to wade (not swim) through the maze, as the apparatus is maintained in a tray of water (21–23°C) filled to a level (1.5 cm) that allows the mice to keep their head out of the water while maintaining contact with the floor, but the height of the top prevents rearing. The day before testing, all animals were pre-trained to escape the water using a straight runway constructed of acrylic with opaque sides. The mice were pre-trained in the straight runway to meet a criterion of 13/15 successful escapes in under 15 sec, and in all training and testing procedures, successful task performance was rewarded by escape into a dark and dry goal box.
The day after pre-training in the straight runway, mice were given 15 trials in the T-maze. The mice were run through sequentially in groups of 8–10 mice, such that the first trial was completed by all mice before proceeding to the second trial, insuring that each mouse had sufficient rest between trials to reduce any potential effects of fatigue. Each trial was recorded using video tracking software (Viewpoint Lifesciences, Inc), and the latency to reach the goal box, and the number of errors committed were recorded. The number of errors committed during the trail was chosen as the primary measure of learning because it is unbiased by potential confounds resulting from differences in motor function. For the purpose of presentation, summary and analysis, maze acquisition data was collapsed into 5 separate blocks of 3 trials each.
ELISA assays
Brain tissue samples were taken from the cerebral cortex and homogenized in lysis buffer (Tris-buffered saline supplemented with 1% triton X-100, 5 mM EDTA, and protease inhibitor cocktail (Sigma-Aldrich) centrifuged at 12,000 × g for 10 min, and used for ELISA as described previously (Bruce-Keller et al., 2001). IL-6 and TNF-α were measured using a Duoset kit (R&D Systems, Minneapolis, MN), while MCP-1 and BDNF were also measured using commercially available kits (BD Biosciences, San Jose, CA) in accordance with the manufacturer’s assay protocol. Briefly, 96-well Immulon 4 plates (Dynex Technologies, Chantilly, VA) were coated overnight with 1 μg/ml capture antibody and blocked with PBS + 1% BSA. Cytokines in cell supernatants were detected with 0.5 μg/ml biotinylated antibody. Antibody staining was developed using streptavidin-HRP (1:200) and reacted with SureBlue Reserve TMB Microwell Peroxidase Substrate (KPL, Gaithersburg, Maryland) to visualize staining intensity. Reactions were terminated with TMB Stop solution (KPL), and plates were read on a Victor plate reader (Perkin Elmer, Waltham, MA) set at 450nm with wavelength correction at 540nm.
Measures of glial expression by Western blot
Tissue samples were also taken from the cortex of diet-exposed mice and were homogenized in a Tris-buffered saline (pH 7.4) lysis buffer containing 0.1% Triton X-100, 5 mM EDTA, and protease inhibitor cocktail (Sigma-Aldrich, St. Louis, MO). Samples were then denatured in SDS, and equivalent amounts of protein were electrophoretically separated in polyacrylamide gels and blotted onto nitrocellulose. Blots were processed using the following primary antisera: anti-GFAP (1:5000, Abcam Inc., Cambridge, MA); anti-Iba-1 (1:500, Wako Chemicals USA Inc., Richmond, VA), and anti-tubulin (1:1000, Wako Chemicals USA Inc.). After incubation with primary antibodies, blots were washed and exposed to horseradish peroxidase-conjugated secondary antibodies, and visualized using a chemiluminescence system (Amersham Biosciences, Pittsburgh, PA). Blot images were scanned and densitometrically analyzed for quantification. To ensure accurate quantification across multiple blots, samples from both high fat diet and control diet mice were included in each individual blot. Data were calculated as a ratio of expression over tubulin expression, which was included as an internal loading control. Protein expression in WD or HFD mice was then calculated and presented as percent expression in control diet mice of the same age.
Statistical analyses
All data are shown as mean ± standard error of measurement. Body weight data were analyzed with unpaired t-tests to determine differences between high fat and control diet groups. Behavioral data were analyzed with 2-way analyses of variance (ANOVA) to determine main effects of trail block and diet, followed by planned Bonferroni posthoc comparisons to determine differences between high fat diet and control diet groups. Cytokine and growth factor data were analyzed by unpaired t-tests to determine differences between high fat and control diet groups. All protein expression data were normalized to percent control diet to reconcile data from multiple blots, and were also analyzed by unpaired t-tests to determine differences between high fat and control diet groups. Statistical significance for all analyses was accepted at p < 0.05, and *, **, and *** represent p < 0.05, p < 0.01, and p < 0.001, respectively.
3. RESULTS
Effects of WD on body weight and cognitive performance
While reports have demonstrated that WD consumption can alter cerebral blood flow and amyloid regulation in animal models of Alzheimer’s disease (Hooijmans et al., 2009), (Studzinski et al., 2009), the effects of WD on brain homeostasis in non-transgenic mice have not been well studied. Initial experiments were thus designed to determine if chronic exposure to WD could alter brain function and/or physiology in adult mice. To this end, 12 month-old male mice were administered either the Western diet (WD) composed of 41% fat (butterfat and corn oil) and 29% sucrose, or its respective control low fat diet (C-WD) for 21 weeks. During this period, body weights progressively diverged such that WD mice became heavier than control mice (51.24 ±1.2 grams compared to 37.09 ± 1.11 grams in C-WD mice). Statistically, data show that WD significantly increased body weight (t(21) = 8.801, p < 0.0001) as compared to control diet. Calculation of body weight gain over the duration of diet exposure revealed that WD increased weight by 19.96 ± 1.08 grams as compared to a weight gain of 6.42 ± 1.08 grams in C-WD mice over the same time period.
To determine effects of WD on cognitive function, WD and C-WD mice were behaviorally tested at the end of the diet exposure period in the Stone T maze as described in Methods. Evaluation of errors committed revealed a significant main effect of trial block (F(4,100) = 21.87, p < 0.0001) on maze acquisition (Fig. 1). Thus, these data show that mice indeed learned the route to the goal box during the acquisition procedure and made significantly fewer errors across trial blocks. However, even though error performance of mice on WD were higher during the first block of trials, data analyses revealed no significant effect of diet on maze performance, and no significant trial block X diet interaction. Furthermore, planned comparisons of WD and C-WD groups did not reveal any significant increases in errors made by WD mice during any trial block (Fig. 1).
Figure 1. Effects of WD on acquisition errors in the Stone T-maze.

Male C57Bl/6 mice were exposed to Western diet (WD, open circles) or control diet (C-WD, closed circles) for 21 weeks, and the effects of diet on cognitive function were assessed by recording the number of errors committed over 15 trials of acquisition training. Data are means ± S.E.M. of average errors accrued over 3-trial blocks, with 8–10 individual mice per group. 2-way ANOVA revealed an overall significant main effect of trial on errors committed, but no significant effect of diet, and no interaction.
Effects of WD on brain cytokine levels and reactive gliosis
As consumption of high fat diets has been shown to increase indices of peripheral and brain inflammation in experimental animals (White et al., 2009), (de Vries et al., 2009) (Milanski et al., 2009), experiments were designed to determine the effects of a 21-week exposure to WD on markers of brain inflammation. To this end, levels of the cytokines TNFα and IL-6, the chemokine MCP-1, and the growth factor BDNF were examined by ELISA in samples prepared from the cortex of same mice tested in the T-maze. Data analyses did not reveal any effects of WD on brain levels of TNFα, IL-6, MCP-1, or BDNF as compared to levels in CD mice (Fig. 2).
Figure 2. Effects of WD on cytokine and growth factor levels in mouse brain.

Male C57Bl/6 mice were exposed to Western diet (WD) and control diet (C-WD) for 21 weeks, and the effects of diet on brain levels of the cytokine TNFα and IL-6, the chemokine MCP-1, and the growth factor BDNF were evaluated by ELISA as described in Methods. Data are means and SEM, with 8–10 individual mice per group, and statistical analyses (two-tailed, unpaired t-tests) indicated no significant effects of diet on cytokine, chemokine, or growth factor expression in the cortex.
To determine if WD consumption could modulate glial reactivity in mice, the expression of astrocyte and microglial markers were evaluated using Western blot as described in Methods. The intermediate filament protein glial fibrillary acidic protein (GFAP) was used to evaluate astrocyte hypertrophy (O’Callaghan and Sriram, 2005). Evaluation of blots indicated that WD consumption increased the expression of GFAP (Fig. 3). Blot images were scanned and densitometrically quantified, and data were calculated as a ratio of expression over tubulin expression, and converted to percent expression in control diet-exposed mice as described in Methods. Analyses of data indeed revealed significant increases in GFAP expression in WD mice as compared to C-WD mice (Fig. 3; t(15) = 2.47, p = 0.0263). Microglial reactivity was evaluated by measuring expression of Iba-1, which is a 17-kDa calcium binding protein specifically expressed in macrophages/microglia. Iba-1 is also upregulated during the in vivo activation of these cells (Hilton et al., 2008), (Lee et al., 2008), (Zecca et al., 2008), and this particular marker can be used to evaluate microglial reactivity via Western blot (Ahmed et al., 2007), (Vega-Avelaira et al., 2007). Evaluation of blots did not indicate clear increases in Iba-1 expression in WD brains (Fig. 3). Quantification and statistical analyses of Iba-1 expression over multiple blots likewise failed to reveal a significant increase in Iba-1 expression in WD as compared to C-WD mice (Fig. 3).
Figure 3. Effects of WD on glial marker expression in mouse brain.
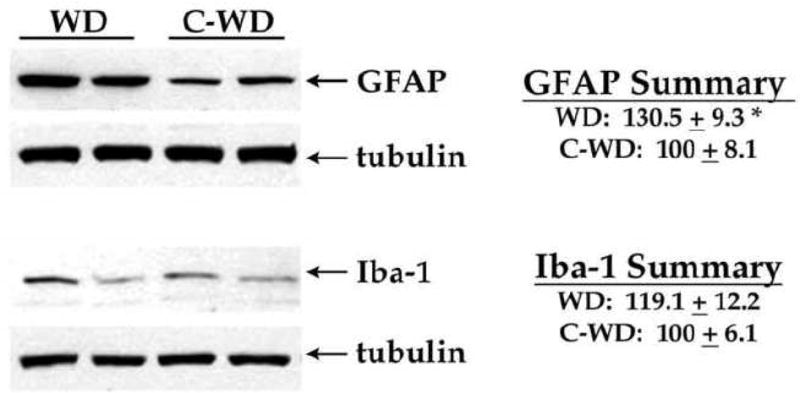
Male C57Bl/6 mice were exposed to Western diet (WD) and control diet (C-WD) for 21 weeks, and the effects of diet on expression of the astrocyte marker GFAP and the microglia marker Iba-1 were measured by Western blot. Individual samples were compared to tubulin as loading controls, and 8–10 mice per group were evaluated. Representative blot images depict the ability of WD to increase GFAP, but not Iba-1, expression in mouse brain. Data are means and SEM, with 8–10 individual mice per group, and statistical analyses (two-tailed, unpaired t-tests) indicated a significant effect of WD on GFAP (* p < 0.05) levels in the cortex.
Effects of HFL on body weight and cognitive performance
To determine if a different high fat diet formulation could alter brain function and/or physiology in adult mice, an additional cohort of 12 month-old male mice was administered the very high fat lard diet (HFL) composed of 60% fat (pork lard), or its respective control diet (C-HFL) for 16 weeks as described in Methods. As was observed for WD, body weights increased over the diet-exposure period such that HFL mice became significantly heavier than control mice (55.28 ±1.07 grams compared to 42.2 ± 1.32 grams in C-HFL mice). Statistically, data analyses show that HFL significantly increased body weight (t(22) = 7.70, p < 0.0001) as compared to control diet. Calculation of body weight gain over the duration of diet exposure revealed that HFL increased weight by 23.16 ± 1.07 grams as compared to a weight gain of 8.18 ± 1.24 grams in C-HFL mice during the same time period.
To determine the effects of HFL on cognitive function, HFL and C-HFL mice were behaviorally tested at the end of the exposure period using the Stone T maze as described in Methods. As was observed for WD mice, evaluation of errors revealed a significant main effect of trial block (F(4,100) = 55.1, p < 0.0001) for maze acquisition (Fig. 4). However, data analyses also revealed a significant effect of diet on maze performance (F(1,100) = 13.24, p = 0.0004), but did not indicate a trial block X diet interaction. Finally, planned comparisons of HFL and C-HFL groups revealed that HFL mice committed significantly more errors in maze acquisition during 10th to 12th, and 13th to 15th trial blocks (Fig. 4).
Figure 4. Effects of HFL on acquisition errors in the Stone T-maze.

Male C57Bl/6 mice were exposed to a high fat lard diet (HFL, open circles) or control diet (C-WD, closed circles) for 19 weeks, and the effects of diet on cognitive function were assessed by recording the number of errors committed over 15 trials of acquisition training. Data are means ± S.E.M. of average errors accrued over 3-trial blocks. 2-way ANOVA revealed overall significant main effects of trial and of diet on errors committed, but no effects of diet, and no interaction. * indicates significant (p < 0.05) increases in errors accrued in HFL mice as compared to 24 month-old C-VHFD mice.
Effects of HFL on brain cytokine levels and reactive gliosis
To next determine if the ability of HFL to impair cognitive performance was associated with enhanced brain inflammation and/or decreased brain growth factor levels, levels of the cytokines TNFα and IL-6, the chemokine MCP-1, and the growth factor BDNF were examined by ELISA as described in Methods. Statistical analyses of cytokine/chemokine ELISA data reveal that brain samples from HFL mice contained significantly higher levels of TNFα (t(18) = 3.83, p = 0.0012), IL-6 (t(18) = 3.37, p = 0.0034), and MCP-1 (t(18) = 4.47, p = 0.0002) as compared to levels in C-HFL mice (Fig. 5). Furthermore, evaluation of BDNF expression data also revealed that HFL consumption was associated with significant decreases in cortical BDNF levels (t(18) = 2.35, p = 0.030) compared to control mice (Fig. 5).
Figure 5. Effects of HFL on cytokine and growth factor levels in mouse brain.

Male C57Bl/6 mice were exposed to high fat lard diet (HFL) and control diet (C-HFL) for 19 weeks, and the effects of diet on brain levels of the cytokine TNFα and IL-6, the chemokine MCP-1, and the growth factor BDNF were evaluated by ELISA as described in Methods. Data are means and SEM, with 8–10 individual mice per group, and statistical analyses (two-tailed, unpaired t-tests) indicated a significant effect of HFL on TNFα (p < 0.01), IL-6 (p < 0.01), MCP-1 (p < 0.001), and BDNF (p < 0.05) levels in the cortex.
To then determine if HFL consumption affected glial reactivity in mice, expression of the astrocyte marker GFAP and the microglial marker Iba-1 were evaluated using Western blot as described in Methods. Visual examination of blots indicated that as observed following WD consumption, HFL consumption increased GFAP expression (Fig. 6). Analyses of scanned and normalized GFAP blot data indeed revealed significant increases in GFAP expression in HFL mice compared to C-HFL mice (Fig. 6; t(18) = 4.01, p = 0.0008). Evaluation of Iba-1 band intensity suggested that HFL consumption increased microglial reactivity (Fig. 6), and indeed, quantification and statistical analyses of Iba-1 expression over multiple blots revealed a significant increase in Iba-1 expression in HFL mice (Fig. 6; t(18) = 2.17, p = 0.0438).
Figure 6. Effects of HFL on glial marker expression in mouse brain.
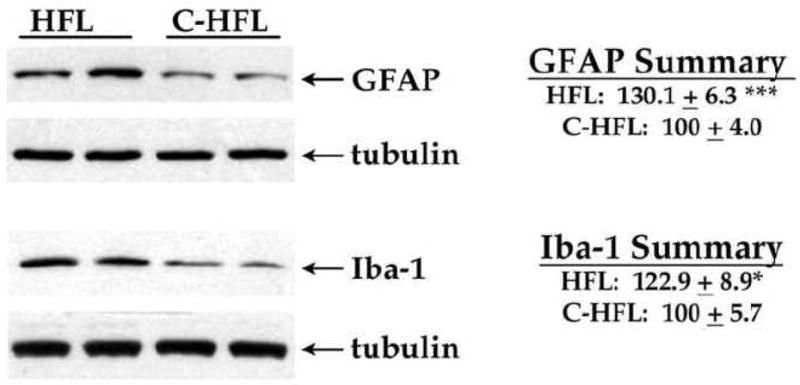
Male C57Bl/6 mice were exposed to high fat lard diet (HFL) and control diet (C-HFL) for 19 weeks, and the effects of diet on expression of the astrocyte marker GFAP and the microglia marker Iba-1 were measured by Western blot. Individual samples were compared to tubulin as loading controls, and 8–10 mice per group were evaluated. Representative blot images depict the ability of HFL to increase GFAP and Iba-1 expression in mouse brain. Data are means and SEM, with 8–10 individual mice per group, and statistical analyses (two-tailed, unpaired t-tests) indicated a significant effect of HFL on GFAP and Iba-1 (** p < 0.001; * p < 0.05, respectively) expression in the cortex.
4. DISCUSSION
In this study, mice were given either the so-called “Western” diet (WD, 41% calories from fat) or very high fat lard diet (HFL, 60 percent calories from fat), and were evaluated to determine the effects of high fat diet consumption on cognitive performance and on markers of brain inflammation. Data show that while WD did increase expression of the astrocyte marker, GFAP, this diet regimen did not significantly impair cognition as assessed in the Stone T-maze or trigger brain inflammation. Conversely, HFL consumption resulted in significant impairments in cognitive performance, and significantly increased expression of the cytokines TNFα and IL-6, the chemokine MCP-1, as well as increased reactive astrocytosis and microgliosis. Finally, HFL consumption was also associated with significant decreases in brain levels of the growth factor BDNF. Overall, these data are consistent with a growing body of literature describing the sensitivity of the brain to obesity and obesity-induced metabolic dysfunction (reviewed in (Bruce-Keller et al., 2009)). For example, one of the earliest reports of experimental obesity on the brain revealed decreased myelin levels and marked alterations to the fatty acid composition of myelin in genetically obese mice (Sena et al., 1985). More recent imaging studies in humans also suggest that abnormalities in white matter and myelin are associated with obesity (Jagust, 2007), (Gazdzinski et al., 2008). One potential consequence of disrupted myelination would be altered axonal transmission and interruptions in neurological function. Results from the current investigation as well as those from other published studies demonstrate an association of obesity with deficits in learning, memory, and executive functioning in human patients (Elias et al., 2003), (Elias et al., 2005), (Waldstein and Katzel, 2006). This relationship between obesity and cognitive impairment has also been documented in experimental animals (Baran et al., 2005), (Winocur and Greenwood, 2005), (Granholm et al., 2008), (White et al., 2009). Collectively, results from this study reinforce the link between diet-induced obesity and cognitive loss, and suggest potentially causal roles for high levels of dietary fats and increased brain inflammation in driving obesity-induced cognitive disruption.
Our findings indicate that consumption of HFL, but not WD, alters cognition and brain inflammation, even though both diets significantly increase body weight. There are several potential explanations for the more potent effects of HFL compared to WD. First, the HFL mice were consistently heavier than WD mice (HFL mice gained 23.16 ± 1.07 grams as compared to 19.96 ± 1.08 grams gained by WD-exposed mice). Thus, it is possible that increased adiposity and body weight per se might mediate the neurological perturbations noted in this study, as excess adipose tissue is highly metabolically active and well-known to release proinflammatory mediators. However, it is clear that both diets elicited significant obesity in mice, while only the HFL regimen increased brain inflammation and decreased cognition. Thus, these data suggest that increased adiposity alone may not be sufficient to explain brain inflammation or cognitive dysfunction. Accordingly, the enhanced effects of the HFL diet compared to the WD diet may also reflect differences in gross quantity of fat or fat composition between the two diets. The WD contains 41% butterfat and relatively high sucrose content, while the HFL consists of 60% lard fat with relatively low carbohydrates. Both diets are open source, and comparison of the specific fat composition of the 2 diets indicates that while the HFL has a greater percentage of total fat (60% versus 41% for the WD), the actual fat contained in the WD formulation has a higher percentage of saturated fat (62% versus 37%). Thus, the heightened vulnerability of mice to HFL appears to be more related to the increased quantity of fat in this diet rather than a more unhealthy fat composition (i.e., unsaturated). In support of this scenario, data have established that high fat, low carbohydrate ketogenic diets can disrupt cognition (Zhao et al., 2004), and trigger glial activation (Silva et al., 2005). Furthermore, data suggest that brain aging is associated with a metabolic shift towards lipid/ketone body oxidation, which may may be associated with inflammatory glial responses and cognitive decline (Brinton, 2008), (Kadish et al., 2009).
While the exact mechanisms whereby HFL consumption detrimentally affects mouse brain are not fully understood, the higher percentage of fat in the HFL could lead to higher serum levels of bioactive lipids, including cholesterol. While an association between cholesterol and cognitive function could be explained based on increased risk of stroke or cerebrovascular hypoperfusion, many studies have examined the role of serum cholesterol in brain function independent of vascular effects. In general, results are mixed, with some studies noting a correlation between lipid levels and cognitive function, whereas other studies do not (Reitz et al., 2005), (Rogers et al., 1989), (Atzmon et al., 2002). Positive studies related to the role of cholesterol in dementia have shown associations primarily related to use of statins, but these studies have also yielded mixed results, with a generally diminished risk for dementia although some of the tests did not achieve statistical significance (Sparks et al., 2005). Conversely, there is compelling evidence that triglycerides and/or free fatty acids are able to alter CNS function. For example, it has been shown that direct administration of triglycerides can impair hippocampal long-term potentiation, and lowering triglycerides pharmacologically with gemfibrozil can reduce the expression of markers of oxidative stress in the brains of obese mice (Farr et al., 2008). These studies are further supported by clinical studies that show elevated triglycerides in association with poor cognitive performance in patients with type 2 diabetes (Perlmuter et al., 1998), and by studies in which the reduction of hypertriglyceridemia with gemfibrozil improved cerebral blood flow and function on the cognitive capacity screening examination (Rogers et al., 1989). Another potential means whereby triglycerides could adversely affect the brain is through their breakdown into free fatty acids, which can also be formed and released directly from adipocytes. GPR40, a putative free fatty acid receptor, has been localized to the hippocampus (Ma et al., 2008), and the saturated free fatty acids palmitic acid and lauric acid have both been shown to trigger inflammatory signaling in cultured macrophages (Laine et al., 2007), (Aronis et al., 2008), and also to modulate astrocytic and microglial signaling (Patil and Chan, 2005).
While these data suggest a clear link between cognitive impairment and brain inflammation, the physiologic mechanisms whereby HFL consumption increases brain inflammatory reactions were not specifically addressed in this study. However, there are several potential mediators that could carry the inflammatory effects of high fat diet to the brain. Over 50 adipokines have been identified, and generally function as hormones to influence energy homeostasis and feeding behavior (Ahima and Osei, 2008). Specific adipokines, particularly adiponectin and leptin, may be important links between obesity and functional changes to the brain. The release of adiponectin is inversely related to the degree of adiposity, and adiponectin exhibits robust anti-inflammatory properties and has potent protective roles against the development of insulin resistance, dyslipidemia and atherosclerosis (reviewed in (Rasouli and Kern, 2008). The anti-inflammatory activities of adiponectin include inhibition of IL-6 and TNFα (Ouchi and Walsh, 2007), and adiponectin has been shown to have neuroprotective and anti-inflammatory properties in the brain (Chen et al., 2009). Likewise, leptin may also be important in CNS responses to obesity (Morrison, 2009). Leptin enters the brain via a saturable transport mechanism (Banks et al., 1996) and while it is known that leptin acts on hypothalamic centers to regulate feeding behavior, leptin receptors are widely expressed in numerous extra-hypothalamic regions of the brain, including the hippocampus, cerebellum, amygdala, and brain stem (Elmquist et al., 1998), (Tartaglia et al., 1995), (Fei et al., 1997). Also related to our findings are a number of studies that have identified a role for leptin in cognitive processes (Harvey et al., 2005). Direct administration of leptin into the dentate gyrus enhances long term potentiation (Wayner et al., 2004), while intravenous administration of leptin to rats facilitates behavioral performance in passive avoidance and Morris water-maze tasks (Oomura et al., 2006). Furthermore, leptin has been shown to modulate the inflammatory signaling in microglia (Pinteaux et al., 2007), (Tang et al., 2007) which could affect brain inflammatory and oxidative pathways.
This report shows a clear association between cognitive impairment and increased brain inflammation. While this association cannot indicate causality per se, there is ample data to indicate that increased brain inflammation can indeed impair brain function. For example, previous reports implicate aberrant or excessive activation of microglia in the pathogenesis of brain injury (reviewed in (Rogers et al., 2007), (Streit et al., 2008)). Experimental evidence suggests that activated microglia could directly contribute to brain injury by inducing lipid peroxidation, DNA fragmentation and protein oxidation in surrounding cells – a phenomena called “bystander lysis” (McGeer and McGeer, 1997). One potential mechanism for this phenomenon is excitotoxicty, as the activation of microglia is also known to elicit glutamate release both in vitro (Barger et al., 2007) and in vivo (Espey et al., 1998), (Mascarucci et al., 1998). Furthermore, the ability of intraventricular LPS to cause neurodegeneration can be prevented by glutamate receptor antagonists (Willard et al., 2000). Additional well established characteristics of activated microglia include their secretion of cytokines including those measured in this study, TNFα and IL-6, which are thought to be important regulators of neuronal function. For example, the production of TNFα by microglia has been shown to be important to neurotoxicity (Chen et al., 1997), and IL-6 is a reliable biomarker for cognitive decline with HIV and models of neuroAIDS (Mankowski et al., 2004). Data also suggest that the detrimental effects of radiation therapy on cognitive function may be based in part on the ability of IL-6 to restrict neurogenesis (Monje et al., 2003). Finally, data in this manuscript show an association of increased brain inflammation with decreased levels of the growth factor BDNF. While cause and effect relationships cannot be established based on this single observation, published reports have shown activation of microglia in rat hippocampus via local LPS injection cause increased production of Il-1β and TNFα, and decreased expression of BDNF and its receptor, TrkB (Tanaka et al., 2006). These data are especially interesting in light of reports showing that obesity and/or metabolic syndrome regimens that cause alterations to cognitive function are associated with decreased BDNF (Wu et al., 2004). It is also well established that BDNF supports synaptic plasticity and neuronal excitability (Jovanovic et al., 2000), and appears to be important for maintaining learning and memory function particularly in the aging brain (Croll et al., 1998), (Kovalchuk et al., 2002). Indeed, as the mice were 12–16 months of age during this study, it is quite possible that their increasing age contributed to their vulnerability to HFL, although the exact contribution of age to susceptibility to high fat diets has not yet been evaluated. Conversely, cognitive performance is known to decrease and expression of inflammatory mediators increase with age, and it is possible that even the “control” mice might have mild impairments compared to younger mice. Thus, the same study in 3-month old mice might have revealed a significant effect of both HFL and WD regimens, again indicating the need for a systematic evaluation of how increasing age might modulate the ability of high fat diets to detrimentally affect the brain. Taken together, these data highlight a compelling link between diet-induced obesity, brain inflammation, and cognitive impairment. Ongoing studies designed to determine the specific roles of serum lipids and adipokines in the detrimental effects of high fat diet consumption on the brain will help to unravel the complex but physiologically significant relationships between neuroinflammation and cognitive function.
Acknowledgments
The authors are grateful to Megan Purpera and Sun-Ok Fernandez-Kim for expert technical assistance and animal handling. This work was supported by grants from the NIH (NS46267, DA19398, and AG05119 to AJB-K; NS051570 and RR021945 to CDM). This study also used PBRC Core facilities (Animal Phenotyping) that are funded by the NIH (P20-RR021945 and P30-DK072476).
Footnotes
Publisher's Disclaimer: This is a PDF file of an unedited manuscript that has been accepted for publication. As a service to our customers we are providing this early version of the manuscript. The manuscript will undergo copyediting, typesetting, and review of the resulting proof before it is published in its final citable form. Please note that during the production process errors may be discovered which could affect the content, and all legal disclaimers that apply to the journal pertain.
References
- Ahima RS, Osei SY. Adipokines in obesity. Front Horm Res. 2008;36:182–197. doi: 10.1159/000115365. [DOI] [PubMed] [Google Scholar]
- Ahmed Z, Shaw G, Sharma VP, Yang C, McGowan E, Dickson DW. Actin-binding proteins coronin-1a and IBA-1 are effective microglial markers for immunohistochemistry. J Histochem Cytochem. 2007;55:687–700. doi: 10.1369/jhc.6A7156.2007. [DOI] [PubMed] [Google Scholar]
- Aronis A, Madar Z, Tirosh O. Lipotoxic effects of triacylglycerols in J774.2 macrophages. Nutrition. 2008;24:167–176. doi: 10.1016/j.nut.2007.10.017. [DOI] [PubMed] [Google Scholar]
- Atzmon G, Gabriely I, Greiner W, Davidson D, Schechter C, Barzilai N. Plasma HDL levels highly correlate with cognitive function in exceptional longevity. J Gerontol Med Sci. 2002;57:M712–M715. doi: 10.1093/gerona/57.11.m712. [DOI] [PubMed] [Google Scholar]
- Averill MM, Bornfeldt KE. Lipids versus glucose in inflammation and the pathogenesis of macrovascular disease in diabetes. Curr Diab Rep. 2009;9:18–25. doi: 10.1007/s11892-009-0005-x. [DOI] [PMC free article] [PubMed] [Google Scholar]
- Banks WA, Kastin A, Huang W, Jaspan J, Maness LM. Leptin enters the brain by a saturable system independent of insulin. Peptides. 1996;17:305–311. doi: 10.1016/0196-9781(96)00025-3. [DOI] [PubMed] [Google Scholar]
- Baran SE, Campbell AM, Kleen JK, Foltz CH, Wright RL, Diamond DM, Conrad CD. Combination of high fat diet and chronic stress retracts hippocampal dendrites. Neuroreport. 2005;16:39–43. doi: 10.1097/00001756-200501190-00010. [DOI] [PMC free article] [PubMed] [Google Scholar]
- Barger SW, Goodwin ME, Porter MM, Beggs ML. Glutamate release from activated microglia requires the oxidative burst and lipid peroxidation. J Neurochem. 2007;101:1205–1213. doi: 10.1111/j.1471-4159.2007.04487.x. [DOI] [PMC free article] [PubMed] [Google Scholar]
- Barrientos RM, Higgins EA, Biedenkapp JC, Sprunger DB, Wright-Hardesty KJ, Watkins LR, Rudy JW, Maier SF. Peripheral infection and aging interact to impair hippocampal memory consolidation. Neurobiol Aging. 2006;27:723–732. doi: 10.1016/j.neurobiolaging.2005.03.010. [DOI] [PubMed] [Google Scholar]
- Bellinger FP, Madamba SG, Campbell IL, Siggins GR. Reduced long-term potentiation in the dentate gyrus of transgenic mice with cerebral overexpression of interleukin-6. Neurosci Lett. 1995;198:95–98. doi: 10.1016/0304-3940(95)11976-4. [DOI] [PubMed] [Google Scholar]
- Benveniste EN, Nguyen VT, O’Keefe GM. Immunological aspects of microglia: relevance to Alzheimer’s disease. Neurochem Int. 2001;39:381–391. doi: 10.1016/s0197-0186(01)00045-6. [DOI] [PubMed] [Google Scholar]
- Brinton RD. Estrogen regulation of glucose metabolism and mitochondrial function: therapeutic implications for prevention of Alzheimer’s disease. Adv Drug Deliv Rev. 2008;60:1504–1511. doi: 10.1016/j.addr.2008.06.003. [DOI] [PMC free article] [PubMed] [Google Scholar]
- Bruce-Keller AJ, Barger SW, Moss NI, Pham JT, Keller JN, Nath A. Pro-inflammatory and pro-oxidant properties of the HIV protein Tat in a microglial cell line: attenuation by 17beta-estradiol. J Neurochem. 2001;78:1315–1324. doi: 10.1046/j.1471-4159.2001.00511.x. [DOI] [PubMed] [Google Scholar]
- Bruce-Keller AJ, Keller JN, Morrison CD. Obesity and vulnerability of the CNS. Biochim Biophys Acta. 2009;1792:395–400. doi: 10.1016/j.bbadis.2008.10.004. [DOI] [PMC free article] [PubMed] [Google Scholar]
- CDC. Chartbook on Trends in the Health of Americans. Public Health Service; Hyattsville, MD: 2006. National Center for Health Statistics. [Google Scholar]
- Chandalia M, Abate N. Metabolic complications of obesity: inflated or inflamed? J Diabetes Complications. 2007;21:128–136. doi: 10.1016/j.jdiacomp.2006.10.004. [DOI] [PubMed] [Google Scholar]
- Chen B, Liao WQ, Xu N, Xu H, Wen JY, Yu CA, Liu XY, Li CL, Zhao SM, Campbell W. Adiponectin protects against cerebral ischemia-reperfusion injury through anti-inflammatory action. Brain Res. 2009;1273:129–137. doi: 10.1016/j.brainres.2009.04.002. [DOI] [PubMed] [Google Scholar]
- Chen P, Mayne M, Power C, Nath A. The Tat protein of HIV-1 induces tumor necrosis factor-alpha production. J Biol Chem. 1997;272:22385–22388. doi: 10.1074/jbc.272.36.22385. [DOI] [PubMed] [Google Scholar]
- Combs CK. Inflammation and Microglia Actions in Alzheimer’s Disease. J Neuroimmune Pharmacol. 2009 doi: 10.1007/s11481-009-9165-3. Epub ahead of print. [DOI] [PubMed] [Google Scholar]
- Croll SD, Ip NY, Lindsay RM, Wiegand SJ. Expression of BDNF and trkB as a function of age and cognitive performance. Brain Res. 1998;812:200–208. doi: 10.1016/s0006-8993(98)00993-7. [DOI] [PubMed] [Google Scholar]
- de Vries A, Hazlewood L, Fitch PM, Seckl JR, Foster P, Howie SE. High-fat feeding redirects cytokine responses and decreases allergic airway eosinophilia. Clin Exp Allergy. 2009 doi: 10.1111/j.1365-2222.2008.03179.x. Epub ahead of print. [DOI] [PubMed] [Google Scholar]
- Elias MF, Elias PK, Sullivan LM, Wolf PA, D’Agostino RB. Lower cognitive function in the presence of obesity and hypertension: the Framingham Heart Study. Int J Obes Relat Metab Disord. 2003;27:260–268. doi: 10.1038/sj.ijo.802225. [DOI] [PubMed] [Google Scholar]
- Elias MF, Elias PK, Sullivan LM, Wolf PA, D’Agostino RB. Obesity, diabetes and cognitive deficit: the Framingham Heart Study. Neurobiol Aging. 2005;26:11–16. doi: 10.1016/j.neurobiolaging.2005.08.019. [DOI] [PubMed] [Google Scholar]
- Elmquist JK, Bjorbaek C, Ahima RS, Flier JS, Saper CB. Distributions of leptin receptor mRNA isoforms in the rat brain. J Comp Neurol. 1998;395:535–547. [PubMed] [Google Scholar]
- Espey MG, Kustova Y, Sei Y, Basile AS. Extracellular glutamate levels are chronically elevated in the brains of LP-BM5-infected mice: a mechanism of retrovirus-induced encephalopathy. J Neurochem. 1998;71:2079–2087. doi: 10.1046/j.1471-4159.1998.71052079.x. [DOI] [PubMed] [Google Scholar]
- Farr SA, Yamada KA, Butterfield DA, Abdul HM, Xu L, Miller NE, Banks WA, Morley JE. Obesity and hypertriglyceridemia produce cognitive impairment. Endocrinology. 2008;149:2628–2636. doi: 10.1210/en.2007-1722. [DOI] [PMC free article] [PubMed] [Google Scholar]
- Fei H, Okano HJ, Li C, Lee GH, Zhao C, Darnell R, Friedman JM. Anatomic localization of alternatively spliced leptin receptors (Ob-R) in mouse brain and other tissues. Proc Natl Acad Sci USA. 1997;94:7001–7005. doi: 10.1073/pnas.94.13.7001. [DOI] [PMC free article] [PubMed] [Google Scholar]
- Gazdzinski S, Kornak J, Weiner MW, Meyerhoff DJ. Body mass index and magnetic resonance markers of brain integrity in adults. Ann Neurol. 2008;63:652–657. doi: 10.1002/ana.21377. [DOI] [PMC free article] [PubMed] [Google Scholar]
- Gemma C, Bickford PC. Interleukin-1beta and caspase-1: players in the regulation of age-related cognitive dysfunction. Rev Neurosci. 2007;18:137–148. doi: 10.1515/revneuro.2007.18.2.137. [DOI] [PubMed] [Google Scholar]
- Granholm AC, Bimonte-Nelson HA, Moore AB, Nelson ME, Freeman LR, Sambamurti K. Effects of a saturated fat and high cholesterol diet on memory and hippocampal morphology in the middle-aged rat. J Alzheimers Dis. 2008;14:133–145. doi: 10.3233/jad-2008-14202. [DOI] [PMC free article] [PubMed] [Google Scholar]
- Harvey J, Shanley LJ, O’Malley D, Irving AJ. Leptin: a potential cognitive enhancer? Biochem Soc Trans. 2005;33:1029–1032. doi: 10.1042/BST20051029. [DOI] [PubMed] [Google Scholar]
- Haslam DW, James WP. Obesity Lancet Neurol. 2005;366:1197–1209. doi: 10.1016/S0140-6736(05)67483-1. [DOI] [PubMed] [Google Scholar]
- Hilton GD, Stoica BA, Byrnes KR, Faden AI. Roscovitine reduces neuronal loss, glial activation, and neurologic deficits after brain trauma. J Cereb Blood Flow Metab. 2008;28:1845–1859. doi: 10.1038/jcbfm.2008.75. [DOI] [PMC free article] [PubMed] [Google Scholar]
- Hooijmans CR, Van der Zee CE, Dederen PJ, Brouwer KM, Reijmer YD, van Groen T, Broersen LM, Lütjohann D, Heerschap A, Kiliaan AJ. DHA and cholesterol containing diets influence Alzheimer-like pathology, cognition and cerebral vasculature in APPswe/PS1dE9 mice. Neurobiol Dis. 2009;33:482–498. doi: 10.1016/j.nbd.2008.12.002. [DOI] [PubMed] [Google Scholar]
- Hotamisligil GS. Inflammation and metabolic disorders. Nature. 2006;444:860–867. doi: 10.1038/nature05485. [DOI] [PubMed] [Google Scholar]
- Jagust W. What can imaging reveal about obesity and the brain? Curr Alzheimer Res. 2007;4:135–139. doi: 10.2174/156720507780362146. [DOI] [PubMed] [Google Scholar]
- Jankowsky JL, Patterson PH. Cytokine and growth factor involvement in long-term potentiation. Mol Cell Neurosci. 1999:273–286. doi: 10.1006/mcne.1999.0792. [DOI] [PubMed] [Google Scholar]
- Jovanovic JN, Czernik AJ, Fienberg AA, Greengard P, Sihra TS. Synapsins as mediators of BDNF-enhanced neurotransmitter release. Nature Neurosci. 2000;3:323–329. doi: 10.1038/73888. [DOI] [PubMed] [Google Scholar]
- Kadish I, Thibault O, Blalock EM, Chen KC, Gant JC, Porter NM, Landfield PW. Hippocampal and cognitive aging across the lifespan: a bioenergetic shift precedes and increased cholesterol trafficking parallels memory impairment. J Neurosci. 2009;29:1805–1816. doi: 10.1523/JNEUROSCI.4599-08.2009. [DOI] [PMC free article] [PubMed] [Google Scholar]
- Kennedy A, Martinez K, Chuang CC, LaPoint K, McIntosh M. Saturated fatty acid-mediated inflammation and insulin resistance in adipose tissue: mechanisms of action and implications. J Nutr. 2009;139:1–4. doi: 10.3945/jn.108.098269. [DOI] [PubMed] [Google Scholar]
- Kovalchuk Y, Hanse E, Kafitz KW, Konnerth A. Postsynaptic induction of BDNF-mediated long-term potentiation. Science. 2002;295:1729–1721. doi: 10.1126/science.1067766. [DOI] [PubMed] [Google Scholar]
- Laine PS, Schwartz EA, Wang Y, Zhang WY, Karnik SK, Musi N, Reaven PD. Palmitic acid induces IP-10 expression in human macrophages via NF-kappaB activation. Biochem Biophys Res Commun. 2007;358:150–155. doi: 10.1016/j.bbrc.2007.04.092. [DOI] [PubMed] [Google Scholar]
- Lee CH, Hwang IK, Lee IS, Yoo KY, Choi JH, Lee BH, Won MH. Differential immunoreactivity of microglial and astrocytic marker protein in the hippocampus of the seizure resistant and sensitive gerbils. J Vet Med Sci. 2008;70:1405–1409. doi: 10.1292/jvms.70.1405. [DOI] [PubMed] [Google Scholar]
- Luchsinger JA, Gustafson DR. Adiposity, type 2 diabetes, and Alzheimer’s disease. J Alzheimers Dis. 2009;16:693–704. doi: 10.3233/JAD-2009-1022. [DOI] [PMC free article] [PubMed] [Google Scholar]
- Ma D, Lu L, Boneva NB, Warashina S, Kaplamadzhiev DB, Mori Y, Nakaya MA, Kikuchi M, Tonchev AB, Okano H, Yamashima T. Expression of free fatty acid receptor GPR40 in the neurogenic niche of adult monkey hippocampus. Hippocampus. 2008;18:326–333. doi: 10.1002/hipo.20393. [DOI] [PubMed] [Google Scholar]
- Mankowski JL, Queen SE, Clements JE, Zink MC. Cerebrospinal fluid markers that predict SIV CNS disease. J Neuroimmunol. 2004;157:66–70. doi: 10.1016/j.jneuroim.2004.08.031. [DOI] [PubMed] [Google Scholar]
- Mascarucci P, Perego C, Terrazzino S, De Simoni MG. Glutamate release in the nucleus tractus solitarius induced by peripheral lipopolysaccharide and interleukin-1 beta. Neuroscience. 1998;86:1285–1290. doi: 10.1016/s0306-4522(98)00105-5. [DOI] [PubMed] [Google Scholar]
- McGeer PL, McGeer EG. The role of the immune system in neurodegenerative disorders. Mov Disord. 1997;12:855–858. doi: 10.1002/mds.870120604. [DOI] [PubMed] [Google Scholar]
- Milanski M, Degasperi G, Coope A, Morari J, Denis R, Cintra DE, Tsukumo DM, Anhe G, Amaral ME, Takahashi HK, Curi R, Oliveira HC, Carvalheira JB, Bordin S, Saad MJ, Velloso LA. Saturated fatty acids produce an inflammatory response predominantly through the activation of TLR4 signaling in hypothalamus: implications for the pathogenesis of obesity. J Neurosci. 2009;28:359–370. doi: 10.1523/JNEUROSCI.2760-08.2009. [DOI] [PMC free article] [PubMed] [Google Scholar]
- Monje ML, Toda H, Palmer TD. Inflammatory blockade restores adult hippocampal neurogenesis. Science. 2003;302:1760–1765. doi: 10.1126/science.1088417. [DOI] [PubMed] [Google Scholar]
- Morrison C. Leptin signaling in brain: A link between nutrition and cognition? Biochim Biophys Acta. 2009;1792:401–408. doi: 10.1016/j.bbadis.2008.12.004. [DOI] [PMC free article] [PubMed] [Google Scholar]
- O’Callaghan JP, Sriram K. Glial fibrillary acidic protein and related glial proteins as biomarkers of neurotoxicity. Expert Opin Drug Saf. 2005;4:433–442. doi: 10.1517/14740338.4.3.433. [DOI] [PubMed] [Google Scholar]
- Oomura Y, Hori N, Shiraishi T, Fukunaga K, Takeda H, Tsuji M, Matsumiya T, Ishibashi M, Aou S, Li X, Kohno D, Uramura K, Sougawa H, Yada T, Wayner M, Sasaki K. Leptin facilitates learning and memory performance and enhances hippocampal CA1 long-term potentiation and CaMK II phosphorylation in rats. Peptides. 2006;11:2738–2749. doi: 10.1016/j.peptides.2006.07.001. [DOI] [PubMed] [Google Scholar]
- Ouchi N, Walsh K. Adiponectin as an anti-inflammatory factor. Clin Chim Acta. 2007;380:24–30. doi: 10.1016/j.cca.2007.01.026. [DOI] [PMC free article] [PubMed] [Google Scholar]
- Pannacciulli N, Del Parigi A, Chen K, Le DS, Reiman EM, Tataranni PA. Neuroimage. Vol. 31. 2006. Brain abnormalities in human obesity: a voxel-based morphometric study; pp. 1419–1425. [DOI] [PubMed] [Google Scholar]
- Parnet P, Kelley KW, Bluthé RM, Dantzer R. Expression and regulation of interleukin-1 receptors in the brain. Role in cytokines-induced sickness behavior. J Neuroimmunol. 2002;125:5–14. doi: 10.1016/s0165-5728(02)00022-x. [DOI] [PubMed] [Google Scholar]
- Patil S, Chan C. Palmitic and stearic fatty acids induce Alzheimer-like hyperphosphorylation of tau in primary rat cortical neurons. Neurosci Lett. 2005;384:288–293. doi: 10.1016/j.neulet.2005.05.003. [DOI] [PubMed] [Google Scholar]
- Perlmuter LC, Nathan DM, Goldfinger SH, Russo PA, Yates J, Larkin M. Triglyceride levels affect cognitive function in non-insulin-dependent diabetes. J Diabetes Complications. 1998;2:210–213. doi: 10.1016/s0891-6632(88)80011-4. [DOI] [PubMed] [Google Scholar]
- Pickup JC, Crook MA. Is type II diabetes mellitus a disease of the innate immune system? Diabetologia. 1998;41:1241–1248. doi: 10.1007/s001250051058. [DOI] [PubMed] [Google Scholar]
- Pinteaux E, Inoue W, Schmidt L, Molina-Holgado F, Rothwell NJ, Luheshi GN. Leptin induces interleukin-1beta release from rat microglial cells through a caspase 1 independent mechanism. J Neurochem. 2007;102:826–833. doi: 10.1111/j.1471-4159.2007.04559.x. [DOI] [PubMed] [Google Scholar]
- Pistell PJ, Nelson CM, Miller MG, Spangler EL, Ingram DK, Devan BD. Striatal lesions interfere with acquisition of a complex maze task in rats. Behav Brain Res. 2009;197:138–143. doi: 10.1016/j.bbr.2008.08.015. [DOI] [PMC free article] [PubMed] [Google Scholar]
- Rader DJ. Inflammatory markers of coronary risk. N Engl J Med. 2000;343:1179–1182. doi: 10.1056/NEJM200010193431609. [DOI] [PubMed] [Google Scholar]
- Rasouli N, Kern PA. Adipocytokines and the metabolic complications of obesity. J Clin Endocrinol Metab. 2008;93 (11 Suppl 1):S64–73. doi: 10.1210/jc.2008-1613. [DOI] [PMC free article] [PubMed] [Google Scholar]
- Reitz C, Luchsinger J, Tang M, Manly J, Mayeux R. Impact of plasma lipids and time on memory performance in healthy elderly without dementia. Neurology. 2005;64:1378–1383. doi: 10.1212/01.WNL.0000158274.31318.3C. [DOI] [PMC free article] [PubMed] [Google Scholar]
- Rogers J, Mastroeni D, Leonard B, Joyce J, Grover A. Neuroinflammation in Alzheimer’s disease and Parkinson’s disease: are microglia pathogenic in either disorder? Int Rev Neurobiol. 2007;82:235–246. doi: 10.1016/S0074-7742(07)82012-5. [DOI] [PubMed] [Google Scholar]
- Rogers RL, Meyer JS, McClintic K, Mortel KF. Reducing hypertriglyceridemia in elderly patients with cerebrovascular disease stabilizes or improves cognition and cerebral perfusion. Angiology. 1989;40:260–269. [PubMed] [Google Scholar]
- Sena A, Sarliève LL, Rebel G. Brain myelin of genetically obese mice. J Neurol Sci. 1985;68:233–243. doi: 10.1016/0022-510x(85)90104-2. [DOI] [PubMed] [Google Scholar]
- Shoelson SE, Herrero L, Naaz A. Obesity, inflammation, and insulin resistance. Gastroenterology. 2007;132:2169–2180. doi: 10.1053/j.gastro.2007.03.059. [DOI] [PubMed] [Google Scholar]
- Silva MC, Rocha J, Pires CS, Ribeiro LC, Brolese G, Leite MC, Almeida LM, Tramontina F, Ziegler DR, Gonçalves CA. Transitory gliosis in the CA3 hippocampal region in rats fed on a ketogenic diet. Nutr Neurosci. 2005;8:259–264. doi: 10.1080/10284150500475032. [DOI] [PubMed] [Google Scholar]
- Sparkman NL, Buchanan JB, Heyen JR, Chen J, Beverly JL, Johnson RW. Interleukin-6 facilitates lipopolysaccharide-induced disruption in working memory and expression of other proinflammatory cytokines in hippocampal neuronal cell layers. J Neurosci. 2006;26:10709–10716. doi: 10.1523/JNEUROSCI.3376-06.2006. [DOI] [PMC free article] [PubMed] [Google Scholar]
- Sparks DL, Sabbagh MN, Conner DJ, Lopez J, Launer LJ, Browne P, Wasser D, Johnson-Traver S, Lochhead J, Ziolwolski C. Atorvastatin for the treatment of mild to moderate Alzheimer disease preliminary results. Arch Neurol. 2005;62:753–757. doi: 10.1001/archneur.62.5.753. [DOI] [PubMed] [Google Scholar]
- Streit WJ, Miller KR, Lopes KO, Njie E. Microglial degeneration in the aging brain--bad news for neurons? Front Biosci. 2008;13:3423–3438. doi: 10.2741/2937. [DOI] [PubMed] [Google Scholar]
- Studzinski CM, Li F, Bruce-Keller AJ, Fernandez-Kim SO, Zhang L, Weidner AM, Markesbery WR, Murphy MP, Keller JN. Effects of short-term Western diet on cerebral oxidative stress and diabetes related factors in APP x PS1 knock-in mice. J Neurochem. 2009;108:860–866. doi: 10.1111/j.1471-4159.2008.05798.x. [DOI] [PMC free article] [PubMed] [Google Scholar]
- Tanaka S, Ide M, Shibutani T, Ohtaki H, Numazawa S, Shioda S, Yoshida T. Lipopolysaccharide-induced microglial activation induces learning and memory deficits without neuronal cell death in rats. J Neurosci Res. 2006;83:557–566. doi: 10.1002/jnr.20752. [DOI] [PubMed] [Google Scholar]
- Tang CH, Lu DY, Yang RS, Tsai HY, Kao MC, Fu WM, Chen YF. Leptin-induced IL-6 production is mediated by leptin receptor, insulin receptor substrate-1, phosphatidylinositol 3-kinase, Akt, NF-kappaB, and p300 pathway in microglia. J Immunol. 2007;179:1292–1302. doi: 10.4049/jimmunol.179.2.1292. [DOI] [PubMed] [Google Scholar]
- Tartaglia LA, Dembski M, Weng X, Deng N, Culpepper J, Devos R, Richards GJ, Campfield LA, Clark FT, Deeds J, Muir C, Sanker S, Moriarty A, Moore KJ, Smutko JS, Mays GG, Wool EA, Monroe CA, Tepper RI. Identification and expression cloning of a leptin receptor. OB-R Cell. 1995;83:1263–1271. doi: 10.1016/0092-8674(95)90151-5. [DOI] [PubMed] [Google Scholar]
- Vega-Avelaira D, Moss A, Fitzgerald M. Age-related changes in the spinal cord microglial and astrocytic response profile to nerve injury. Brain Behav Immun. 2007;21:617–623. doi: 10.1016/j.bbi.2006.10.007. [DOI] [PubMed] [Google Scholar]
- Waldstein SR, Katzel LI. Interactive relations of central versus total obesity and blood pressure to cognitive function. Int J Obes (Lond) 2006;30:201–207. doi: 10.1038/sj.ijo.0803114. [DOI] [PubMed] [Google Scholar]
- Ward MA, Carlsson CM, Trivedi MA, Sager MA, Johnson SC. The effect of body mass index on global brain volume in middle-aged adults: a cross sectional study. BMC Neurol. 2005:23. doi: 10.1186/1471-2377-5-23. [DOI] [PMC free article] [PubMed] [Google Scholar]
- Wayner MJ, Armstrong DL, Phelix CF, Oomura Y. Orexin-A (Hypocretin-1) and leptin enhance LTP in the dentate gyrus of rats in vivo. Peptides. 2004;25:991–996. doi: 10.1016/j.peptides.2004.03.018. [DOI] [PubMed] [Google Scholar]
- White CL, Pistell PJ, Purpera MN, Gupta S, Fernandez-Kim SO, Hise TL, Keller JN, Ingram DK, Morrison CD, Bruce-Keller AJ. Effects of high fat diet on Morris maze performance, oxidative stress, and inflammation in rats: contributions of maternal diet. Neurobiol Dis. 2009;35:3–13. doi: 10.1016/j.nbd.2009.04.002. [DOI] [PMC free article] [PubMed] [Google Scholar]
- Willard LB, Hauss-Wegrzyniak B, Danysz W, Wenk GL. The cytotoxicity of chronic neuroinflammation upon basal forebrain cholinergic neurons of rats can be attenuated by glutamatergic antagonism or cyclooxygenase-2 inhibition. Exp Brain Res. 2000;134:58–65. doi: 10.1007/s002210000446. [DOI] [PubMed] [Google Scholar]
- Winocur G, Greenwood CE. Studies of the effects of high fat diets on cognitive function in a rat model. Neurobiol Aging. 2005;26:46–49. doi: 10.1016/j.neurobiolaging.2005.09.003. [DOI] [PubMed] [Google Scholar]
- Wu A, Ying Z, Gomez-Pinilla F. The interplay between oxidative stress and brain-derived neurotrophic factor modulates the outcome of a saturated fat diet on synaptic plasticity and cognition. Eur J Neurosci. 2004;19:1699–1707. doi: 10.1111/j.1460-9568.2004.03246.x. [DOI] [PubMed] [Google Scholar]
- Zecca L, Wilms H, Geick S, Claasen JH, Brandenburg LO, Holzknecht C, Panizza ML, Zucca FA, Deuschl G, Sievers J, Lucius R. Human neuromelanin induces neuroinflammation and neurodegeneration in the rat substantia nigra: implications for Parkinson’s disease. Acta Neuropathol. 2008;116:47–55. doi: 10.1007/s00401-008-0361-7. [DOI] [PubMed] [Google Scholar]
- Zhao Q, Stafstrom CE, Fu DD, Hu Y, Holmes GL. Detrimental effects of the ketogenic diet on cognitive function in rats. Pediatr Res. 2004;55:498–506. doi: 10.1203/01.PDR.0000112032.47575.D1. [DOI] [PubMed] [Google Scholar]