

Abstract
Neuronostatin (NST) is a newly identified peptide of 13-amino acids encoded by the somatostatin (SST) gene. Using a rabbit polyclonal antiserum against the human NST, neuronostatin-immunoreactive (irNST) cells comparable in number and intensity to somatostatin immunoreactive (irSST) cells were detected in the hypothalamic periventricular nucleus. Fewer and/or less intensely labeled irNST cells were noted in other regions such as the hippocampus, cortex, amygdala, and cerebellum. Double-labeling hypothalamic sections with NST- and SST-antiserum revealed an extensive overlapping of irNST and irSST cells in the periventricular nucleus. Pre-absorption of the NST-antiserum with NST (1 µg/ml) but not with SST (1 µg/ml) abrogated irNST and vice versa. The activity of NST on dissociated and cultured hypothalamic neurons was assessed by the Ca2+ imaging method. NST (10, 100, 1000 nM) concentration-dependently elevated intracellular Ca2+ concentrations [Ca2+]i in a population of hypothalamic neurons with two distinct profiles: 1) a fast and transitory increase in [Ca2+]i, and 2) an oscillatory response. Whereas, SST (100 nM) reduced the basal [Ca2+]i in 21 of 61 hypothalamic neurons examined; an increase was not observed in any of the cells. Optical imaging with a slow-responding voltage sensitive dye DiBAC4(3) showed that NST (100 nM) depolarized or hyperpolarized; whereas, SST (100 nM) hyperpolarized a population of hypothalamic neurons. The result shows that NST and SST, though derived from the same precursor protein, exert different calcium mobilizing effects on cultured rat hypothalamic neurons, resulting in diverse cellular activities.
Keywords: periventricular nucleus, arcuate nucleus, cortex, hippocampus
Introduction
Somatostatin (SST) is a 14-amino acid cyclic polypeptide originally isolated from extracts of bovine hypothalamus based on its ability to inhibit growth hormone release from cultured rat pituitary cells (Brazeau et al., 1973). Subsequent studies show that SST is, in addition to the hypothalamus, widely distributed to neural and non neural tissues including the spinal cord, autonomic and sensory ganglia, pancreas, stomach, intestine, and kidney. The original concept that SST is primarily involved in regulation of growth hormone has since been considerably expanded; for example, the peptide regulates the secretion of thyrotropin-releasing hormone, glucagon and insulin, and modulates gastrointestinal activity. In addition to SST, the pro-somatostatin yields two mature peptides, a 28-amino acid peptide (SS28) and a 12-amino acid peptide (SS1-12) (Brazeau et al., 1973; Benoit et al., 1982, 1984; Goodman et al., 1983; Shen et al., 1984). Immunohistochemical studies with antibodies selective against SS28 and SS1-12 show that these two peptides may be differentially processed within cortical neurons such that SS28 is found predominately in the somata and SS1-12 in the nerve terminals (Morrison et al., 1982, 1983).
Recently, a 13-amino acid non cyclic amidated peptide, named neuronostatin (NST), was isolated from porcine tissues, with a predicted sequence based on bioinformatic analysis of evolutionary conserved sequences of pro-somatostatin (Samson et al., 2008). NST is found to be present in the rodent brain, pancreas, stomach and small intestine (Samson et al., 2008). While the tissue distribution of NST appears to be similar to that of SST, the ratio of NST and SST present in the same tissue samples varies, suggesting that these two peptides may be differentially processed in a given cell. Further, NST is found not to interact with the five putative somatostatin receptors expressed in human embryonic kidney 293T cells nor does it affect the basal or growth hormone releasing hormone-stimulated secretion of growth hormone, implying NST and SST may interact with different receptors or binding sites.
The present study was undertaken to establish the expression pattern of NST and compare to that of SST in the rat brain by immunohistochemical techniques, and to compare the membrane potential and calcium mobilizing effects of these two peptides on cultured rat hypothalamic neurons.
Experimental Procedures
Male Sprague-Dawley rats, 7–8 weeks old, weighing 250–275 gm (Ace Animals Inc., Boyertown, PA) were used in immunohistochemical studies. Ca2+ or voltage measurements were conducted on dissociated hypothalamic neurons harvested from 1 to 3 days old rats, which were cultured for 5 days. Animal protocols were reviewed and approved by the Temple University Institutional Animal Care and Use Committee.
Immunohistochemistry
Rats anesthetized with urethane (1.2 g/kg, IP) were intracardially perfused with 0.1 M phosphate buffered saline (PBS) followed by 4% paraformaldehyde/0.2% picric acid in PBS. Brains were removed, postfixed for 2 hr, and stored in 30% sucrose/PBS solution overnight. Tissues were processed for neuronostatin immunoreactivity (irNST) or somatostatin immunoreactivity (irSST) by the avidin-biotin complex procedure (Brailoiu et al., 2007). The brain was embedded in agar and coronal sections of 40 µm were prepared with the use of a Vibratome. Tissues were first treated with 3% H2O2 to quench endogenous peroxidase, washed several times, blocked with 10% normal goat serum, and incubated in NST antiserum (1:1,000 dilution), a rabbit polyclonal raised against a conserved region of the human prepro-somatostatin 31–43 (31LeuArgGlnPheLeuGlnLysSerLeuAlaAlaAlaAla-amide43) (Phoenix Pharmaceuticals, Inc., Burlingame, CA). The NST antiserum, which exhibits 100% cross-reactivity with human NST, does not cross-react with somatostatin in radioimmunoassay (Phoenix Pharmaceuticals, Inc). After thorough rinsing, sections were incubated in biotinylated anti-rabbit IgG (1:200 dilution, Vector Laboratories, Burlingame, CA) for 2 hr, and rinsed with PBS and incubated in avidin-biotin complex solution for 1.5 hr (1:100 dilution, Vector Laboratories). Following several washes in Tris-buffered saline, sections were developed in 0.05% diaminobenzidine/ 0.001% H2O2 solution and washed for at least 2 hr with Tris-buffered saline. Sections were mounted on slides with 0.25% gel alcohol, air-dried, dehydrated with absolute alcohol followed by xylene, and coverslipped with Permount.
In the case of double-labeling experiments, the sequential labeling method with the primary antiserum from different hosts was used (Dun et al., 1994; Brailoiu et al., 2007). Hypothalamic sections were first incubated with NST antiserum (1: 350 dilution) and then with SST antiserum (1: 500 dilution, a rat polyclonal from Chemicon International, Inc., Temecula, CA). Sections were incubated with appropriate secondary antiserum conjugated to either fluorescein isothiocyanate (FITC) or Texas Red, and examined under a confocal scanning laser microscope (Leica TCS SP5) with excitation wavelengths set to 488 nm for FITC and 561 nm for Texas Red in the sequential mode.
For control experiments, hypothalamic sections were processed with NST antiserum pre-absorbed with human NST (1 µg/ml) or SST (1 µg/ml) overnight. In addition, sections were processed with SST antiserum pre-absorbed with SST (1 µg/ml) or NST (1 µg/ml).
Neuronal cell culture
Hypothalamic neurons were isolated from postnatal 1–3 days old rats by enzymatic digestion with papain (Brailoiu et al., 2007). Cells were plated at a density of 103/mm2 in a Neurobasal-A™ medium, supplemented with 10% fetal calf serum, 2 mM glutamine, 100 units/ml penicillin and 100 µg/ml streptomycin (Invitrogen, Carlsbad, CA), and maintained at 37°C in a humidified atmosphere with 5% CO2. Glial cell growth was inhibited by the mitotic inhibitor cytosine β-arabino furanoside (1 µM) (Sigma-Aldrich, St. Louis, MO). Neurons cultured for 5 days were transferred to a medium without fetal serum 12 h prior to Ca2+ measurements.
Cytosolic Ca2+ concentrations
Cytosolic Ca2+ measurements were performed as described previously (Brailoiu et al., 2006, 2007). Cells were incubated with 5 µM fura-2 AM (Molecular Probes, Eugene, OR) in Hanks' balanced salt solution (HBSS) at room temperature for 45 min in the dark, washed three times with dye-free buffer, and incubated for another 45 min to allow for complete de-esterification of the dye. Coverslips were subsequently mounted in a custom-designed bath on the stage of an Eclipse TE 2000-U Nikon inverted microscope equipped with a Roper Scientific CCD camera. Cells were routinely superfused with HBSS at a flow rate of 1 ml/min. Fura-2 fluorescence (emission = 510 nm), following alternate excitation at 340 nm and 380 nm, was acquired at a frequency of 0.33 Hz. Acquired images were analyzed offline using Metafluor software. For Ca2+- free experiments, HBSS without Ca2+ and supplemented with 2.5 mM EGTA was used.
Voltage measurements using DiBAC4(3)
Optical imaging using voltage sensor probes is a reliable approach in monitoring membrane potential changes in neurons (Ebner and Chen, 1995; Kunkler et al., 2005; Brailoiu et al., 2008). Briefly, hypothalamic cells were incubated for 30 min in HBSS containing 0.5 mM DiBAC4(3). The fluorescence (excitation wavelength = 480 nm, emission wavelength = 540 nm) was continuously recorded at a rate of 10 points min−1. Background values (windows of identical area placed beside the cells) were always subtracted. The dye partition between the cell membrane and the cytosol is a function of membrane potential. Depolarization of the membrane leads to a sequestration of the dye into cytosol and is associated with an increase in the fluorescence intensity; whereas, during membrane hyperpolarization the dye concentrates in the cell membrane, leading to a decrease of cytoplasmic fluorescence intensity (Brauner et al., 1984).
Calibration of DiBAC4(3)
Calibration of DiBAC4(3) fluorescence was performed using the Na+-K+ ionophore gramicidin in Na+-free physiological solution (Brauner et al., 1984; Brailoiu et al., 2008). The osmolarity was maintained constant by addition of N-methylglucamine. In the presence of gramicidin (1 µM), the Na+ concentration gradient is zero, and the membrane potential is approximately equal to K+ equilibrium potential which is determined by the Nernst equation. The intracellular K+ and Na+ concentrations were assumed to be 130 mM and 10 mM, respectively. The addition of gramicidin with various concentrations of K+ to the cultured neurons alters the cell membrane potential, thereby, altering fluorescence. According to the calibration measurements, changes in DiBAC4(3) fluorescence intensity by 1.092 are equivalent to a change in membrane potential of 1 mV.
Statistical analysis
In calcium and voltage measurement experiments, statistical significance between groups was tested with one-way ANOVA followed by Bonferroni test, p< 0.05 being considered significant.
Results
Somatostatin immunoreactivity
As reported earlier (Johansson et al., 1984; Vincent et al., 1985), somatostatin immunoreactive (irSST) neurons were noted in the lateral septum, nucleus accumbens, amygdaloid complex, hypothalamic periventricular nucleus, hippocampus, cortex, cerebellum and several brainstem nuclei. In all four rat brains examined, strongly labeled, small diameter irSST cells of different morphologies were detected throughout the cortex (Fig. 1A). Within the hippocampus, moderately to intensely labeled irSST cells were noted in the CA1, CA2 and CA3 areas, as well as, in the polymorphic layer of dentate gyrus (PoDG; Fig. 1B). Purkinje cells were strongly labeled (Fig. 1C), so were Golgi cells in the cerebellum. In the hypothalamus, neurons in the anterior periventricular nucleus (Pe) were strongly labeled (Fig. 1D and E); small diameter irSST cells were also noted in the suprachiasmatic nucleus (Sch) (Fig. 1D). In addition to irSST cells, numerous cell processes were noted in the median eminence, particularly the external layer (MEE). Labeled cells and fibers were scattered in the medial preoptic nucleus (MPO), the lateral septum, nucleus accumbens, amygdaloid complex, ventromedial hypothalamic areas, as well as, the arcuate nucleus (Arc).
Fig. 1.
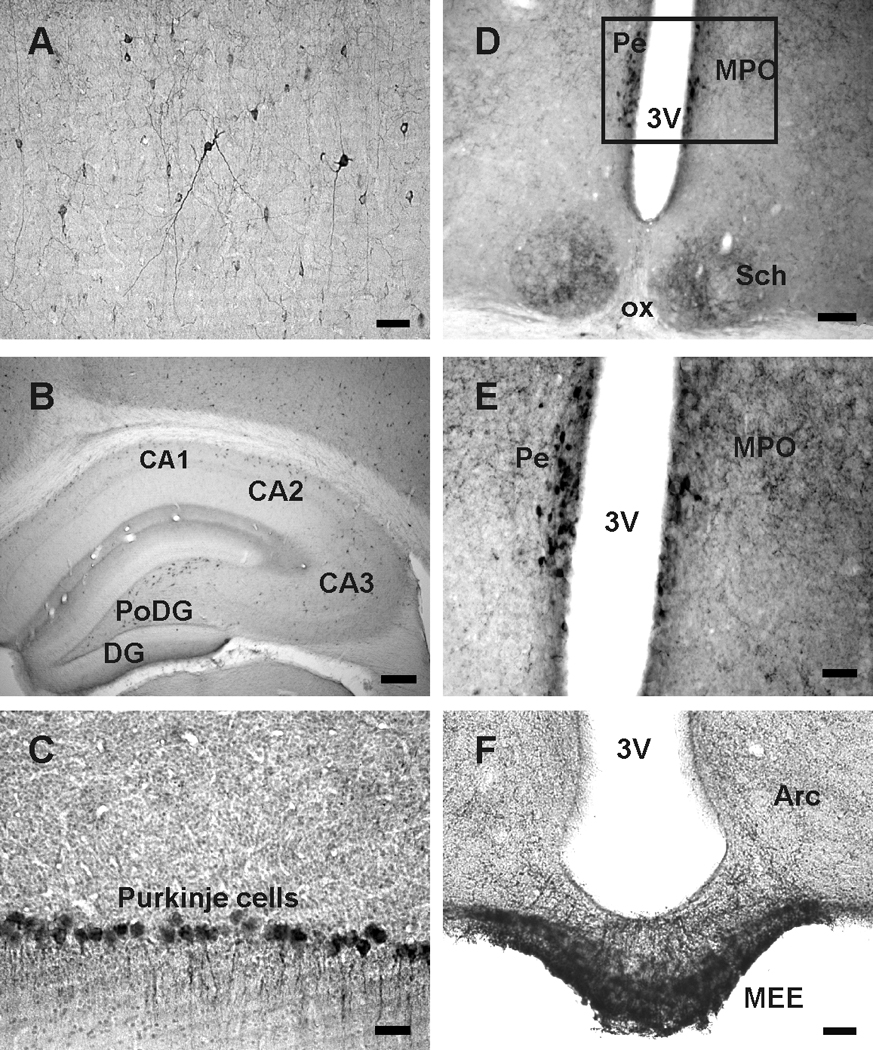
Somatostatin (SST) immunoreactive cells and fibers in the rat brain. A, irSST cells and cell processes in the motor cortex. B, irSST cells in CA1, CA2 and CA3 regions and polymorphic layer of the dentate gyrus (PoDG). C, Purkinje cells of the cerebellum are irSST. D, irSST cells are concentrated in the periventricular hypothalamic nucleus (Pe) adjacent to the 3rd ventricle (3V); irSST-cells and processes are also present in the suprachiasmatic nucleus (Sch). E, enlargement of the area outlined in D where strongly labeled irSST cells are located in Pe, and fibers in medial preoptic nucleus (MPO). F, strongly labeled irSST fibers are present in median eminence, particularly the external median eminence (MEE), and in arcuate nucleus (Arc). Abbreviations: ox, optic chiasm. Calibration bar: A, C, E and F: 50 µm; B: 250 µm; D: 100 µm.
Neuronostatin immunoreactivity
Examination of the rat brains (n=6) revealed that irNST was conspicuously present mainly in two areas: the hypothalamic periventricular nucleus (Pe) (Fig. 2A and B) and median eminence (ME) (Fig. 2C). The number and intensity of irNST cells in the Pe was comparable to that of irSST cells in the same area (Fig. 2A and B; compare with Fig. 1D and E), so were cell processes in the ME (Fig. 2C; compare with Fig. 1F). In other regions of the rat brain including the suprachiasmatic nucleus, cortex and hippocampus; the number of irNST cells appeared to be fewer and less intensely labeled than that of irSST cells (Fig. 2C, D and E). The result shows, with the exception of periventricular nucleus, a less abundant expression of irNST as compared to that of irSST in the rat brain.
Fig. 2.
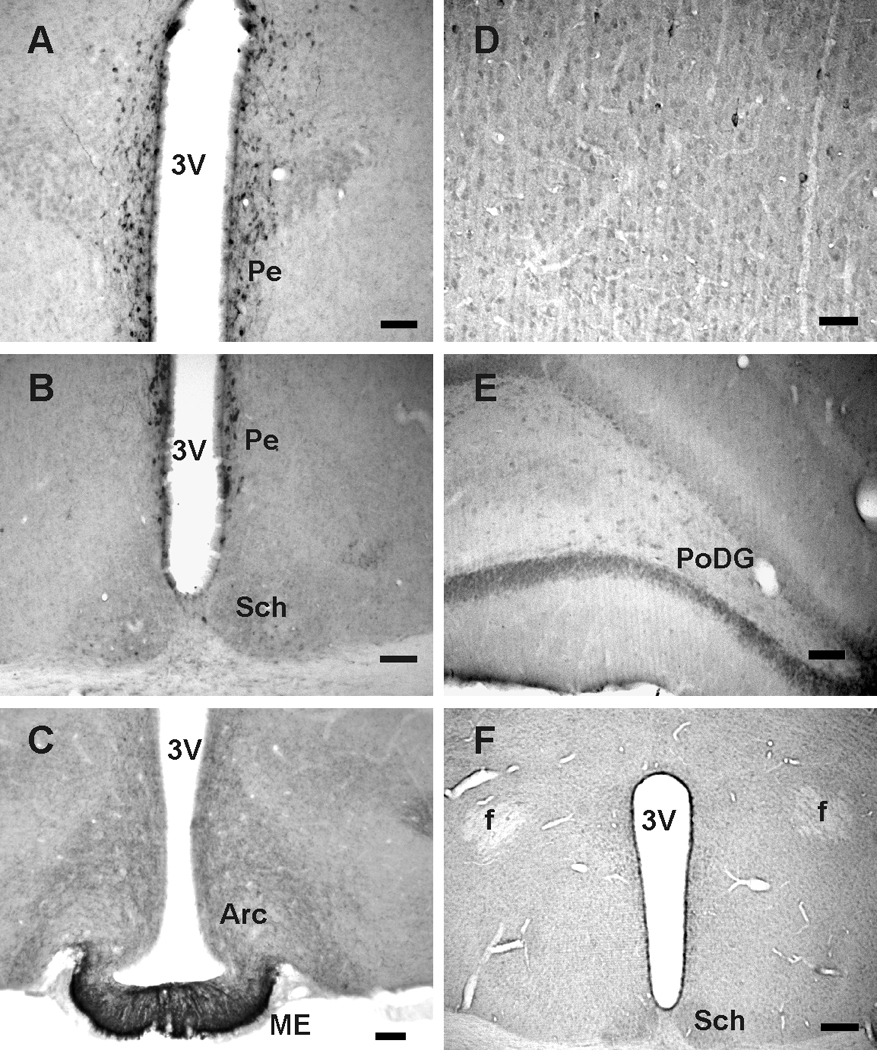
Neuronostatin (NST) immunoreactive cells and processes in the rat brain. A, irNST cells are concentrated in the hypothalamic periventricular nucleus (Pe). B, strongly labeled irNST cells are distributed to the periventricular nucleus, and a few lightly to moderately labeled cells and processes in the suprachiasmatic nucleus (Sch). C, numerous irNST fibers are present in the median eminence (ME) and arcuate nucleus (Arc). D, fewer or less intensely labeled irNST cells are detectable in the motor cortex. E, moderately labeled cells are seen in the polymorphic layer of the dentate gyrus (PoDG). F, irNST is not detected in a hypothalamic section processed with an NST antiserum pre-absorbed with the peptide NST (1 µg/ml) overnight. Abbreviations: 3V, 3rd ventricle; f, fornix. Calibration bar: A to C, E, 50 µm; D: 25 µm; F: 100 µm.
Control experiments
The specificity of NST antiserum and SST antiserum was evaluated by processing hypothalamic sections with an antiserum pre-absorbed with either NST (1 µg/ml) or SST (1 µg/ml). In all three brains tested, hypothalamic sections processed with NST antiserum pre-absorbed with NST amide peptide showed no positive labeling in the hypothalamic periventricular nucleus and suprachiasmatic nucleus (Fig. 2F); whereas, immunoreactivity could be detected in the hypothalamic periventricular nucleus processed with NST antiserum pre-absorbed with NST free acid peptide or SST. Conversely, positively-labeled cells or cell processes were not detected in hypothalamic sections processed with SST antiserum pre-absorbed with SST peptide (1 µg/ml), but not with NST peptide. These results demonstrate that NST antiserum was specific against NST amide peptide and that SST antiserum specific against SST.
Double-labeling experiments
Hypothalamic sections double-labeled with NST antiserum and SST antiserum revealed that irNST cells in the hypothalamic periventricular nucleus express irSST and vice versa (Fig. 3A–F). In the median eminence, there was extensive overlap of irNST and irSST fibers (Fig. 3G–I). In most of the cortical areas sampled, there was extensive overlapping of irNST and isSST neurons (Fig. 3 J–L). The intensity of irNST appeared to be less than that of irSST in some of the cortical neurons (Fig. 3J–L).
Fig. 3.
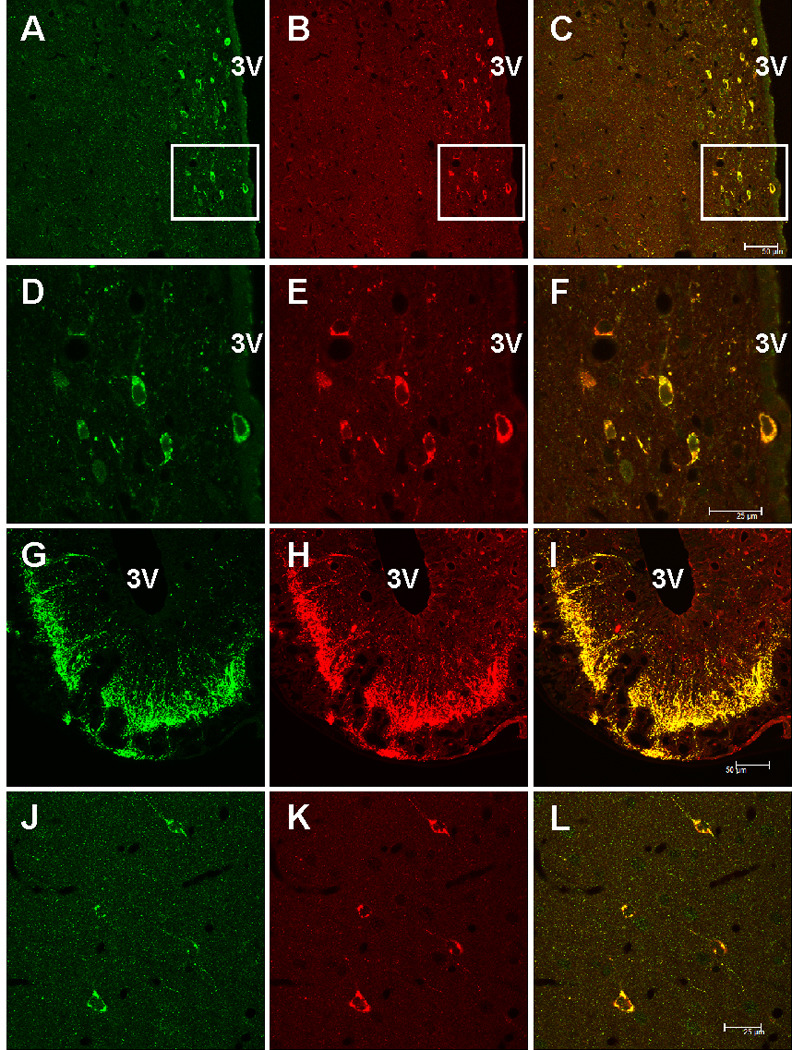
Confocal images of rat brain sections double-labeled with neuronostatin (NST, green fluorescence) and somatostatin (SST, red fluorescence) antiserum. A and B, hypothalamic periventricular cells located next to the 3rd ventricle (3V) are immunoreactive to NST and SST. C, a merged image of A and B, where cells immunoreactive to both NST and SST appear orange. D–E, higher magnification of the area outlined in A–C, where nearly all of the cells are irNST and irSST. F, a merged image of D and E, where overlapping cells appear orange color. G–I, dense fibers immunoreactive to NST and SST are seen in the median eminence, mostly in the external layer. J and K, all 4 cortical neurons in the cerebral cortex are double-labeled, but the intensity of irNST appears to be lower than that of irSS. L, a merged image of J and K. Calibration bar: A–C, and G–I, 50 µm; D–F and J–L, 25 µm.
Intracellular calcium concentrations in hypothalamic neurons
The neuronal activity of NST and SST was assessed by monitoring changes in intracellular calcium concentrations [Ca2+]i or membrane potentials in cultured hypothalamic neurons. Initial studies showed that NST amide was active; whereas, NST free acid was devoid of calcium mobilizing effects on hypothalamic neurons. Consequently, NST amide, referred to throughout the text as NST, was used in this study.
The basal [Ca2+]i of dissociated rat hypothalamic neurons was 57 ± 5.8 nM (n = 539 cells), which is close to the value reported in earlier studies (Connor, 1986; Brailoiu et al., 2007). When superfused to cultured hypothalamic neurons, NST (100 nM) produced two patterns of Ca2+ responses. In Ca2+-containing saline, NST (100 nM) induced a fast and transitory increase in [Ca2+]i, with an average of 512 ± 4.3 nM in 14 of 194 hypothalamic neurons tested (solid line, Fig. 4A1). In other 37 cells, NST induced an oscillatory response. The first peak corresponded to an increase in [Ca2+]i of 396 ± 3.4 nM; a representative response (dotted line) is shown in Fig. 4A. 1NST (10 and 1000 nM) also produced two types of Ca2+ responses: i) single spike with a mean amplitude of 93 ± 2.7 nM (n=11) and 739 ± 5.6 nM (n=21), and ii) oscillations with a mean amplitude of the first peak of 71 ± 2.9 nM (n=19) and 488 ± 4.7 nM (n=35) (Fig. 4C). The increase was statistically significant (P < 0.01) compared to the basal [Ca2+]i. In contrast, SST (100 nM) slightly reduced the basal Ca2+ by 23 ± 1.7 nM in 21 of 61 cells tested (Fig. 4B1).
Fig. 4.
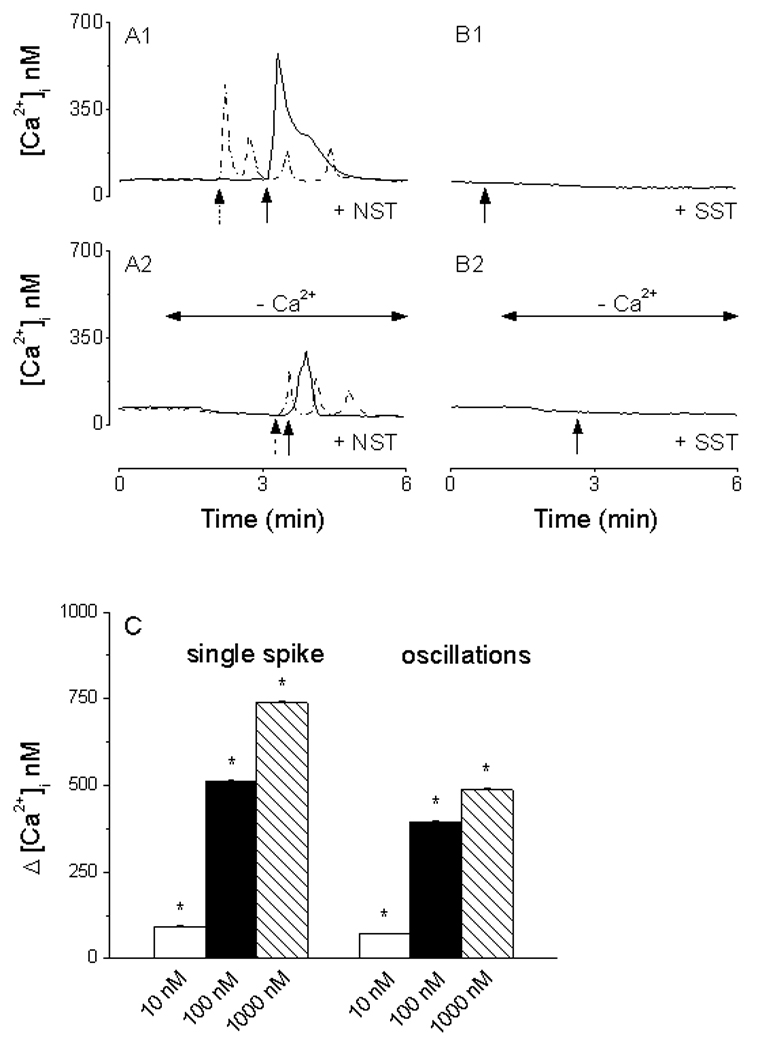
Calcium responses induced by neuronostatin (NST) and somatostatin (SST) in cultured rat hypothalamic neurons. A1, NST increases cytosolic calcium [Ca2+]i with two profiles: fast and transitory (solid line) and calcium oscillations (dotted line). B1, SST slightly reduced the basal Ca2+. A2, in Ca2+-free saline, NST produced a fast and transitory (solid line) or an oscillatory response (dotted line), with amplitude lower than those produced in Ca2+-containing saline. B2, no change in [Ca2+]i was noted in response to SST in Ca2+-free saline. C, NST (10, 100 and 1000 nM) produced a concentration-dependent increase in [Ca2+]i with two profiles: single spike and oscillations. Arrows denote the administration of neuronostatin or somatostatin.
In a Ca2+-free saline supplemented with 2.5 mM EGTA, NST (100 nM) also elicited two types of responses. In 13 cells from 237 tested, NST produced a single, transitory increase in [Ca2+]i by 256 ± 2.7 nM (solid line, Fig. 4A2). In the other 32 cells, NST (100 nM) initiated Ca2+ oscillations. The peak of the first Ca2+ wave was 78 ± 2.3 nM above the basal; a representative trace (dotted line) is shown in Fig. 4A2. On the other hand, administration of SST in Ca2+-free saline caused no appreciable changes in [Ca2+]i in any of the 53 cells tested (Fig. 4B2).
Membrane potential changes
The mean resting membrane potential of cultured hypothalamic neurons as monitored by changes in DiBAC4(3) fluorescence was −48 ± 3.7 mV (n = 371), which was comparable to that recorded by electrophysiological techniques (Stern, 2001). In 23 out of 257 cells tested, NST (100 nM) produced a depolarization with a mean amplitude of 5.2 ± 1.6 mV (solid line; Fig. 5A). In the other 7 cells, NST (100 nM) induced a hyperpolarization of 6.1 ± 2.2 mV (dotted line; Fig. 5A).
Fig. 5.

Changes in resting membrane potential induced by neuronostatin (NST) and somatostatin (SST) in rat hypothalamic neurons. A, examples of NST-induced depolarization (solid line) and hyperpolarization (dotted line); NST depolarized 23/257 neurons with a mean amplitude of 5.2 ± 1.6 mV and hyperpolarized 7/257 neurons with a mean amplitude of 6.1 ± 2.2 mV. B, example of SST-induced hyperpolarization; SST hyperpolarized 43/114 neurons, with a mean amplitude of 9.8 ± 2.2 mV. Arrows denote the administration of neuronostatin or somatostatin.
In 114 cells tested, administration of SST (100 nM) induced a hyperpolarization of 9.8 ± 2.2 mV in 43 cells; a representative trace (dotted line) is shown in Fig. 5B.
Discussion
Post-translational processing of prepro-somatostatin results in the formation of somatostatin-28 (SS28), which is cleaved to yield two mature peptides somatostatin, also known as somatostatin-14, and somatostatin1-12 (SS1-12) (Benoit et al., 1982, 1984; Goodman et al., 1983; Zingg and Patel, 1983; White et al., 1985). The neural activity of SS1-12 appears to differ from that of the other two peptides. For example, SS28 and SST hyperpolarize CA1 pyramidal neurons in vitro; whereas, a membrane response is not elicited by SS1-12 (Watson and Pittman, 1988). Recently, Samson et al. (2008) reported the isolation and identification from porcine tissues a non cyclic, 13-amino acid amidated peptide, named neuronostatin (NST), which is derived from the N-terminus of pro-somatostatin. The NST antiserum and SST antiserum used in our study appear to be specifically directed against neuronostatin and somatostatin, as hypothalamic sections processed with NST antiserum pre-absorbed with NST, but not with SST, show no labeling and vice versa. NST is found to be bioactive in a variety of tissues tested including gastrointestinal tract, hippocampus, cerebellum and hypothalamus (Samson et al., 2008).
Our immunohistochemical studies show for the first time that the expression profile of irNST and irSST is similar in the hypothalamus; i.e., strongly labeled irNST and irSST neurons are noted in the hypothalamic periventricular nucleus, as well as numerous cell processes in the median eminence. Ishikawa et al. (1987) showed by a combination of retrograde labeling with horseradish peroxidase and immunostaining of somatostatin cells that irSST neurons in the rostral parts of the periventricular nucleus project their axons to the median eminence. Our observation that numerous irNST cell processes traverse the median eminence is consistent with the idea that they arise from cell bodies in the periventricular nucleus. In other areas of the rat brain such as the suprachiasmatic nucleus, cortex and hippocampus, irNST appears to be less abundantly expressed as compared to that of irSST. In spite of considerable efforts, for example, irNST sections were processed side by side with irSST sections, rendering variability of immunostaining a less likely contributing factor, it is recognized immunofluoresence labeling is less than quantitative.
Using radioimmunoassay (RIA), a lower expressional level of NST as compared to that of SST has been noted in the initial study by Samson et al. (2008). The ratio of NST over SST in different brain regions, with the exception of cerebrum, was found to be less than 0.05. For example, the hypothalamus, hippocampus, cerebellum and pons show a ratio of 0.05, 0.02, 0.05 and 0.01, respectively; the ratio is 0.91 for the cerebrum (Samson et al., 2008). Hence, our immunohistochemical result seems to be in general agreement with their quantitative assay in that fewer or less intensely labeled irNST cells are observed in the hippocampus, cerebrum, cerebellum and cortex. There is an apparent discrepancy between immunohistochemical detection and RIA relative to the expression of NST and SST in the hypothalamus. Our immunostaining, while non-quantitative, shows that the number and/or intensity of irNST cells appear to be comparable to that of irSST cells in the periventricular nucleus. A possible explanation is that in our study comparison was made only with respect to the hypothalamic periventricular nucleus; whereas, the radioimmunoassay measured the entire hypothalamic area, which may express few irNST cells in hypothalamic areas outside of the periventricular nucleus. Neuronostatin is a non-cyclic, amidated peptide, and somatostatin is not, the presence or absence of amidation enzymes or degrading enzymes may dictate the level of neuronostatin and somatostatin expression in different populations of neuron (Samson et al., 2008).
In the rat brain, other neuroactive substances have been identified in SST-containing neurons; for example, irSST is expressed in some of the cholecystokinin- (Somogyi et al., 1984) or avian pancreatic polypeptide- (Vincent et al., 1982) containing neurons. Further, irSST is frequently co-expressed with δ-aminobutyric acid and/or nitric oxide synthase in central neurons (Sloviter and Nilaver, 1987; Dun et al., 1994). Whether or not NST-containing neurons in the hypothalamic periventricular nucleus may represent a heterogeneous population of neurons as in the case of SST-expressing neurons remains to be studied.
Several earlier studies show that SST, SS28 and SS1-12 are released from neural and non neural tissues in response to appropriate stimuli in a calcium-dependent manner (Iversen et al., 1978; Bennett et al., 1979; Kewley et al., 1981; Bakhit et al., 1983; Sheward et al., 1984). Whether or not NST is secreted from neurons and non neural cells in a calcium-dependent manner remains to be investigated. Using the early oncogene c-fos expression as a biomarker for cell activation, NST is found to be active in multiple sites, including cells of the gastrointestinal tract, anterior pituitary, cerebellum, and hippocampus in vivo. NST by intracerebroventricular injections increases blood pressure but decreases food and water intake (Samson et al., 2008). NST appears to exert its biological effects by interacting with receptors/binding sites that are different from those interacting with SST. For example, SST, but not NST, was effective in stimulating the inhibitory G protein pathway in HEK 293T cells co-transfected with plasmids encoding a chimeric Gqi protein, the serum responsive element-luciferase reporter construct, and individual somatostatin receptors, indicating that NST does not interact with the five known somatostatin receptors (Samson et al., 2008).
Our functional studies of NST on cultured hypothalamic neurons revealed that the amidated NST, but not the free acid, is biologically active, suggesting that the naturally occurring form is an amidated peptide. The biological activity of NST or SST were evaluated in cultured hypothalamic neurons by means of the calcium and voltage imaging techniques, which offer the advantage of being able to assay the activity of many cells in one experiment as compared to several cells by the whole-cell recording technique. A potential drawback is that the identity of neurons being studied is not known. Results obtained here are consistent with the contention that NST and SST interact with pharmacologically distinct sites on hypothalamic neurons (Samson et al., 2008). Five types of receptor for somatostatin, SSTR1-SSTR5, have previously been reported in several brain regions, including the hypothalamus (Beaudet et al., 1995; Kumar, 2007; Patel and Srikant, 1997). Somatostatin has been reported to decrease [Ca2+]i by inhibiting Ca2+ influx (Lussier et al., 1991) through T- and L-type channels (Chen et al., 1990) in somatotrophs cells. In agreement with the previous reports, our results show that SST decreased basal [Ca2+]i in cultured rat hypothalamic neurons. In contrast, NST in equi-molar concentrations increased [Ca2+]i in hypothalamic neurons with two distinct profiles: a transitory rise and an oscillatory increase of [Ca2+]i. Similar to other cells, neurons utilize both Ca2+ influx through plasmalemmal Ca2+ channels and Ca2+ release from internal stores (Berridge, 1998). NST-induced [Ca2+]i were reduced in Ca2+-free saline, suggesting NST activates Ca2+ entry through plasmalemmal Ca2+ channels as well as Ca2+ release from internal stores. Previous reports indicate that in the pituitary gland Ca2+ oscillations are associated with growth hormone secretion (Holl et al., 1988; Lussier et al., 1991). The observation that NST was unable to alter the basal or hormone-stimulated growth hormone secretion by cultured anterior pituitary cells (Samson et al., 2008), suggests that the oscillatory Ca2+ response evoked by NST may regulate activity other than growth hormone homeostasis in pituitary cells.
Using the voltage sensitive dye as an indicator, hypothalamic neurons responded to NST with two opposing membrane potential changes: a depolarization and a hyperpolarization in 9% and 3% of hypothalamic neurons tested. This is in general agreement with the report in which NST elicits a hyperpolarization or depolarization in 31% and 42% of electrophysiologically identified hypothalamic paraventricular neurons (Samson et al., 2008). The number of cells responsive to NST, irrespective of hyperpolarization or depolarization, is significantly fewer in our study as compared to that reported in an earlier study (Samson et al., 2008). A plausible explanation is that NST binding sites/receptors may be highly localized to hypothalamic paraventricular neurons, which can be electrophysiologically identified in a slice preparation (Samson et al., 2008). In our case, recordings were randomly made from unidentified hypothalamic neurons in culture, most of which may not be endowed with NST receptors/ binding sites.
Transient elevation of cytosolic calcium concentrations [Ca2+]i serves as second messenger signals controlling several neuronal functions from development to apoptosis (Augustine et al., 2003). The physiological role of NST in the neural and non neural cells is largely not known. The finding that NST and SST elicit different Ca2+ mobilizing responses in hypothalamic neurons suggests that these two peptides, though derived from the same precursor, may produce different biological activity in their target cells.
Acknowledgements
This study was supported in part by NIH Grants NS18710 and HL51314 from the Department of Health and Human Services. Neuronostatin antiserum and peptides were a gift from Phoenix Pharmaceuticals, Inc.
Abbreviations
- Arc
arcuate nucleus
- [Ca2+]i
intracellular calcium concentration
- DiBAC4(3)
bis-(1,3-dibutylbarbituric acid) trimethine oxonol
- HBBS
Hanks' balanced salt solution
- MPO
medial preoptic nucleus
- ME
median eminence
- NST
neuronostatin
- irNST
neuronostatin immunoreactivity
- Pe
periventricular nucleus
- PBS
phosphate buffered saline
- PoDG
polymorphic layer of dentate gyrus
- Sch
suprachiasmatic nucleus
- SST
somatostatin
- irSST
somatostatin immunoreactivity
Footnotes
Publisher's Disclaimer: This is a PDF file of an unedited manuscript that has been accepted for publication. As a service to our customers we are providing this early version of the manuscript. The manuscript will undergo copyediting, typesetting, and review of the resulting proof before it is published in its final citable form. Please note that during the production process errors may be discovered which could affect the content, and all legal disclaimers that apply to the journal pertain.
Disclosure Statement: J.Y. and J.K.C. are employed by Phoenix Pharmaceuticals, Inc., which produces and markets neuronostatin and neuronostatin antiserum used in this study. No other author has any financial relationship with the company.
References
- Augustine GJ, Santamaria F, Tanaka K. Local calcium signaling in neurons. Neuron. 2003;40:331–346. doi: 10.1016/s0896-6273(03)00639-1. [DOI] [PubMed] [Google Scholar]
- Bakhit C, Benoit R, Bloom FE. Release of somatostatin-28(1-12) from rat hypothalamus in vitro. Nature. 1983;301:524–526. doi: 10.1038/301524a0. [DOI] [PubMed] [Google Scholar]
- Beaudet A, Greenspun D, Raelson J, Tannenbaum GS. Patterns of expression of SSTR1 and SSTR2 somatostatin receptor subtypes in the hypothalamus of the adult rat: relationship to neuroendocrine function. Neurosci. 1995;65:551–561. doi: 10.1016/0306-4522(94)00486-o. [DOI] [PubMed] [Google Scholar]
- Bennett GW, Edwardson JA, deCotte DM. Release of somatostatin from rat brain synaptosomes. J Neurochem. 1979;32:1127–1130. doi: 10.1111/j.1471-4159.1979.tb04606.x. [DOI] [PubMed] [Google Scholar]
- Benoit R, Bohlen P, Esch F, Ling N. Neuropeptides derived from prosomatostatin that do not contain the somatostatin-14 sequence. Brain Res. 1984;311:23–29. doi: 10.1016/0006-8993(84)91394-5. [DOI] [PubMed] [Google Scholar]
- Benoit R, Ling N, Bakhit C, Morrison JH, Alford B, Guillemin R. Somatostatin-28(1-12)-like immunoreactivity in the rat. Endocrinol. 1982;111:2149–2151. doi: 10.1210/endo-111-6-2149. [DOI] [PubMed] [Google Scholar]
- Berridge MJ. Neuronal calcium signaling. Neuron. 1998;21:13–26. doi: 10.1016/s0896-6273(00)80510-3. [DOI] [PubMed] [Google Scholar]
- Brailoiu E, Churamani D, Pandey V, Brailoiu GC, Tuluc F, Patel S, Dun NJ. Messenger-specific role for nicotinic acid adenine dinucleotide phosphate in neuronal differentiation. J Biol Chem. 2006;281:15923–15928. doi: 10.1074/jbc.M602249200. [DOI] [PubMed] [Google Scholar]
- Brailoiu GC, Brailoiu E, Chang JK, Dun NJ. Excitatory effects of HIV-1 Tat on cultured rat cerebral cortical neurons. Neurosci. 2008;151:701–710. doi: 10.1016/j.neuroscience.2007.11.031. [DOI] [PMC free article] [PubMed] [Google Scholar]
- Brailoiu GC, Dun SL, Brailoiu E, Inan S, Yang J, Chang JK, Dun NJ. Nesfatin-1: distribution and interaction with a G-protein coupled receptor in the rat brain. Endocrinol. 2007;148:5088–5094. doi: 10.1210/en.2007-0701. [DOI] [PubMed] [Google Scholar]
- Brauner T, Hulser DF, Strasse RJ. Comparative measurements of membrane potentials with microelectrodes and voltage-sensitive dyes. Biochm Biophys Acta. 1984;771:208–216. doi: 10.1016/0005-2736(84)90535-2. [DOI] [PubMed] [Google Scholar]
- Brazeau P, Vale W, Burgus R, Ling N, Butcher M, Rivier J, Guillemin R. Hypothalamic polypeptide that inhibits the secretion of immunoreactive pituitary growth hormone. Science. 1973;179:77–79. doi: 10.1126/science.179.4068.77. [DOI] [PubMed] [Google Scholar]
- Chen C, Zhang J, Vincent JD, Israel JM. Two types of voltage-dependent calcium current in rat somatotrophs are reduced by somatostatin. J Physiol. 1990;425:29–42. doi: 10.1113/jphysiol.1990.sp018090. [DOI] [PMC free article] [PubMed] [Google Scholar]
- Connor JA. Digital imaging of free calcium changes and of spatial gradients in growing processes in single, mammalian central nervous system cells. Proc Natl Acad Sci USA. 1986;83:6179–6183. doi: 10.1073/pnas.83.16.6179. [DOI] [PMC free article] [PubMed] [Google Scholar]
- Dun NJ, Dun SL, Wong RKS, Förstermann U. Colocalization of nitric oxide synthase and somatostatin immunoreactivity in rat dentate hilar neurons. Proc Natl Acad Sci USA. 1994;91:2955–2959. doi: 10.1073/pnas.91.8.2955. [DOI] [PMC free article] [PubMed] [Google Scholar]
- Ebner TJ, Chen G. Use of voltage-sensitive dyes and optical recordings in the central nervous system. Prog Neurobiol. 1995;46:463–506. doi: 10.1016/0301-0082(95)00010-s. [DOI] [PubMed] [Google Scholar]
- Goodman RH, Aron DC, Roos BA. Rat pre-prosomatostatin: structure and processing by microsomal membranes. J Biol Chem. 1983;258:5570–5573. [PubMed] [Google Scholar]
- Holl RW, Thorner MO, Mandell GL, Sullivan JA, Sinha YN, Leong DA. Spontaneous oscillations of intracellular calcium and growth hormone secretion. J Biol Chem. 1988;263:9682–9685. [PubMed] [Google Scholar]
- Ishikawa K, Taniguchi Y, Kurosumi K, Suzuki M, Shinoda M. Immunohistochemical identification of somatostatin-containing neurons projecting to the median eminence of the rat. Endocrinol. 1987;121:94–97. doi: 10.1210/endo-121-1-94. [DOI] [PubMed] [Google Scholar]
- Iversen LL, Iversen SD, Bloom F, Douglas C, Brown M, Vale W. Calcium-dependent release of somatostatin and neurotensin from rat brain in vitro. Nature. 1978;273:161–163. doi: 10.1038/273161a0. [DOI] [PubMed] [Google Scholar]
- Johansson O, Hökfelt T, Elde RP. Immunohistochemical distribution of somatostatin-like immunoreactivity in the central nervous system of the adult rat. Neurosci. 1984;13:265–339. doi: 10.1016/0306-4522(84)90233-1. [DOI] [PubMed] [Google Scholar]
- Kewley CF, Millar RP, Berman MC, Schally AV. Depolarization- and ionophore-induced release of octacosa somatostatin from stalk median eminence synaptosomes. Science. 1981;213:913–915. doi: 10.1126/science.6114560. [DOI] [PubMed] [Google Scholar]
- Kumar U. Colocalization of somatostatin receptor subtypes (SSTR1-5) with somatostatin, NADPH-diaphorase (NADPH-d), and tyrosine hydroxylase in the rat hypothalamus. J Comp Neurol. 2007;504:185–205. doi: 10.1002/cne.21444. [DOI] [PubMed] [Google Scholar]
- Kunkler PE, Hulse RE, Schmitt MW, Nicholson C, Kraig RP. Optical current source density analysis in hippocampal organotypic culture shows that spreading depression occurs with uniquely reversing currents. J Neurosci. 2005;25:3952–3961. doi: 10.1523/JNEUROSCI.0491-05.2005. [DOI] [PMC free article] [PubMed] [Google Scholar]
- Lussier BT, Wood DA, French MB, Moor BC, Kraicer J. Free intracellular Ca2+ concentration ([Ca2+]i) and growth hormone release from purified rat somatotrophs. II. Somatostatin lowers [Ca2+]i by inhibiting Ca2+ influx. Endocrinol. 1991;128:583–591. doi: 10.1210/endo-128-1-583. [DOI] [PubMed] [Google Scholar]
- Morrison JH, Benoit R, Magistretti PJ, Bloom FE. Immunohistochemical distribution of pro-somatostatin-related peptides in cerebral cortex. Brain Res. 1983;262:344–351. doi: 10.1016/0006-8993(83)91031-4. [DOI] [PubMed] [Google Scholar]
- Morrison JH, Benoit R, Magistretti PJ, Ling N, Bloom FE. Immunohistochemical distribution of pro-somatostatin-related peptides in hippocampus. Neurosci Lett. 1982;34:137–142. doi: 10.1016/0304-3940(82)90165-3. [DOI] [PubMed] [Google Scholar]
- Patel YC, Srikant CB. Somatostatin receptors. Trends Endocrinol Metab. 1997;8:398–405. doi: 10.1016/s1043-2760(97)00168-9. [DOI] [PubMed] [Google Scholar]
- Samson WK, Zhang JV, Avsian-Kretchmer O, Cui K, Yosten GLC, Klein C, Lyu RM, Wang YX, Chen XQ, Yang J, Price CJ, Hoyda TD, Ferguson AV, Yuan XB, Chang JK, Hsueh AJW. Neuronostatin encoded by somatostatin gene regulates neuronal, cardiovascular, and metabolic functions. J Biol Chem. 2008;283:31949–31959. doi: 10.1074/jbc.M804784200. [DOI] [PMC free article] [PubMed] [Google Scholar]
- Shen LP, Rutter WJ. Sequence of the human somatostatin I gene. Science. 1984;224:168–171. doi: 10.1126/science.6142531. [DOI] [PubMed] [Google Scholar]
- Sheward WJ, Benoit R, Fink G. Somatostatin-28(1-12)-like immunoreactive substance is secreted into hypophysial portal vessel blood in the rat. Neuroendocrinol. 1984;38:88–90. doi: 10.1159/000123871. [DOI] [PubMed] [Google Scholar]
- Sloviter RS, Nilaver G. Immunocytochemical localization of GABA-, cholecystokinin-, vasoactive intestinal polypeptide-, and somatostatin-like immunoreactivity in the area dentata and hippocampus of the rat. J Comp Neurol. 1987;256:42–60. doi: 10.1002/cne.902560105. [DOI] [PubMed] [Google Scholar]
- Somogyi P, Hodgson AJ, Smith AD, Nunzi MG, Gorio A, Wu JY. Different populations of GABAergic neurons in the visual cortex and hippocampus of cat contain somatostatin- or cholecystokinin-immunoreactive material. J Neurosci. 1984;4:2590–2603. doi: 10.1523/JNEUROSCI.04-10-02590.1984. [DOI] [PMC free article] [PubMed] [Google Scholar]
- Stern JE. Electrophysiological and morphological properties of pre-autonomic neurones in the rat hypothalamic paraventricular nucleus. J Physiol. 2001;537:161–177. doi: 10.1111/j.1469-7793.2001.0161k.x. [DOI] [PMC free article] [PubMed] [Google Scholar]
- Vincent SR, McIntosh CH, Buchan AM, Brown JC. Central somatostatin systems revealed with monoclonal antibodies. J Comp Neurol. 1985;238:169–186. doi: 10.1002/cne.902380205. [DOI] [PubMed] [Google Scholar]
- Vincent SR, Skirboll L, Hökfelt T, Johansson O, Lunderg JM, Elde RP, Terenius L, Kimmel J. Coexistence of somatostatin and avian pancreatic polypeptide (APP)-like immunoreactivity in some forebrain neurons. Neurosci. 1982;7:439–446. doi: 10.1016/0306-4522(82)90278-0. [DOI] [PubMed] [Google Scholar]
- Watson TWJ, Pittman QJ. Somatostatin (14) and (28) but not somatostatin (1-12) hyperpolarize CA1 pyramidal neurons in vitro. Brain Res. 1988;448:40–45. doi: 10.1016/0006-8993(88)91099-2. [DOI] [PubMed] [Google Scholar]
- White JD, Stewart KD, Krause JE, McKelvy JF. Biochemistry of peptide-secreting neurons. Physiol Rev. 1985;65:553–606. doi: 10.1152/physrev.1985.65.3.553. [DOI] [PubMed] [Google Scholar]
- Zingg HH, Patel YC. Processing of somatostatin-28 to somatostatin-14 by rat hypothalamic synaptosomal membranes. Life Sci. 1983;33:1241–1247. doi: 10.1016/0024-3205(83)90004-8. [DOI] [PubMed] [Google Scholar]