

Abstract
Water is a highly polar molecule-- consisting of a very electronegative atom, oxygen, bonded to two weakly electropositive hydrogen atoms-- with two lone pairs of electrons. These features give water remarkable physical properties, some of which are anomalous, such as its lower density in the solid phase compared to the liquid phase. Its ability to serve both as a hydrogen bond donor and acceptor governs its role as a solvent, a role which is of central interest for biological chemists.
In this Account, we focus on water’s properties as a solvent. Water dissolves a vast range of solutes with solubilities that range over 10 orders of magnitude. Differences in solubility define the fundamental dichotomy between polar, or hydrophilic, solutes and apolar, or hydrophobic, solutes. This important distinction plays a large part in the structure, stability, and function of biological macromolecules. The strength of hydrogen bonding depends on H-O..O H-bond angle, and the angular distribution is bimodal. Changes in the width and frequency of infrared spectral lines and in the heat capacity of the solution provide a measure of the changes in the strength and distribution of angles of the hydrogen bonds. Polar solutes and inorganic ions increase the population of bent hydrogen bonds at expense of the more linear population, while apolar solutes or groups have the opposite effect.
We examine how protein denaturants might alter the solvation behavior of water. Urea has very little effect on water’s hydrogen bond network, while guanidinium ions promote more linear hydrogen bonds. These results point to fundamental differences in the protein denaturation mechanisms of these molecules. We also suggest a mechanism of action for antifreeze (or thermal hysteresis) proteins: ordering of water around the surface of these proteins prior to freezing appears to interfere with ice formation.
INTRODUCTION
The study of water has had a long history, starting in the first millenium BCE with Thales of Miletus’ statement that “the principle of all things is water”. Water has remarkable physical properties, some of which are anomalous. Many of these anomalies occur at conditions far from standard T, P, and thus are of interest mostly for physical chemists. For biologists a major concern is the properties of water as a solvent, as structure and function of biological macromolecules depend upon liquid water. Both OH-O distances and angles contribute to H-bonding strength, however changes in H-bond angle distribution provide a quantitative explanation of the positive and negative hydration heat capacity (Cp) of, respectively, apolar and polar solutes/protein groups. Experimentally, changes in H-bonding are inferred from the OH stretch frequency of infrared - lowering as H-bonding strength increases. How water changes in various biological milieus - i.e. the presence of salt, cryoprotectants, denaturants and protein surface - is the subject of this review.
The water molecule
Water consists of highly electronegative oxygen atom bonded to two weakly electropositive hydrogen atoms. This results in a highly polar molecule which can donate H-bonds through the positively charged H atoms, accept H-bonds through the negatively charged O atom, and more generally make strong electrostatic interactions. From a structural perspective, a key advance was the determination of the structure of Ice Ih, Figure 1a.1 Ice 1h is the form found at moderate temperature and pressure, and it is the familiar form of ice. Bragg’s work revealed the now famous tetrahedral ice lattice structure. Each water molecule has four hydrogen bonded first neighbors at a distance of 2.75Å, two as H-bond donor, two as H-bond acceptor. The four neighbors are placed at the vertices of a tetrahedron, with mutual separations of 4.5Å. Ice 1h is a very open structure with a high degree of radial and angular ordering that has played a large part in our thinking about liquid water, as the latter’s structure is still not fully characterized. Since there are two hydrogen atoms per molecule, it seems intuitive that in liquid water a molecule would ideally donate two H-bonds, as in ice 1h. It is less obvious that the optimal number of H-bonds to accept is two. Indeed the number and geometry of H-bonds made by water in the liquid state remains the focus of many studies.
Figure 1.
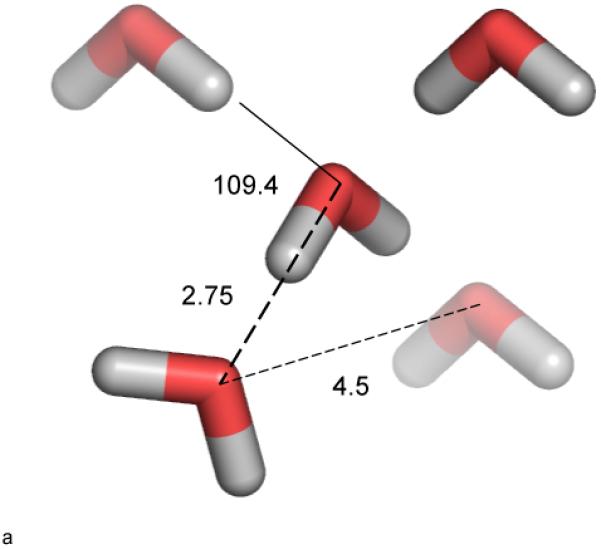

a. Tetrahedral arrangement and dimensions in Ice 1h lattice.
b. Some geometric definitions for the water pair. r is the distance between the two O atoms, θ is the H-O-O angle for the one H atom of the four that makes the smallest angle. φ is the corresponding angle for the H-atom of the other water that makes the minimum H-O-O angle. ψ and χ are the two angles the second H atoms make with the H-O-O plane. ω is the dihedral angle along the O-O line.
Liquid water
Radial structure
An advance in understanding liquid water structure was the determination, through X-ray and neutron scattering experiments, of O-O, H-H and O-H radial distribution functions (g(r)).2-4 Remarkably, these show that much of the tetrahedral ice lattice persists in liquid water: from the oxygen-oxygen radial distribution (local density) function goo(r) the nearest neighbors, with a density peak at 2.8–2.9Å, are just slightly more distant than in ice 1h (Figure 2). There is also a residual, though very broad, peak of density at 4.5Å diagnostic of tetrahedral ordering between waters in the first coordination shell. The radial distribution functions do however indicate extensive differences between ice and liquid. The number of nearest neighbors (coordination number), defined as the integral of goo(r) through the first peak to the first minimum is about 4.5–4.7, significantly higher than in ice 5, although still low compared to other liquids. Typical small molecule organic liquids have coordination numbers of 6–10. Thus water, like ice, is an open structured liquid with a high degree of angular ordering. However, in the liquid there is a considerable amount of density lying between the ice 1st and 2nd shell positions (at 2.75Å and 4.5Å respectively). This density is too high at the first minimum position (at ≈3.4Å) to be simply the overlap of broadened ice-derived 1st and 2nd shell densities.
Figure 2.

Radial distribution function goo(r) and integrated number of waters (•) for liquid water at 298K and 1Atm. Data from Soper and Phillips.59
Radial distribution functions can be obtained directly from low angle X-ray/neutron scattering experiments and have provided a wealth of information over a wide range of temperatures and pressures. They have been less informative about structure changes accompanying solvation: precise experimental studies using neutron scattering combined with hydrogen/deuterium isotope substitution find little change in g(r)’s upon addition of a solute.6,7 In particular, the distance between nearest neighbor waters around ionic and apolar solutes appears to be quite conserved at 2.75–2.9Å.
Angular structure
Angular structure of liquid water is only indirectly available from scattering and spectroscopy techniques, often with significant help from computer simulations. There are several ways to characterize angular structure. Measures of tetrahedrality derived from water center triplet positions 8 have been used to good effect in characterizing the anomalous structural properties of pure water over a range of T and P values.9 but are rather insensitive to solute effects. Although water around apolar groups becomes more ordered, as shown by the negative entropy of solvation, little difference in tetrahedrality is seen.8 A tetrahedrality measure based on distances rather than angles10 has, however, been shown to pick up differences in water structure induced by thermal hysteresis proteins.11 The spatial density function measures the relative density of waters around a central water oriented in a fixed reference frame, i.e. it is the local density distribution as a function of distance and polar coordinate g(r,φ,θ).12,13 g(r,φ,,θ) has, through elegant experimental work combined with extensive modeling, been extracted from neutron scattering data.14,15 Simulation and experiment give excellent agreement. A couple of important structural features of liquid water are revealed by this measure (Figure 3). First, the orientation of the two H-bond acceptor waters in the first coordination shell are much more defined than the two (or more?) H-bond donor molecules. Second, there is significant density of water placed interstitially to the first coordination shell slightly further out at ≈3.2–3.8Å, but significantly closer than the second shell at 4.5Å. It is this water density, halfway between the original 1st and 2nd shell positions in ice 1h, (the half shell of our title) resulting from the partial collapse of the open ice structure, which accounts for the significant density at the first minimum of goo(r) and the increase in coordination number of 0.5–0.8 waters upon melting. These interstitial water peaks are greatly enhanced at higher pressures by further collapse.13,14
Figure 3.

Spatial position function g(r,φ,θ) of liquid water at 298K, 1Atm, simulated with the TIP3P water model.
The third major way of quantifying angular structure is through the H-O...O angle, θ, formed between two waters, choosing the H atom of the four that gives the smallest angle. (Figure 1b).16 For convenience we refer to this as the H-bond angle, although there is no formal requirement for the two waters to be actually H-bonded. Liquid water can be viewed, with respect to ice 1h, as a randomly perturbed network of H-bonds with the principle perturbation occurring in this H-bond angle coordinate.16-20 θ proves to be very sensitive to changes in water structure, and changes in θ have been linked quantitatively to thermodynamic, physical and solvation properties of water. In Figure 4 we show simulation results for water using the TIP4P model. 21 The joint O-O distance (r), H-O-O angle probability distribution between water pairs, p(r,θ), is plotted. Taking ice Ih as a reference, we see that the first coordination shell of 4 waters is largely intact, broadening in the r direction, and moving to a somewhat less linear mean H-bond angle of 12° due to thermal motion. The integrated population of this more linear H-bond angle peak remains close to 4. Meanwhile the second coordination shell is extensively restructured. Significant density moves in, some (ca. 0.5–0.8 waters) within the 1st coordination shell. This forms a population of more bent H-bonds (mean angle ≈57°) resulting in a bimodal H-bond angle distribution, with a saddle point around 3.2Å and 38°. The figure inset (p(θ) for all waters up to the 1st minimum in goo(r) at r=3.5Å) emphasizes that the bimodal distribution exists within the 1st shell. The higher angle peak is formed by the persistent 5th water in the first shell forced to make a bent H-bond with the central water, one of the other four 1st shell waters or both. This bimodal distribution has been confirmed with simulations using other water models including SPCE and F3C 11,22,23 and it is consistent with spectroscopic studies discussed below. A satisfying geometric explanation for θ≈57° of the high angle peak is that the 5th water is forced by the 4 quasi-tetrahedral 1st coordination shell waters to approach the central water on a tetrahedron face, as shown by the spatial position function 13,15 (see Figure 3) and so makes an H-bond at close to half the tetrahedral angle. Robinson et al. attribute many of the anomalous physical properties of water to the presence of this half shell water and its structural/thermodynamic lability. 24
Figure 4.

Distance/H-bond angle probability distribution p(r,θ) for water pairs in liquid water at 298K, 1Atm, simulated with the TIP3P water model. Numbers on the figure indicate the position and number of waters in the p(r,θ) for ice 1h. Inset shows the angle probability function p(θ) for all water pairs with r≤3.5Å.
Perturbations in angular structure by solutes
The bimodal distribution of H-bond angles in liquid water is sensitive to a variety of perturbations, significantly more so than the radial structure.25 Angular distortion is a softer mode of deformation than distance distortion. Because of this, different angular structures can lie within quite similar radial distribution envelopes. The relative insensitivity of scattering data to solutes can be attributed partly to this. The bimodal distribution of water-water H-bond angles is also sensitive to solute type. In a series of studies on small molecules, proteins and nucleic acids, it was found that polar solutes and inorganic ions increase the population of bent H-bonds at the expense of the more linear population, while apolar solutes or groups do the reverse.22,26-31 Figure 5 shows an example of solute effects on the first shell water-water H-bond angle distribution for TMAO (apolar) and NaCl (polar). The physical explanation for these solute effects is straightforward. Water is a highly cohesive, strongly interacting network of H-bonding groups. A weakly interacting apolar solute can only insert itself by displacing the more weakly coordinated half shell water that makes the larger H-bond angle. Conversely, polar groups with their strong electrostatic fields tend to radially align solvating waters so they must make more strained H-bonds with each other.
Figure 5.

H-bond angle probability function for all water pairs with r≤3.5Å for pure water (_), first shell of NaCl (○) and first shell of TMAO (■), at 298K, 1Atm simulated with TIP4P water model.
For the two dozen or more solutes and half dozen proteins looked at so far, the water-water H-bond angle population remains bimodal, with peak and saddle positions unchanged.23,31 Only relative populations of the two peaks change. While current empirical water potentials are imperfect, these shifts in bimodal H-bond angle distribution have been seen with three water models, TIP3P, TIP4P and F3C:11,22,26,31 The phenomenon is robust.
Changes in water-water H-bond angle can be related to other water properties. They provide a quantitative explanation of the positive and negative hydration heat capacity (Cp) of, respectively, apolar and polar solutes/protein groups.31 Apolar groups increase the population of more linear water-water H-bonds with larger water-water interaction energy. The fluctuation in this energy is also larger, resulting in a net increase in the Cp of the solvating water. The converse is true for polar solutes: waters making more bent water-water H-bonds interact more weakly, and so produce smaller fluctuations of energy, lowering Cp. Effects of solutes are largely confined to the first shell, which explains empirical observations that hydration Cp effects are proportional to polar and apolar solvent accessible areas of solutes.32,33
An example of subtle solvation effects revealed by these water-water H-bond angle changes is provided by so called hydrophobic ions. Inorganic ions are of course highly polar. Larger ions of the alkyl-ammonium type, e.g. tetramethyl-ammonium (TMA+) are classed as hydrophobic ions, because, although soluble in water they increase water’s Cp rather than decrease it. This reversal of behavior is seen in the effect on the angular structure. While K+ promotes more bent H-bonds, TMA+ actually promotes more linear H-bonds.34
The distance/H-bond angle distribution function p(r,θ) is actually a two-dimensional subset of the 6 dimensional (one distance, five angles) function that completely specifies the mutual arrangement of two water molecules of fixed geometry (Figure 1b). We focus on the H-bond angle θ since changes in the other four angles are small and reveal little about solvation.34 The reason θ is the most informative of the angle coordinates is that combined with r, it specifies the two (of the nine total) atom-atom distances between two waters that have greatest contribution to pair interaction energy, namely the O-O interaction, and the closest O-H interaction.
A general conclusion from these studies is that the more bent H-bonds are weaker, more labile to perturbation by temperature and solutes. This view is reinforced by the results emerging from infrared spectroscopy of hydrated solutes and proteins, discussed below.
Broken H-bonds? Two states in liquid water?
Two perennial yet controversial ideas are found intertwined in literature on liquid water. The first is water as a mixture of two (or more) distinguishable states, dating back to flickering cluster and iceberg models.35,36 The bimodal distribution of water interaction energies seen right from the first computer simulations of liquid water by Rahman and Stillinger 5 were taken by some as confirmation of this. Literature on the two state idea is too extensive to discuss here, except to note that strong favoring evidence appears to be isobestic points in the Raman spectroscopy.37 This interpretation has recently been challenged.38 The second idea is that liquid water contains a mixture of made and broken H-bonds. Related to the second idea is the debate about how many H-bonds a water molecule makes in the liquid state. Again, this literature is so voluminous we can only touch on the major point. Based on liquid water’s larger coordination number, and the partial collapse of the open ice structure, many people argue that a water molecule must be making at least four H-bonds as in ice 1h, maybe more. This is our view. Recent X-ray absorption spectroscopy (XAS) experiments have been interpreted by Wernet et al., with significant help from simulation, to mean the opposite: water makes less H-bonds in the liquid than in ice, as few as two.39 This radical result has been challenged by Smith et al., based on additional XAS experiments.40
Given the results of H-bond angle analysis discussed above -- the bimodal distribution of H-bond angles and that temperature and solutes perturb relative amounts but not positions of these two water angle populations -- it is tempting to talk about two states of water, or to map the low angle, high angle populations onto the made and broken H-bonds of earlier discussions. However, several things should be pointed out. First, the angle analysis does not show two states of water in the pure liquid. There is on average one kind of water but it simultaneously makes low and high angle H-bonds. There is perhaps a mixture of two interactions, but not of water states. Second, the analysis is based on continuous distributions, there are no a priori definitions of what a made H-bond is. The bimodal behavior emerges from this analysis, but it is best to view liquid water as a continuously deformed network of H-bonds, as in the random network models of water that underpin our analysis.21 In our opinion there has been a largely fruitless debate on criteria for broken H-bonds in the literature. See for example the insightful discussion in Kumar et al., 23 who also use and discuss the continuous water-water distance/H-bond angle distribution function p(r,θ). The application of a ‘cutoff’ for H-bonds risks throwing out the baby with the bath water, and we believe definition issues lie behind the controversy over the interpretations of XAS experiments.
Angular and distance dependence of water’s IR stretching absorption
Water’s ability to H-bond has a large influence on its vibrational spectroscopic profile. As noted above, the oxygen of a water molecule is electronegative and it withdraws electrons from H, leaving H unshielded. The oxygen of a neighboring water molecule, by having lone-pair electrons, has electrons to donate such that its electrons can interact with H. The distributions of electrons affect the force constant between O and H. With increased H-bonding strength, water’s stretching frequencies go lower, while the bending frequency goes higher.41,42 It follows that by examining the IR of water information on the H-bonding network can be obtained.
To demonstrate the orientation and distance dependence of H-bonding on IR absorption, we show quantum computations of the O-O bond of a water dimer (Figure 6, N.Scott, unpublished). Looking at an O-O distance of 2.8 A, the approximate distance between O’s in liquid water, a near linear H bond produces the lowest frequency. As the angle between OH and the plane defined by O and the acceptor water molecule increases, the minimum in the energy disappears. At high angle and long distances H-bonding covalent interactions no longer are in play, and electrostatic interactions predominate. This is one set of data; other angles and distances have also been examined the same general conclusion. Of course, water dimer calculations do not mimic the case for liquid water since, in liquid each water molecule interacts with more than one water molecule, as described above. But the results do show that the energy of H-bonding is a sensitive function of angle of the H-bond.
Figure 6.

Left: Water dimer energy as a function of distance shown for 5 degrees intervals of H-bond (HOO) angle (0 degrees is the lowest energy curve).
Right: Potential energy surfaces (PES) for water dimer with fixed internal molecular geometry, showing energy dependence on O-O distance and H-bond angle.
All energies are in kcal/mol relative to minimum. Data obtained with acceptor water molecule and donor oxygen fixed in the plane of H-bond angle. The B3LYP DFT and 6–311++G(d,p) basis set with BSSE correction using Gaussian 03.
IR/MD studies of water with ions and small solutes
Using this as a background, when correlated with angular dependence computations, IR measurements provides a semi-quantitative picture of water arrangement around the solute. In the IR work that are cited here, the sample is 95% D2O and 5% H2O. At this ratio, the HOH concentration is about 0.14 M whereas the HOD concentration is ~ 5.3 M. Therefore, the OH stretch band that is observed arises from HOD that is decoupled from water’s other stretching vibration. In Figure 7, the OH stretch absorption region is shown for neat water and water containing trimethylamineoxide (TMAO) or NaCl.43 The sample containing TMAO shows absorption shifting to lower frequency, indicating stronger H-bonds and consistent with the simulations of TMAO solutions (Figure 5) which showed increased linear H-bonding.25 The OH stretch band of water containing NaCl shifts to higher frequency (Figure 7), showing the salt promotes non-linear H-bonding. Again the simulations confirm this (Figure 5).
Figure 7.

OH stretch absorption of 95 % D2O, 5% H2O upon addition of solutes. Black: Neat water; blue: 5 M TMAO, Green: 5 M NaCl; red: 5 M urea.
Recently, this experimental work has been extended to the Hofmeister series of ions.44 These ions are ranked based upon an over 100 year observation that they have differing ability to cause protein aggregation. Using an effective two-state hydrogen bonding model to interpret the temperature excursion infrared response of the O-H stretch of aqueous salt solutions, the sequence of anions that promote linear H-bonding followed the Hofmeister ranking as follows: PO43− > SO42− > HPO42− > Cl− > Br− > NO3−. For cations the order was Mg2+ > Li+ > Na+ ≥ K+; again the band shift of OH stretch indicate linear H-bonding for the kosmotrope Mg2+ and bent for the chaotrope K+.44 Ions that bind weakly to water are large and the charge is distributed over several atoms, as for NO3−. When the charge is larger and on one locus, the ions ability to order water is the greatest.45
In biology, compounds that contain hydroxyl groups are used to preserve biological samples under extreme cold or heat. Glycerol, used to stabilize proteins for storage at low temperature, can serve as an example. As glycerol concentration increases, water’s H-bonding network decreases and finally water will no longer crystallize. This is evident in the IR spectrum of the OH stretch of glycerol/water mixtures, which shows no evidence of crystals even at 20 K.46
IR/MD studies of water solutions containing protein denaturants
Urea and guanidine salts have been used for 70 years to denature proteins in solution.47 Despite many years of investigation, the exact mechanism by which guanidinium, i.e., Gdm+, (C(NH2)3+) or urea (CO(NH2)2) destabilize folded structures of proteins is still a matter of debate. A mechanism proposed for protein denaturation is that these substances directly interact with the protein amide group or some part of the side chain. This direct interaction model has long-standing evidence.47 However, the evidence does not necessarily rule out the possibility that these substances also affect water since by altering the H-bonding network of water, the native, folded state of a given protein could become no longer energetically favorable and the equilibrium shifts towards unfolding.
The vibrational OH absorption band of water reveals whether GdmHCl and urea changes water H-bonding. Urea has no large effect on the IR absorption spectrum of water.43 The lack of effect on water indicates that H-bonding between water and urea is very much the same as water H-bonding to each other. This conclusion has also been reached by time resolved IR 48 and neutron diffraction.49 In Figure 8, absorption spectra of neat liquid water, ice and Gdm+ Cl solutions are shown. In contrast to urea, Gdm+ promotes low frequency absorption of the OH band, indicating that it produces stronger, more linear “ice-like” H-bonding. While this does not preclude that Gdm+ binds to components of the protein, stronger H-bonding of water would promote higher partitioning of hydrophobic groups in the aqueous phase, and therefore the altered water structure would contribute to the destabilization of proteins.50 The structures of Gdm+ and urea are different. In addition to difference in charge, Gdm+ is planar and symmetrical. Urea is more floppy, and is expected to replace water molecules without a major disruption of the water H-bonding network.
Figure 8.

OH stretch of 95 % D2O, 5% H2O from 5 to 90 C. A. water with no salt; B. 5 m guanidinium chloride. From similar data;50 C. Ice from −4 to −40 C. From similar data.60
Amide absorption as influenced by H-bonding to water
The amide group of proteins gives rise to two strong absorption bands that are widely used experimentally to study protein conformation. The amide I band, absorbing near 1650 cm−1, arises mainly from C=O stretching vibration with smaller contributions from the out-of-phase C-N stretching vibration, the C-C-N deformation and the N-H in-plane bend. In proteins, the frequency and extinction coefficient depends on the secondary structure of the backbone since these are functions of the H-bonding and dipolar coupling between amide groups.51 The amide II mode is the out-of-phase combination of the NH in plane bend and the C-N stretching vibration.
Both amide I and II mode frequencies are sensitive to H-bonding. Strengthening the H-bond between a donor and the C=O group shifts amide I band lower. H bonding from the N-H and an acceptor in the solvent shifts the amide II band higher. The amide I stretch frequency for amide groups H-bonded to water is temperature dependent, since as temperature decreases water’s H-bonding strength increases.42,52,53 The temperature dependence of the frequency of water H-bonded amides indicates the residues of proteins that are exposed to water. The band is dynamically broadened by the fluctuating field of H-bonded water as measured by time-resolved vibration spectroscopy.54
IR/MD studies of proteins that bind ice
Water-water H-bond angle changes have been used to study hydration of thermal hysteresis or anti-freeze proteins (AFP’s).11,55,56 These proteins act as biological cryo-protectants by depressing the freezing point by binding ice nuclei and inhibiting their growth. A major conundrum is how such proteins can recognize and bind ice nuclei in a large 55 M excess of chemically identical liquid water. Here the sensitivity of the water-water H-bond angle measure has revealed subtle but systematic differences between ice binding and non-ice binding surfaces of proteins. Ice binding surfaces have more linear (i.e. more ice-like) water-water H-bonding in their solvating waters. Interestingly, this effect is mediated by both polar and apolor groups on the protein, arranged in such a fashion that even polar groups have more linear water-water H-bonds, a reversal of the pattern seen in small solutes and other protein groups. It thus seems that AFP’s are either recognizing ice by differences in angular structure, or are perturbing water’s angular structure so as to promote ice binding (see Figure 9). Antifreeze activity is not specific for stereochemistry of the protein, consistent with non-stereospecific ice surface.57 The amide I region of AFP from winter flounder does not shift in vibrational frequency during water’s phase transition of liquid to solid.58 This suggest that AFP perturbs water structure prior to ice formation.
Figure 9.

Structure of water around flounder antifreeze protein. Residue Ala16 defines the center of the ice nuclei binding site. Simulated water structure using TIP3P water model.55
In Summary
Water is a highly polar molecule consisting of a very electronegative atom, oxygen, bonded to weakly electropositive hydrogen atoms, and having two lone pair electrons. Its ability to be both an H-bond donor and acceptor governs its role as a solvent. Insights on water’s interactions with solutes and at surfaces of biomacromolecules can be further obtained by considering the angular dependence of H-bonding.
Acknowledgments
Supported by NIH grant GM 48130. We thank Nathan Scott for helpful discussion and data of Figure 6.
Biography
BIOGRAPHICAL INFORMATION
Kim A. Sharp was born in Prague, The Czech Republic. He was awarded his Ph. D. from the University of British Columbia, Vancouver, in 1985. He uses theory and computer simulations to study the structure of water, electrostatic and hydrophobic interactions, and the solvation of proteins and nucleic acids. Current work is focused on the mechanism of antifreeze proteins. Jane M. Vanderkooi grew up in Amherst, South Dakota and Herman, Minnesota. She received a Ph.D. from St. Louis University, Missouri, in 1971. She studies protein dynamics using spectroscopy and is currently studying water’s influence on protein stability.
REFERENCES
- 1.Bragg WH. The Crystal Structure of Ice. Proc. Phys. Soc. London. 1921;34:98–103. [Google Scholar]
- 2.Narten A, Levy H. Liquid water: Molecular correlation functions from x-ray diffraction. J. Chem. Phys. 1971;55:2263–2269. [Google Scholar]
- 3.Bosio L, Chen S, Teixeira J. Isochoric temperature differential of the x-ray structure factor and structural rearrangements in low-temperature heavy water. Phys. Rev. A. 1983;27:1468–1475. [Google Scholar]
- 4.Soper AK. The radial distribution functions of water and ice. Chem. Phys. 2002;258:121–137. [Google Scholar]
- 5.Rahman A, Stillinger F. Molecular dynamics study of liquid water. J. Chem. Phys. 1971;55:3336–3359. [Google Scholar]
- 6.Turner J, Soper A. The effect of apolar solutes on water structure: Alcohols and tetraalkylammonium ions. J. Chem. Phys. 1994;101:6116–6125. [Google Scholar]
- 7.Turner J, Soper A, Finney J. Ionic versus apolar behavior of the teramethylammonium ion in water. J. Chem. Phys. 1995;102:5438–5443. [Google Scholar]
- 8.Chau P, Hardwick A. A new order parameter for tetrahedral configurations. Mol. Phys. 1998;93:511–518. [Google Scholar]
- 9.Errington J, Debenedetti P. Relationship between structural order and the anomolies of liquid water. Nature. 2001;409:318–21. doi: 10.1038/35053024. [DOI] [PubMed] [Google Scholar]
- 10.Medvedev N, Naberukhin Y. Shape of the Delaunay simplexes in dense random packings of hard and soft spheres. J. Non-Cryst. Solids. 1987;94:402–406. [Google Scholar]
- 11.Smolin N, Daggett V. Formation of Ice-like water structure on the surface of an antifreeze protein. J. Phys. Chem. B. 2008;112:6193–6202. doi: 10.1021/jp710546e. [DOI] [PubMed] [Google Scholar]
- 12.Svishchev I, Kusalik P. Structure in liquid water: A study of spatial distribution functions. J. Chem. Phys. 1993;99:3049–61. [Google Scholar]
- 13.Svishchev IM, Zassetsky A, Kusalik P. Solvation structures in three dimensions. Chem. Phys. 2000;258:181–186. [Google Scholar]
- 14.Soper A, Ricci M. Structures of high-density and low-density water. Phys. Rev. Lett. 2000;84:2881–2884. doi: 10.1103/PhysRevLett.84.2881. [DOI] [PubMed] [Google Scholar]
- 15.Soper AK. Probing the structure of water around biological molecules: concepts, constructs and consequences. Physica B. 2000;276:12–16. [Google Scholar]
- 16.Henn AR, Kauzmann W. Equation of state of a random network, continuum model of liquid water. J. Phys. Chem. 1989;93:3770–3783. [Google Scholar]
- 17.Pople J. Proc. Roy. Soc. Lond. 1961;A 205:163. [Google Scholar]
- 18.Sceats MG, Stavola M, Rice SA. A zeroth order random network model of liquid water. J. Chem. Phys. 1979;70:3927–38. [Google Scholar]
- 19.Sceats MG, Rice SA. A random network model calculation of the free energy of liquid water. J. Chem. Phys. 1980;72:6183–91. [Google Scholar]
- 20.Rice SA, Sceats MG. A random network model for water. J. Phys. Chem. 1981;85:1108–1119. [Google Scholar]
- 21.Gallagher K, Sharp KA. A new angle on heat capacity changes in hydrophobic solvation. J. Am. Chem. Soc. 2003;125:9863–9870. doi: 10.1021/ja029796n. [DOI] [PubMed] [Google Scholar]
- 22.Raschke T, Levitt M. Nonpolar solutes enhance water structure within hydration shells while reducing interactions beteen them. Proc. Natl. Acad. Sci. USA. 2005;102:6777–6782. doi: 10.1073/pnas.0500225102. [DOI] [PMC free article] [PubMed] [Google Scholar]
- 23.Kumar R, Schmidt J, Skinner J. Hydrogen bonding definitions and dynamics in liquid water. J. Chem. Phys. 2007;126:204107–11. doi: 10.1063/1.2742385. [DOI] [PubMed] [Google Scholar]
- 24.Cho H, Singh S, Robinson G. Understanding all of water’s anomalies with a nonlocal potential. J. Chem. Phys. 1997;107:7979–7988. [Google Scholar]
- 25.Madan B, Sharp K. Changes in water structure induced by a hydrophobic solute proved by simulation of the water hydrogen bond angle and radial distribution functions. Biophys. Chem. 1999;78:33–41. doi: 10.1016/s0301-4622(98)00227-0. [DOI] [PubMed] [Google Scholar]
- 26.Madan B, Sharp K. Heat capacity chages accompanying hydrophobic and ionic solvation: A monte Carlo and random network model study. J. Phys. Chem. 1996;100:7713–7721. [Google Scholar]
- 27.Madan B, Sharp K. Molecular origin of hydration heat capacity chages of hydrophbic solutes: Perturbation of water structure around alkanes. J. Phys. Chem. B. 1997;101:11237–11242. [Google Scholar]
- 28.Sharp KA, Madan B. Hydrophobic effect, water structure, and heat capacity changes. J. Phys. Chem.B. 1997;101:4343–4348. [Google Scholar]
- 29.Vanzi F, Madan B, Sharp K. Effect of the protein denaturants urea and guanidinium on water structure: a structural and thermodynamic study. JACS. 1998;120:10748–53. [Google Scholar]
- 30.Madan B, Sharp KA. Hydration Heat Capacity of Nucleic Acid Constituents Determined from the Random Network Model. Biophysical Journal. 2001;81:1881–1887. doi: 10.1016/S0006-3495(01)75839-0. [DOI] [PMC free article] [PubMed] [Google Scholar]
- 31.Gallagher KR, Sharp KA. Analysis of thermal hysteresis protein hydration using the random network model. Biophys. Chem. 2003;105:195–209. doi: 10.1016/s0301-4622(03)00087-5. [DOI] [PubMed] [Google Scholar]
- 32.Spolar RS, Livingstone JR, Record MT., Jr. Use of liquid hydrocarbon and amide transfer data to estimate contributions to protein folding. Biochemistry. 1992;31:3947–55. doi: 10.1021/bi00131a009. [DOI] [PubMed] [Google Scholar]
- 33.Gomez J, Hilser V, Xie D, Freire E. The heat capacity of proteins. Proteins. 1995;22:404–412. doi: 10.1002/prot.340220410. [DOI] [PubMed] [Google Scholar]
- 34.Gallagher KR, Sharp KA. A new angle on heat capacity changes in hydrophobic solvation. J. Am. Chem. Soc. 2003;125:9853–9860. doi: 10.1021/ja029796n. [DOI] [PubMed] [Google Scholar]
- 35.Frank HS, Wen WY. Structural Aspects of Ion-Solvent Interaction in Aqueous Solutions: A Suggested Picture of Water Structure. Discuss. Faraday Soc. 1957;24:133. [Google Scholar]
- 36.Nemethy G, Scheraga H. Structure of water and hydrophobic bonding. I A model for the thermodynamic properties of liquid water. J. Chem. Phys. 1962;36:3382–3400. [Google Scholar]
- 37.Walrafen GE. Raman spectral studies of the effects of temperature on water structure. J. Chem. Phys. 1967;47:114–26. [Google Scholar]
- 38.Smith JD, Cappa CD, Wilson KR, Cohen RC, Geissler PL, Saykally RJ. Unified description of temperature-dependent hydrogen-bond rearrangements in liquid water. Proc. Natl. Acad. Sci. U S A. 2005;102:14171–14174. doi: 10.1073/pnas.0506899102. [DOI] [PMC free article] [PubMed] [Google Scholar]
- 39.Wernet P, Nordlund D, Bergmann U, Cavalleri M, Odelius M, Ogasawara H, Naslund L, Hirsch TK, Ojamae L, Glatsel P, Pettersson LG, Nilsson A. The structure of the first coordination shell in liquid water. Science. 2004;304:995–999. doi: 10.1126/science.1096205. [DOI] [PubMed] [Google Scholar]
- 40.Smith J, Cappa C, Wilson K, Messer B, Cohen R, Saykally R. Energetics of hydrogen bond network rearrangements in liquid water. Science. 2004;306:851–3. doi: 10.1126/science.1102560. [DOI] [PubMed] [Google Scholar]
- 41.Jeffrey GA. An Introduction to Hydrogen Bonding. Oxford University Press; New York: 1997. [Google Scholar]
- 42.Vanderkooi JM, Dashnau JL, Zelent B. Temperature excursion infrared (TEIR) spectroscopy used to study hydrogen bonding between water and biomolecules. Biochim. Biophys. Acta. 2005;1749:214–233. doi: 10.1016/j.bbapap.2005.03.008. [DOI] [PubMed] [Google Scholar]
- 43.Sharp KA, Madan B, Manas ES, Vanderkooi JM. Water structure changes induced by hydrophobic and polar solutes revealed by simulations and infrared spectroscopy. J. Chem. Phys. 2001;114:1791–1796. [Google Scholar]
- 44.Nucci NV, Vanderkooi JM. Effects of salts of the Hofmeister series on the hydrogen bond network of water. J. Mol. Liquids. 2008;143:160–170. doi: 10.1016/j.molliq.2008.07.010. [DOI] [PMC free article] [PubMed] [Google Scholar]
- 45.Collins KD. Charge density-dependent strength of hydration and biological structure. Biophys. J. 1997;72:65–76. doi: 10.1016/S0006-3495(97)78647-8. [DOI] [PMC free article] [PubMed] [Google Scholar]
- 46.Dashnau JL, Nucci NV, Sharp K, Vanderkooi JM. Hydrogen bonding and the cryoprotective properties of glycerol/water mixtures. J. Phys. Chem. 2006;110:13670–13677. doi: 10.1021/jp0618680. [DOI] [PubMed] [Google Scholar]
- 47.Pace CN. Determination and analysis of urea and guanidine hydrochloride denaturation curves. Methods Enzymol. 1986;131:266–280. doi: 10.1016/0076-6879(86)31045-0. [DOI] [PubMed] [Google Scholar]
- 48.Rezus YLA, Bakker HJ. Effect of urea on the structural dynamics of water. Proc Natl Acad Sci U S A. 2006;103:18417–18420. doi: 10.1073/pnas.0606538103. [DOI] [PMC free article] [PubMed] [Google Scholar]
- 49.Soper AK, Castner EW, Luzar A. Impact of urea on water structure: a clue to its properties as a denaturant? Biophys Chem. 2003;105:649–666. doi: 10.1016/s0301-4622(03)00095-4. [DOI] [PubMed] [Google Scholar]
- 50.Scott JN, Nucci NV, Vanderkooi JM. Changes in water structure induced by the guanidinium cation and implications for protein denaturation. J. Phys. Chem. A. 2008;112:10939–10948. doi: 10.1021/jp8058239. [DOI] [PMC free article] [PubMed] [Google Scholar]
- 51.Krimm S, Bandekar J. Vibrational spectroscopy and conformation of peptides, polypeptides, and proteins. Adv. Protein Chem. 1986;38:181–364. doi: 10.1016/s0065-3233(08)60528-8. [DOI] [PubMed] [Google Scholar]
- 52.Manas ES, Getahun Z, Wright WW, DeGrado WF, Vanderkooi JM. Infrared Spectra of Amide Groups in α-Helical Proteins: Evidence for Hydrogen Bonding between Helices and Water. J. Am. Chem. Soc. 2000;122:9883–9890. [Google Scholar]
- 53.Walsh STR, Cheng RP, Daggett V, Vanderkooi JM, DeGrado WF. The hydration of amides in helices: a comprehensive picture from molecular dynamics, IR and NMR. Protein Science. 2003;12:520–531. doi: 10.1110/ps.0223003. [DOI] [PMC free article] [PubMed] [Google Scholar]
- 54.Mukherjee P, Kass I, Arkin IT, Zanni MT. Structural disorder of the CH3 transmembrane domain studied with 2D IR spectroscopy and molecular dynamics simulations. J. Phy. Chem. B. 2006;110:24740–24749. doi: 10.1021/jp0640530. [DOI] [PMC free article] [PubMed] [Google Scholar]
- 55.Yang C, Sharp K. Hydrophobic tendency of polar group hydration as a major force in type I antifreeze protein recognition. Proteins. 2005;59:266–74. doi: 10.1002/prot.20429. [DOI] [PubMed] [Google Scholar]
- 56.Yang C, Sharp KA. The mechanism of the type III antifreeze protein action: A computational study. Biophys. Chem. 2004;109:137–148. doi: 10.1016/j.bpc.2003.10.024. [DOI] [PubMed] [Google Scholar]
- 57.Pentelute BL, Gates Z, Dashnau JL, Vanderkooi JM, Kent SBH. Mirror Image Forms of Snow Flea Antifreeze Protein (sfAFP) Prepared by Total Chemical Synthesis Have Identical Antifreeze Activities. J. Am. Chem. Soc. 2008;130:9702–9707. doi: 10.1021/ja801352j. [DOI] [PMC free article] [PubMed] [Google Scholar]
- 58.Zelent B, Bryan MA, Sharp KA, Vanderkooi JM. Influence of surface groups of proteins on water studied by freezing/thawing hysteresis and infrared spectroscopy. Biophys Chem. 2009;141:222–230. doi: 10.1016/j.bpc.2009.02.002. [DOI] [PubMed] [Google Scholar]
- 59.Soper AK, Phillips MG. A new determination of the structure of water at 25-degrees-C. Chem. Phys. 1986;107:47–60. [Google Scholar]
- 60.Zelent B, Nucci NV, Vanderkooi JM. Liquid and ice water and glycerol/water glasses compared by infrared spectroscopy from 295 to 12 K. J. Phys. Chem. A. 2004;108:11141–11150. [Google Scholar]