

Abstract
Decreases in retinal blood flow in diabetics could render the retina hypoxic. In mouse and rat models of diabetes, a decrease in retinal blood flow occurs early, within 3–4 weeks of the induction of hyperglycemia, although information is scarce on whether this early decrease in flow induces hypoxia. The purpose of the current study was to determine whether hypoxia-inducible factor (HIF) levels increase following 4 and/or 12 weeks of hyperglycemia in streptozotocin (STZ)-injected mouse (C57BL/6) and rat (Wistar) retinas. Additionally, retinal tissue hypoxia was measured with pimonidazole following 12 weeks of hyperglycemia. These aims were accomplished via immunostaining of cross-sections from enucleated eyes. In mice, staining for HIF-1α and HIF-2α showed a contrasting pattern, with HIF-1α higher in the inner retina than outer, but HIF-2α higher in the outer retina than inner. However, in rats, staining for both HIF-1α and HIF-2α was more intense in the inner retina. The HIF-1α staining intensities and patterns were similar between diabetic animals and their non-diabetic counterparts following 4 and 12 weeks of hyperglycemia. The same was true for HIF-2α except for a trend toward an increase following 12 weeks of hyperglycemia in mice. Pimonidazole staining showed significant decreases throughout all layers of the central retina and most layers of the peripheral retina of rats (but not mice), following 12 weeks of hyperglycemia. In summary, despite early decreases in flow in rats and mice, retinal HIF-1α and HIF-2α were not found to be increased, and the extent of hypoxia may even decrease after 12 weeks of hyperglycemia in rats.
Keywords: Hypoxia-inducible factor, HIF-1α, HIF-2α, Streptozotocin, Diabetes, Retina, Hypoxia
Introduction
Diabetic retinopathy is the most prevalent cause of blindness in western countries (Rossing, 2005). The mechanisms of diabetic retinopathy remain unclear; however, it is believed that retinopathy is an ischemic disorder which leads to the development of neovascularization and blindness (Yam and Kwok, A. K., 2007). One of the molecules responsible for the sight-threatening neovascularization is vascular endothelial growth factor (VEGF), which has been found to be elevated in the retina of diabetic animals and humans (Ayalasomayajula and Kompella, U. B., 2003; Pe’er et al., 1996). The increase in VEGF has been speculated to be the result of ischemic hypoxia (Pe’er et al., 1996).
Several animal studies of diabetes have demonstrated retinal hypoxia at various time points following the induction of hyperglycemia. After six years of hyperglycemia, retinal oxygen tension has been found to decrease in the inner retina of diabetic cats (Linsenmeier et al., 1998). Additionally, at a much earlier time point of five months, evidence of hypoxia has been found in the diabetic mouse using the oxygen-dependent probe pimonidazole (de Gooyer et al., 2006b). Whether hypoxia might occur even prior to five months of diabetes is unknown; however, consistent with this possibility, our lab has found vasoconstriction and substantial decreases in blood flow in as early as 3–4 weeks of diabetes in both mice and rats (Lee et al., 2008; Lee and Harris, N. R., 2008; Wright et al., 2009; Wright and Harris, N. R., 2008). Moreover, decreases in retinal capillary density occur in rats in as little as two weeks of diabetes (Moreno et al., 1995), and in mice following five months of diabetes (de Gooyer et al., 2006b).
The transcription factors hypoxia inducible factor-1 and -2 (HIF-1 and HIF-2) can be altered during shifts in oxygen levels (Ke and Costa, M., 2006). There are two isoforms of HIF-1: HIF-1α and HIF-1β (Nangaku et al., 2008). The HIF-1β isoform is constitutively expressed regardless of oxygen tension, while the HIF-1α isoform has a short half-life during normoxia (Ke and Costa, M., 2006). When oxygen tension drops, the HIF-1α isoform is stabilized and translocates to the nucleus, where it binds to HIF-1β and becomes transcriptionally active (Arjamaa and Nikinmaa, M., 2006). HIF-2α is regulated similarly to HIF-1α, except HIF-2α appears to be stabilized at higher oxygen tensions and is important in adaptations to chronic hypoxia (Holmquist-Mengelbier et al., 2006).
The time course of changes in HIF-1α and HIF-2α remain unclear in the diabetic retina. In one model of diabetes, STZ-injected rats, a small increase in HIF-1α in nuclear extracts was found following 8 days of hyperglycemia (Poulaki et al., 2002), and following 2 weeks of hyperglycemia, an increase was observed in HIF-1α in the inner nuclear layer (INL) and ganglion cell layer (GCL) (Poulaki et al., 2004). In a second model, STZ-injected mice, HIF-1α increased in nuclear extracts following 7 days of hyperglycemia (Kondo and Kahn, C. R., 2004). Finally, in a third model, non-obese diabetic (NOD) mice, HIF-1α is not increased following 6 weeks of hyperglycemia, but is increased following 12 weeks (Li et al., 2006). With regard to HIF-2α, the time course in rat and mouse diabetic retina remains unknown. Given our findings of substantial decreases in blood flow at 3–4 weeks of STZ-induced diabetes in both mice and rats (Lee et al., 2008; Lee and Harris, N. R., 2008; Wright et al., 2009; Wright and Harris, N. R., 2008), the aims of the present study were to investigate possible increases in HIF-1α and HIF-2α at this early time point, and to investigate signs of hypoxia at the later 12-week time point as well.
Materials and methods
2.1. Animals
Male C57BL/6 mice (Jackson Laboratories) weighing 24 to 29 grams were randomly assigned to intraperitoneal (i.p.) injection of streptozotocin (STZ; Sigma, St. Louis, MO; 180 mg/kg dissolved in pH 4.5 sodium citrate buffer) or sodium citrate buffer alone. Male Wistar rats (Harlan Laboratories) weighing 129 to 170 grams similarly were assigned to i.p. injection of STZ (60 mg/kg dissolved in pH 4.5 sodium citrate buffer) or sodium citrate buffer alone. Streptozotocin was injected into the animals within 15 min of preparation. Mice and rats remained on the protocol for 4 or 12 weeks following STZ injection. Non-fasting blood glucose levels were checked 6 days following STZ injection and again on the day of tissue collection (4 or 12 weeks after the STZ or citrate buffer injection) via a tail vein puncture using a One Touch Ultra Glucometer (Milpitas, CA). Mice and rats injected with STZ were included in the study if glucose values at day 6 following injection and on the day of sacrifice (4 or 12 weeks following STZ injection) exceeded 250 mg/dl. However, a glucose measurement was not obtained from 3 rats on day 6 following injection, but with glucose values > 500 mg/dl on the day of sacrifice, were included in the study. Beginning on day 6 following STZ injection, body weight was checked 3 times per week. The animals received 0–2 units insulin/kg of body weight, (Humulin R; Eli Lilly & Co., Indianapolis, IN) 0–3 times per week as determined from any measured loss in body weight. Insulin was stopped at least 48 hours prior to tissue collection. Mice and rats received standard chow and water and were housed 1 per cage. The animals were treated in accordance with the ARVO Statement for the Use of Animals in Ophthalmic and Vision Research.
2.2. Measurement of Retinal Hypoxia
Retinal tissue hypoxia was measured using the Hypoxyprobe™-1 Omni Kit (Natural Pharmacia International Inc., Burlington, MA). The Hypoxyprobe™-1 Omni Kit contains pimonidazole hydrochloride (HCl) and rabbit anti-pimonidazole antisera (primary antibody for immunofluorescent labeling). Pimonidazole HCl remains in the hypoxic cells upon forming an irreversible adduct with thiol groups in tissues with a PO2 < 10 mmHg (Raleigh and Koch, C. J., 1990). Using the rabbit anti-pimonidazole antisera, immunofluorescent labeling of tissue cross- sections for localization of hypoxia can be performed.
2.3. Tissue Preparation for Immunofluorescence Labeling
Four or twelve weeks following STZ injection, rats and mice were injected i.p. with pimonidazole HCl at a dose of 60 mg/kg, and the animals were killed 3 hours later (de Gooyer et al., 2006a; Gardiner et al., 2005) with Enflurane (rats) or an overdose of Nembutal sodium solution (pentobarbital; mice). Eyes were enucleated and placed in phosphate buffered 4% paraformaldehyde (FD Neurotechnologies, Inc., Baltimore, MD) for 2–2.5 hours. The eye was cut at the ora serrata and the anterior portion of the eye and lens were removed. The eyecup (retina, choroid, and sclera) was placed in 15–20% sucrose solution at 4° C overnight for cryoprotection (Chen and Nathans, J., 2007; Nishiguchi et al., 2008). Eyecups were then placed in optimal cutting temperature (O.C.T.) compound and cut at thicknesses of 8 μm (mice) or 10 μm (rats) and stored at −80° C until labeled.
2.4. Immunofluorescence Labeling
Slides were washed for 5 minutes 2x in Triton X-100 with gentle agitation. Slides were incubated in goat serum for 1.5 hours, followed by incubation with primary antibody mixed in PBS + 1% bovine serum albumin (BSA) overnight at 4° C (negative controls slides were incubated without primary antibody added to PBS + 1% BSA). Next, slides were washed 2x with Triton X-100 for 5 minutes with gentle agitation followed by incubation with secondary antibody mixed in PBS + 1% BSA for 1 hour in the dark. Finally, slides were washed 2x in PBS for 10 minutes and mounted with Vectashield® Hardset™ Mounting medium with DAPI (Vector Laboratories, Inc., Burlingam, CA).
A CoolSNAP ES camera (Photometrics, Tucson, AZ) attached to a Nikon Eclipse E600FN microscope was used to collect images. An X-Cite™ 120 Fluorescence illumination system was used as a light source. A 10x objective and a Nikon FITC filter was used for image acquisition with an exposure time of 500 ms. Light intensity measurements were taken using a radiometer photometer (model ILT 1400-A; International Light Technologies; Peabody, MA) before and after each series of images were collected on a specimen, and then averaged. NIS Elements Basic Research software version 3.0 (Nikon Instruments Inc., Melville, NY) was used for capturing and analyzing the images.
Primary antibodies used were a rabbit polyclonal HIF-1α (Lifespan Biosciences, Seattle, WA) at a 1:100 dilution, rabbit polyclonal HIF-2α (Abcam, Cambridge, MA) at a 1:500 dilution, and a rabbit polyclonal anti-pimonidazole (NPi Inc, Burlington, MA) at a 1:1000 dilution. The secondary antibody was a goat anti-rabbit IgG-Fc Fragment – FITC (Jackson Immuno Research Labs, West Grove, PA) at a 1:500 dilution in mice for HIF-1α, a 1:1000 dilution in mice for HIF-2α, a 1:500 dilution for HIF-1α in rats, a 1:100 dilution for HIF-2α in rats, and a 1:200 dilution for anti-pimonidazole in rats and mice.
2.5. Immunofluorescence Image Analysis
Three images from the central and peripheral retina were collected for analysis. The analysis for the central and peripheral retina was broken into two regions of interest for HIF-1α and HIF-2α anlaysis: the inner retina (ganglion cell layer, GCL; inner plexiform layer, IPL; inner nuclear layer, INL; and outer plexiform layer, OPL) and the outer retina (outer nuclear layer, ONL, and photoreceptor layer, PR). The hypoxia analysis (anti-pimonidazole fluorescent intensity) was broken into the GCL, IPL, INL+OPL, ONL, and PR layers. A region of interest was drawn around the area to be analyzed in the DAPI counterstained image, with the identical region of interest used for the analysis of the matching FITC-conjugated stained image. A background region of interest was collected for each image. The mean intensity of the retinal region of interest was obtained from the tissue pixels that had a higher intensity than that of the mean background intensity. The intensity was then normalized as follows: (mean tissue intensity – mean background intensity) / light intensity.
ONL thickness and cell density were quantified in rats following 12 weeks of hyperglycemia, using images of the DAPI counterstaining of the tissue labeled with anti-pimonidazole. An area of interest was drawn around the ONL, and the thickness and number of nuclei per unit area were quantified in three regions each of the central and peripheral retina.
2.6. Statistics
Results are expressed as mean ± standard error of the mean. Statistical analysis was performed with GraphPad Instat version 3.05 software (San Diego, CA). A p-value < 0.05 was considered statistically significant. T-tests were performed with comparisons between two groups and a Welch correction was performed when standard deviations were not considered equal, and an ANOVA with Bonferroni correction was used when multiple groups were being compared.
Results
3.1. Animal Data
Table 1 provides data on body weight and glucose values for the experimental groups. Included in the study were 15 control mice, 17 control rats, 13 STZ-injected mice, and 21 STZ-injected rats. STZ induced a 3–4 fold increase in glucose in both mice and rats compared with buffer-injected controls. Some mice and rats had glucose values above 600 mg/dl, the upper limit of the glucometer, and therefore we present median glucose values in Table 1. By day 6 after injection, 4 mice had glucose values >600 mg/dl, with this number increasing to 8 on the day of sacrifice. For the rats, 3 had a glucose value >600 mg/dl by day 6, with this number increasing to 6 on the day of sacrifice. Mice injected with STZ lost body weight, whereas rats injected with STZ continued to gain weight, but not to the extent of the buffer-injected rats.
Table 1.
Body weight and blood glucose values in the experimental groups: 4 week control mice (N=7), 4 week control rats (N=8), 4 week streptozotocin mice (STZ; N=7), 4 week STZ rats (N=12), 12 week control mice (N=8), 12 week control rats (N=9), 12 week streptozotocin mice (STZ; N=6), and 12 week STZ rats (N=9). Glucose levels are reported as median values.
| Group | Day of injection | Day 6 after injection | Day of Sacrifice | ||||
|---|---|---|---|---|---|---|---|
| Control | STZ | Control | STZ | Control | STZ | ||
| Weight (g) | 4 week – mice | 25.5 ± 0.5 | 26.1 ± 0.7 | 26.9 ± 0.3 | 19.6 ± 0.6aaa | ||
| 4 week – rats | 147.5 ± 4.2 | 147.8 ± 3.2 | 342.8 ± 11.0 bbb | 231.7 ± 7.6aaa | |||
| 12 week – mice | 26.4 ± 0.3 | 25.6 ± 0.4 | 27.4 ± 0.3 | 24.3 ± 0.4ccc | |||
| 12 week – rats | 154.9 ± 2.0 | 151.7 ± 2.9 | 536.4 ± 16.7bbb | 352 ± 18.2aaa | |||
| Glucose (mg/dl) | 4 week – mice | 186 | 520 | 223 | >600 | ||
| 4 week – rats | 126 | 431 | 153 | 564 | |||
| 12 week – mice | 136 | 537 | 216 | 412 | |||
| 12 week – rats | 178 | 418 | 179 | 546 | |||
p<0.001 vs control day of sacrifice, and p<0.001 vs STZ day of injection.
p<0.001 vs control day of injection.
p<0.001 vs control day of sacrifice.
3.2. HIF-1α
HIF-1α fluorescent intensity was higher in the inner retina than in the outer retina in both mice and rats following 4 and 12 weeks of hyperglycemia as shown in Figures 1–3, with no substantial differences between the central and peripheral retina. Induction of diabetes did not increase expression of HIF-1α in any region of the retina of either mice or rats, and in fact, there was a very small but statistically significant decrease in intensity in the outer central retina of rats following 4 weeks of hyperglycemia (Fig 1B). Data from one rat in the 4-week group and one rat in the 12-week group were eliminated from the analysis due to the quality of the cut. Figure 2 provides representative images of HIF-1α staining (in rats). Negative control slides for HIF-1α from both mice and rats showed insignificant staining in all regions measured (data not shown).
Figure 1.
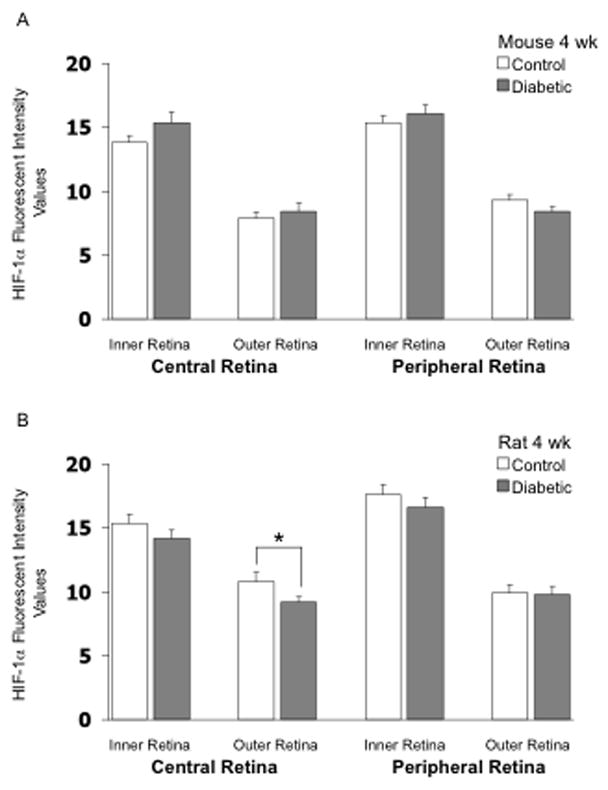
HIF-1α fluorescent intensity values in frozen cross-sections of the retina of mice (panel A) and rats (panel B). N= 7 control mice, 7 STZ mice, 8 control rats, and 11 STZ rats, with the STZ injected 4 weeks prior to collection of the eye. * p<0.05 between the indicated groups.
Figure 3.
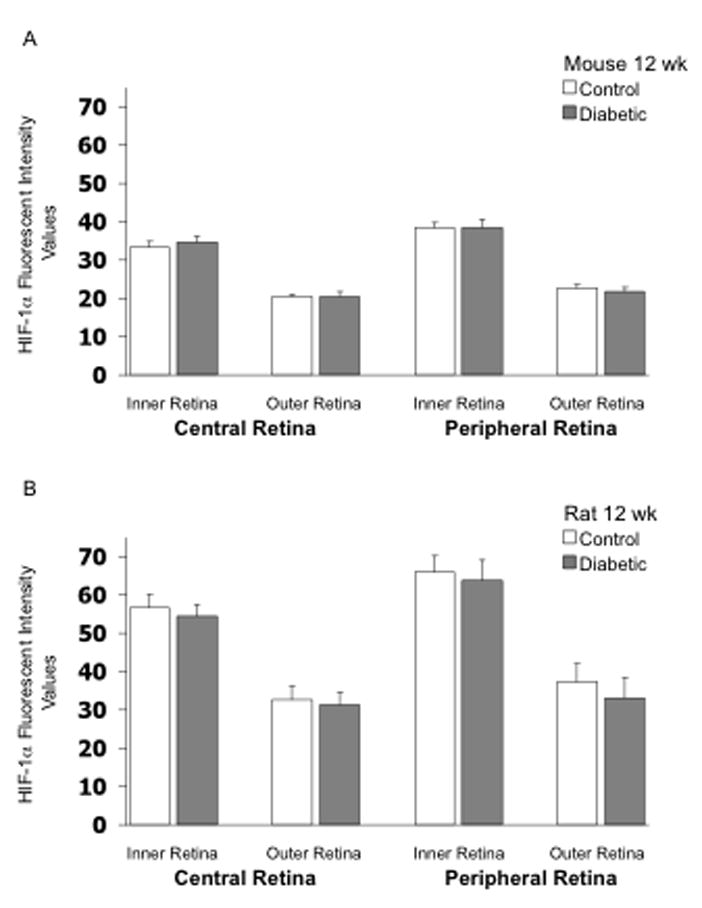
HIF-1α fluorescent intensity values in frozen cross-sections of the retina of mice (panel A) and rats (panel B). N= 8 control mice, 6 STZ mice, 8 control rats, and 9 STZ rats, with the STZ injected 12 weeks prior to collection of the eye.
Figure 2.
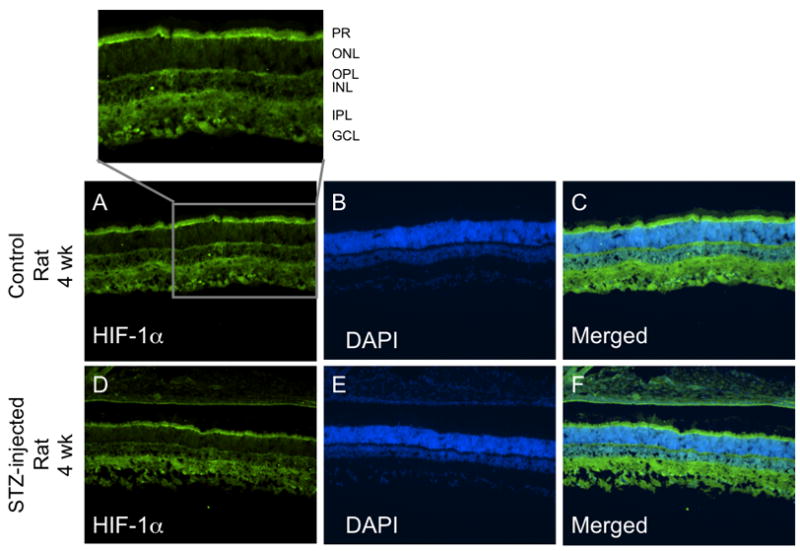
Representative cross-sectional images of HIF-1α staining from the central retina of control and diabetic rats. Panels A and D show HIF-1α staining, panels B and E show the DAPI counterstain, and panels C and F show the merged HIF-1α/DAPI overlay. The magnified section from panel A is labeled for the ganglion cell layer (GCL), inner plexiform layer (IPL), inner nuclear layer (INL), outer plexiform layer (OPL), outer nuclear layer (ONL), and photoreceptor layer (PR).
3.3. HIF-2α
As shown in Figure 4, HIF-2α fluorescent intensity in the mouse retina was higher in the outer retina than in the inner retina in the 4-week groups, in contrast to the staining pattern for HIF-1α. However, this pattern was reversed in rats, with HIF-2α higher in the inner retina than in the outer. Induction of diabetes did not substantially increase retinal expression of HIF-2α in either mice or rats following 4 weeks of hyperglycemia; however, in each region of the mouse retina, values tended to be higher with diabetes, with the statistical p-value reaching 0.07 at 4 weeks in the outer peripheral retina (Fig 4A). Induction of diabetes did not substantially increase retinal expression of HIF-2α in rats following 12 weeks of hyperglycemia (Fig 5A); however, there was a significant increase (p <0.05) in fluorescent intensity in the outer peripheral retina in the mouse following 12 weeks of hyperglycemia (Fig 5B). The values of HIF-2α intensity in the other regions also tended to be higher in the 12-week diabetic mouse, although statistical significance was not reached. The values from several rats (Fig 5B) were eliminated from the analysis due to the quality of the cuts. Figure 6 provides representative images of HIF-2α staining (in mice). Negative control slides showed insignificant staining in all regions measured (data not shown).
Figure 4.
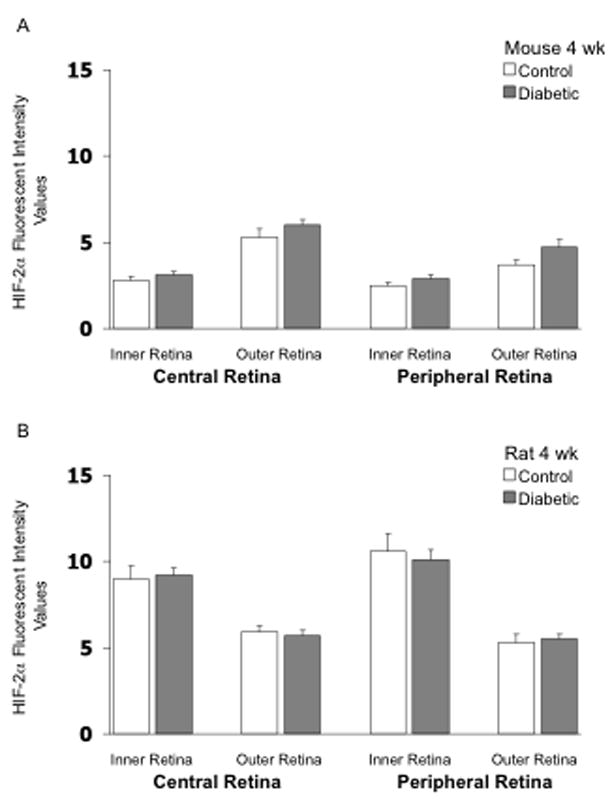
HIF-2α fluorescent intensity values in frozen cross-sections of the retina of mice (panel A) and rats (panel B). N= 7 control mice, 7 STZ mice, 8 control rats, and 9 STZ rats, with the STZ injected 4 weeks prior to collection of the eye.
Figure 5.
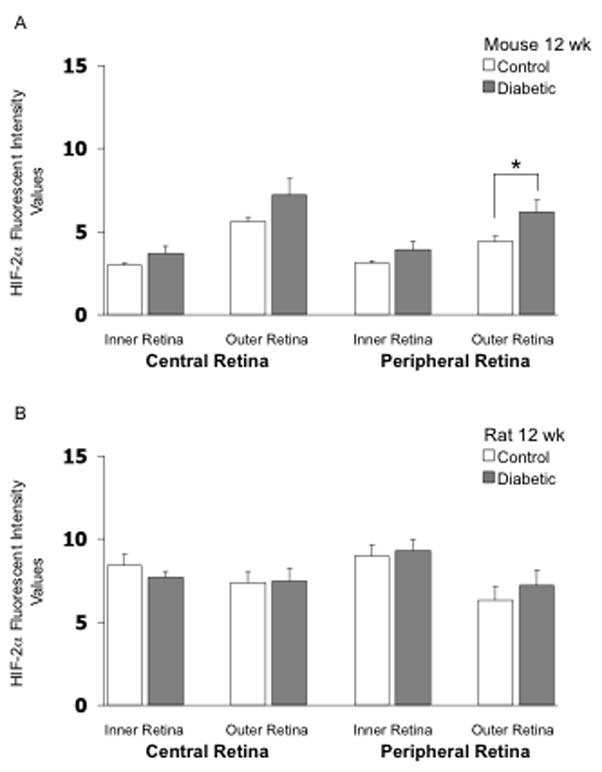
HIF-2α fluorescent intensity values in frozen cross-sections of the retina of mice (panel A) and rats (panel B). N= 8 control mice, 6 STZ mice, 7 control rats, and 8 STZ rats, with the STZ injected 12 weeks prior to collection of the eye. * p<0.05 between the indicated groups.
Figure 6.
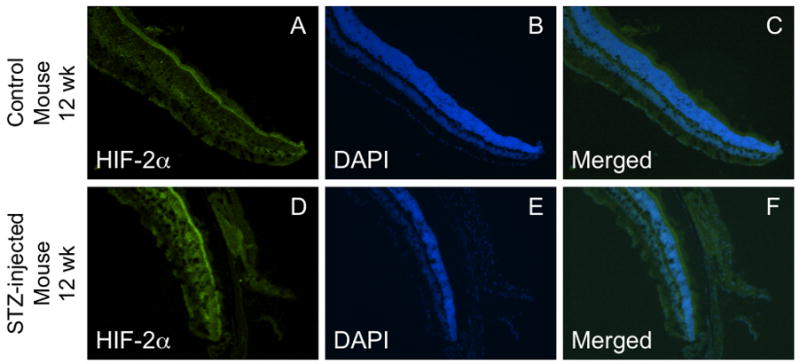
Representative cross-sectional images of HIF-2α staining from the peripheral retina of control and diabetic mice. Panels A and D show HIF-2α staining, panels B and E show the DAPI counterstain, and panels C and F show the merged HIF-2α/DAPI overlay.
3.3. Hypoxia (Anti-pimonidazole) Intensity
Tissue hypoxia was measured using the commercially available Hypoxyprobe™-1 Omni kit following 12 weeks of hyperglycemia. The highest intensity staining for hypoxia in mice was found in the INL+OPL and ONL. There was little difference between control and STZ-injected mice, except for a small decrease in staining intensity in the IPL of the central mouse retina (p<0.05; Fig 7A). Figure 7B shows the intensity staining for hypoxia in the rat following 12 weeks of hyperglycemia compared with age-matched controls. There were significant decreases in hypoxia staining in the STZ-injected rat compared to controls in all layers of the central retina (Figs 7 & 8) and in 4 out of the 5 layers of the peripheral retina. The highest intensity staining in the rat retina was the INL+OPL region, which was similar to the pattern found in the mouse retina. Negative control slides showed insignificant staining in all regions measured (data not shown).
Figure 7.
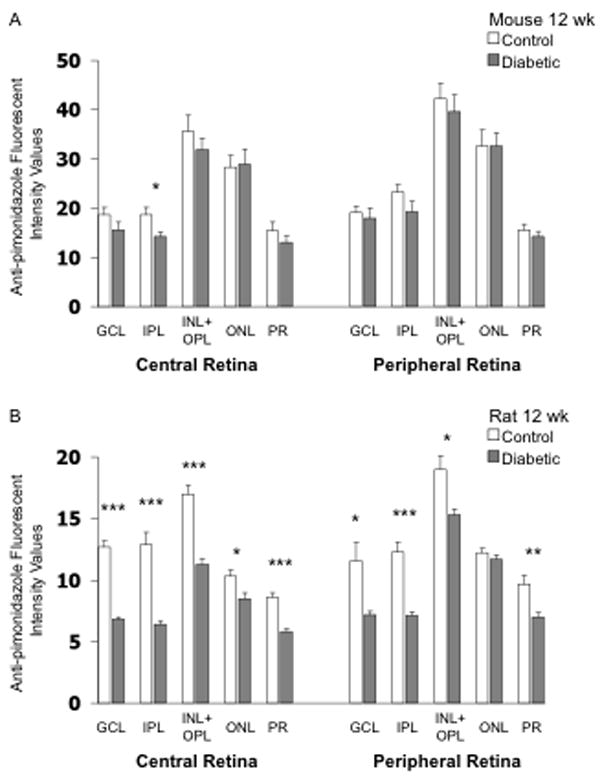
Anti-pimonidazole (hypoxia) fluorescent intensity values in frozen cross-sections of the retina of mice (panel A) and rats (panel B). N= 8 control mice, 6 STZ mice, 7 control rats, and 8 STZ rats, with the STZ injected 12 weeks prior to collection of the eye.
* p<0.05, ** p<0.01, and *** p<0.001 between indicated groups.
Figure 8.
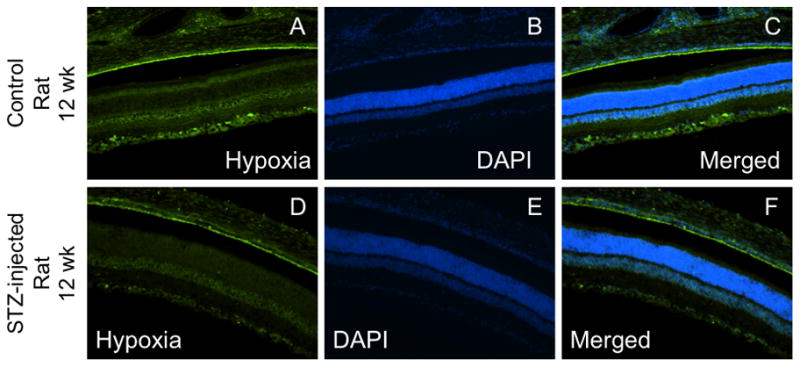
Representative cross-sectional images of anti-pimonidazole (hypoxia) staining from the central retina of control and diabetic rats. Panels A and D show anti-pimonidazole staining, panels B and E show the DAPI counterstain, and panels C and F show the merged anti-pimonidazole/DAPI overlay.
3.4. Outer Nuclear Layer Thickness and Cell Number
The thickness and number of nuclei in the outer nuclear layer of the rat retina were measured following 12 weeks of hyperglycemia, with no differences found between controls and diabetics. The central retinal thickness was 65 ± 3 μm for controls and 70 ± 3 μm for diabetics; the peripheral retinal thickness was 52 ± 2 μm for both groups. The number of nuclei for the central retina was 0.036 ± 0.001 per μm2 for controls and 0.038 ± 0.001 per μm2 for diabetics, and for the peripheral retina, 0.035 ± 0.001 per μm2 for controls and 0.036 ± 0.001 per μm2 for diabetics.
Discussion
The current study adds to the knowledge of retinal expression of HIF-1α, HIF-2α, and retinal tissue hypoxia during hyperglycemia, with immunohistochemistry detailing the layers of localization. As shown by our data and sample images, the HIFs are found throughout the retina, whether in control or in diabetic animals. Our findings of increases in HIF-2α expression in the mouse following 12 weeks of hyperglycemia prompted us to look at tissue hypoxia at this same time point. Interestingly, we found a substantial decrease in retinal tissue hypoxia in the 12-week STZ-injected rat compared to the non-diabetic control.
The constitutive expression of HIFs and the extent of hypoxia staining in the retinas of control animals is not unexpected given the oxygen profile in both rats and mice, that is, an approximate U-shaped pattern of oxygen tension through a cross-section. As previously reported (Yu et al., 1994; Yu and Cringle, S. J., 2006), oxygen partial pressures in rats and mice are 20–25 mmHg at the inner edge of the retina (the ganglion cell layer), decreasing to ~5 mmHg toward the mid-retina, then increasing to a value of ~40 mmHg at the outer edge where the tissue is well-oxygenated by the choroidal circulation. These profiles indicate that significant sections of the mid-retina (especially in mice) are normally maintained in a low oxygen environment below 15 mmHg. However, our staining for HIF-1α and HIF-2α demonstrates substantial expression even in layers where oxygen tension is not that low; for example, we saw quite high intensity staining for HIF-1α in the photoreceptor layer of both rats (Fig 2) and mice.
The low oxygen tensions in the retina are not due to low perfusion, with the retina and choroid of both the mouse and rat having high rates of blood flow per gram of tissue (especially in the mouse). The values of blood flow are not easy to find in the literature, but can be calculated from our intravital microscopic measurements of flow in previous studies. Using values of diameters and blood cell velocities from our studies of C57BL/6 mice (Wright et al., 2009; Wright and Harris, N. R., 2008), retinal flow rates are ~0.023 ml/min, with this value derived from feed arterioles averaging ~60 μm in diameter, red blood cell velocities of ~25 mm/s, and with ~5.4 feed arterioles per retina. Similarly, in Wistar rats, we can calculate values of 0.026 ml/min/retina (Lee et al., 2008), which is slightly higher than the values (0.015–0.016 ml/min/retina) reported for Brown-Norway rats using a microsphere technique (Wang et al., 2008). With the wet weight of the retina being ~2.8 mg in mice (unpublished from our lab) and ~30 mg in rats (Inatani et al., 2000), flow rates per unit weight are ~8 ml/min/g in mice and ~0.5–0.9 ml/min/g in rats. Other tissues in the body typically have lower flow rates averaging ~0.4 ml/min/g, for example, as calculated from the cardiac output and weight of a mouse (10 ml/min divided by 25 g) or rat (100 ml/min divided by 250 g).
Rather than a lack of oxygen delivery to the retina, the cause of low oxygen tensions is related to the high consumption rates of this metabolic tissue (Cringle et al., 2002; Yu and Cringle, S. J., 2006). With much of the retina maintained in an environment of low oxygen concentration, it can be speculated that the expressions of HIF-1α and HIF-2α might be different than in a tissue experiencing a non-physiological transient decrease in oxygenation. Undetermined long-term responses to hyperglycemia and decreased retinal blood flow may explain the fact that HIF-1α and HIF-2α expression may not follow the same U-shaped pattern of oxygen tension, and may also help explain the fact that we did not observe a substantial change in either HIF in rat and mouse models of diabetes in which we find ~30% decreases in retinal blood flow (Lee et al., 2008; Lee and Harris, N. R., 2008; Wright et al., 2009; Wright and Harris, N. R., 2008). However, it should also be considered that the outer retina is oxygenated primarily by the choroidal rather than retinal circulation, and that changes in the choroidal circulation at 4 weeks of STZ-induced diabetes may be different than that of the retina. This possibility is supported by a study of 3-week hyperglycemia induced by STZ (Granstam and Granstam, S. O., 1999), in which choroidal flow showed no decrease at all, while retinal blood flow decreased by 44% (although high variability prevented this 44% decrease from reaching statistical significance). Therefore, a decrease in retinal blood flow, without a decrease in choroidal blood flow, might be expected to increase hypoxia only toward the inner retina, and in contrast to our results, an increase in HIF-1α has indeed been reported for the ganglion cell and inner nuclear layers at a reasonably close time point of two weeks STZ (Poulaki et al., 2004). In contrast to this latter study from STZ-injected rats, NOD mice do not have increased levels of HIF-1α following two weeks or 4 weeks of hyperglycemia (Li et al., 2006). This is interesting to note considering our lab has reported decreases in retinal blood flow blood flow in the NOD mouse following 3 weeks of hyperglycemia (Lee and Harris, N. R., 2008).
To our knowledge there has not been any report of retinal tissue hypoxia in the STZ-injected rat. We found a decrease in hypoxia in the STZ-injected rat retina following 12 weeks of hyperglycemia instead of the expected increase in inner retinal hypoxia as discussed earlier. There are several possible explanations for this decrease. First, although we have reported a decrease in retinal blood flow following 3 weeks of hyperglycemia in rats (Lee et al., 2008), there are no reports of flow (whether altered or not) following 12 weeks of hyperglycemia. It is possible that retinal blood flow increases at later time points following induction of hyperglycemia, which would be consistent with a bi-phasic time course of flow as reported for diabetic humans (Clermont et al., 1997). Second, it is possible that there is a shift from aerobic metabolism to anaerobic metabolism which has previously been discussed in detail (Rimmer and Linsenmeier, R. A., 1993). A shift in aerobic metabolism to anaerobic metabolism in the outer retina would allow for increased oxygen diffusion from the choroidal circulation to the inner retina, adding to the oxygen supplied by the retinal circulation (Yu et al., 2007). The inner retina is where we show the greatest decrease in retinal hypoxia. A third possibility is that there is a diabetes-induced decrease in the in the number of oxygen-consuming photoreceptors as previously reported (Martin et al., 2004; Park et al., 2006; Zhang et al., 2008; Zhang et al., 2009). However, following 12 weeks of hyperglycemia we did not find a difference in the thickness or cell number in the ONL between control and diabetic rats. Despite this lack of morphological changes, it is possible that other physiological modifications are occurring in the outer retina that could decrease energy demand (Kowluru et al., 1998; Ottlecz and Bensaoula, T., 1996).
In summary, we observed a contrasting pattern for staining of HIF-1α and HIF-2α in the mouse retina, with HIF-1α higher in the inner retina than outer, but HIF-2α higher in the outer retina than inner. In rats, staining for both HIF-1α and HIF-2α was more intense in the inner retina. The HIF-1α staining intensities and patterns were similar between 4-week and 12-week STZ animals and their non-diabetic counterparts, but with a tendency for an increase in HIF-2α in the diabetic mouse retina following 4 weeks of hyperglycemia and an even greater tendency for an increase in HIF-2α in the diabetic mouse retina following 12 weeks of hyperglycemia. We observed an unexpected significant decrease in hypoxia in the rat following 12 weeks of hyperglycemia in the rat, with only a trend toward a decrease in the mouse.
Acknowledgments
This study was funded by the National Institutes of Health (EY017599; NRH).
Footnotes
Publisher's Disclaimer: This is a PDF file of an unedited manuscript that has been accepted for publication. As a service to our customers we are providing this early version of the manuscript. The manuscript will undergo copyediting, typesetting, and review of the resulting proof before it is published in its final citable form. Please note that during the production process errors may be discovered which could affect the content, and all legal disclaimers that apply to the journal pertain.
Contributor Information
William S. Wright, Email: wwrigh@lsuhsc.edu.
Robert M. McElhatten, Email: rmcelh@lsuhsc.edu.
Jodine E. Messina, Email: jmessi@lsuhsc.edu.
Norman R. Harris, Email: nharr6@lsuhsc.edu.
Reference List
- Arjamaa O, Nikinmaa M. Oxygen-dependent diseases in the retina: role of hypoxia-inducible factors. Exp Eye Res. 2006;83:473–483. doi: 10.1016/j.exer.2006.01.016. [DOI] [PubMed] [Google Scholar]
- Ayalasomayajula SP, Kompella UB. Celecoxib, a selective cyclooxygenase-2 inhibitor, inhibits retinal vascular endothelial growth factor expression and vascular leakage in a streptozotocin-induced diabetic rat model. Eur J Pharmacol. 2003;458:283–289. doi: 10.1016/s0014-2999(02)02793-0. [DOI] [PubMed] [Google Scholar]
- Chen J, Nathans J. Genetic ablation of cone photoreceptors eliminates retinal folds in the retinal degeneration 7 (rd7) mouse. Invest Ophthalmol Vis Sci. 2007;48:2799–2805. doi: 10.1167/iovs.06-0922. [DOI] [PubMed] [Google Scholar]
- Clermont AC, Aiello LP, Mori F, Aiello LM, Bursell SE. Vascular endothelial growth factor and severity of nonproliferative diabetic retinopathy mediate retinal hemodynamics in vivo: a potential role for vascular endothelial growth factor in the progression of nonproliferative diabetic retinopathy. Am J Ophthalmol. 1997;124:433–446. doi: 10.1016/s0002-9394(14)70860-8. [DOI] [PubMed] [Google Scholar]
- Cringle SJ, Yu DY, Yu PK, Su EN. Intraretinal oxygen consumption in the rat in vivo. Invest Ophthalmol Vis Sci. 2002;43:1922–1927. [PubMed] [Google Scholar]
- de Gooyer TE, Stevenson KA, Humphries P, Simpson DA, Curtis TM, Gardiner TA, Stitt AW. Rod Photoreceptor Loss in Rho−/− Mice Reduces Retinal Hypoxia and Hypoxia-Regulated Gene Expression. Invest Ophthalmol Vis Sci. 2006a;47:5553–5560. doi: 10.1167/iovs.06-0646. [DOI] [PubMed] [Google Scholar]
- de Gooyer TE, Stevenson KA, Humphries P, Simpson DA, Gardiner TA, Stitt AW. Retinopathy Is Reduced during Experimental Diabetes in a Mouse Model of Outer Retinal Degeneration. Invest Ophthalmol Vis Sci. 2006b;47:5561–5568. doi: 10.1167/iovs.06-0647. [DOI] [PubMed] [Google Scholar]
- Gardiner TA, Gibson DS, de Gooyer TE, de lCV, McDonald DM, Stitt AW. Inhibition of tumor necrosis factor-alpha improves physiological angiogenesis and reduces pathological neovascularization in ischemic retinopathy. Am J Pathol. 2005;166:637–644. doi: 10.1016/s0002-9440(10)62284-5. [DOI] [PMC free article] [PubMed] [Google Scholar]
- Granstam E, Granstam SO. Regulation of uveal and retinal blood flow in STZ-diabetic and non-diabetic rats; involvement of nitric oxide. Curr Eye Res. 1999;19:330–337. doi: 10.1076/ceyr.19.4.330.5300. [DOI] [PubMed] [Google Scholar]
- Holmquist-Mengelbier L, Fredlund E, Lofstedt T, Noguera R, Navarro S, Nilsson H, Pietras A, Vallon-Christersson J, Borg A, Gradin K, Poellinger L, Pahlman S. Recruitment of HIF-1alpha and HIF-2alpha to common target genes is differentially regulated in neuroblastoma: HIF-2alpha promotes an aggressive phenotype. Cancer Cell. 2006;10:413–423. doi: 10.1016/j.ccr.2006.08.026. [DOI] [PubMed] [Google Scholar]
- Inatani M, Tanihara H, Oohira A, Honjo M, Kido N, Honda Y. Spatiotemporal expression patterns of 6B4 proteoglycan/phosphacan in the developing rat retina. Invest Ophthalmol Vis Sci. 2000;41:1990–1997. [PubMed] [Google Scholar]
- Ke Q, Costa M. Hypoxia-inducible factor-1 (HIF-1) Mol Pharmacol. 2006;70:1469–1480. doi: 10.1124/mol.106.027029. [DOI] [PubMed] [Google Scholar]
- Kondo T, Kahn CR. Altered insulin signaling in retinal tissue in diabetic states. J Biol Chem. 2004;279:37997–38006. doi: 10.1074/jbc.M401339200. [DOI] [PubMed] [Google Scholar]
- Kowluru RA, Jirousek MR, Stramm L, Farid N, Engerman RL, Kern TS. Abnormalities of retinal metabolism in diabetes or experimental galactosemia: V. Relationship between protein kinase C and ATPases. Diabetes. 1998;47:464–469. doi: 10.2337/diabetes.47.3.464. [DOI] [PubMed] [Google Scholar]
- Lee S, Harris NR. Losartan and ozagrel reverse retinal arteriolar constriction in non-obese diabetic mice. Microcirculation. 2008;15:379–387. doi: 10.1080/10739680701829802. [DOI] [PMC free article] [PubMed] [Google Scholar]
- Lee S, Morgan GA, Harris NR. Ozagrel reverses streptozotocin-induced constriction of arterioles in rat retina. Microvasc Res. 2008;76:217–223. doi: 10.1016/j.mvr.2008.07.005. [DOI] [PMC free article] [PubMed] [Google Scholar]
- Li C, Xu Y, Jiang D, Hong W, Guo X, Wang P, Li W. The expression of HIF-1 in the early diabetic NOD mice. Yan Ke Xue Bao. 2006;22:107–111. [PubMed] [Google Scholar]
- Linsenmeier RA, Braun RD, McRipley MA, Padnick LB, Ahmed J, Hatchell DL, McLeod DS, Lutty GA. Retinal hypoxia in long-term diabetic cats. Invest Ophthalmol Vis Sci. 1998;39:1647–1657. [PubMed] [Google Scholar]
- Martin PM, Roon P, Van Ells TK, Ganapathy V, Smith SB. Death of retinal neurons in streptozotocin-induced diabetic mice. Invest Ophthalmol Vis Sci. 2004;45:3330–3336. doi: 10.1167/iovs.04-0247. [DOI] [PubMed] [Google Scholar]
- Moreno A, De La Cruz JP, Garcia CJ, Sanchez dlC. Prostacyclin-thromboxane balance and retinal vascular pattern in rats with experimentally induced diabetes. Can J Ophthalmol. 1995;30:117–123. [PubMed] [Google Scholar]
- Nangaku M, Inagi R, Miyata T, Fujita T. Hypoxia and hypoxia-inducible factor in renal disease. Nephron Exp Nephrol. 2008;110:e1–e7. doi: 10.1159/000148256. [DOI] [PubMed] [Google Scholar]
- Nishiguchi KM, Kaneko H, Nakamura M, Kachi S, Terasaki H. Identification of photoreceptor precursors in the pars plana during ocular development and after retinal injury. Invest Ophthalmol Vis Sci. 2008;49:422–428. doi: 10.1167/iovs.07-1008. [DOI] [PubMed] [Google Scholar]
- Ottlecz A, Bensaoula T. Captopril ameliorates the decreased Na+,K(+)-ATPase activity in the retina of streptozotocin-induced diabetic rats. Invest Ophthalmol Vis Sci. 1996;37:1633–1641. [PubMed] [Google Scholar]
- Park JW, Park SJ, Park SH, Kim KY, Chung JW, Chun MH, Oh SJ. Up-regulated expression of neuronal nitric oxide synthase in experimental diabetic retina. Neurobiol Dis. 2006;21:43–49. doi: 10.1016/j.nbd.2005.06.007. [DOI] [PubMed] [Google Scholar]
- Pe’er J, Folberg R, Itin A, Gnessin H, Hemo I, Keshet E. Upregulated expression of vascular endothelial growth factor in proliferative diabetic retinopathy. Br J Ophthalmol. 1996;80:241–245. doi: 10.1136/bjo.80.3.241. [DOI] [PMC free article] [PubMed] [Google Scholar]
- Poulaki V, Joussen AM, Mitsiades N, Mitsiades CS, Iliaki EF, Adamis AP. Insulin-like growth factor-I plays a pathogenetic role in diabetic retinopathy. Am J Pathol. 2004;165:457–469. doi: 10.1016/S0002-9440(10)63311-1. [DOI] [PMC free article] [PubMed] [Google Scholar]
- Poulaki V, Qin W, Joussen AM, Hurlbut P, Wiegand SJ, Rudge J, Yancopoulos GD, Adamis AP. Acute intensive insulin therapy exacerbates diabetic blood-retinal barrier breakdown via hypoxia-inducible factor-1alpha and VEGF. J Clin Invest. 2002;109:805–815. doi: 10.1172/JCI13776. [DOI] [PMC free article] [PubMed] [Google Scholar]
- Raleigh JA, Koch CJ. Importance of thiols in the reductive binding of 2-nitroimidazoles to macromolecules. Biochem Pharmacol. 1990;40:2457–2464. doi: 10.1016/0006-2952(90)90086-z. [DOI] [PubMed] [Google Scholar]
- Rimmer T, Linsenmeier RA. Resistance of diabetic rat electroretinogram to hypoxemia. Invest Ophthalmol Vis Sci. 1993;34:3246–3252. [PubMed] [Google Scholar]
- Rossing P. The changing epidemiology of diabetic microangiopathy in type 1 diabetes. Diabetologia. 2005;48:1439–1444. doi: 10.1007/s00125-005-1836-x. [DOI] [PubMed] [Google Scholar]
- Wang L, Grant C, Fortune B, Cioffi GA. Retinal and choroidal vasoreactivity to altered PaCO2 in rat measured with a modified microsphere technique. Exp Eye Res. 2008;86:908–913. doi: 10.1016/j.exer.2008.03.005. [DOI] [PubMed] [Google Scholar]
- Wright WS, Harris NR. Ozagrel attenuates early streptozotocin-induced constriction of arterioles in the mouse retina. Exp Eye Res. 2008;86:528–536. doi: 10.1016/j.exer.2007.12.012. [DOI] [PMC free article] [PubMed] [Google Scholar]
- Wright WS, Messina JE, Harris NR. Attenuation of diabetes-induced retinal vasoconstriction by a thromboxane receptor antagonist. Exp Eye Res. 2009;88:106–112. doi: 10.1016/j.exer.2008.10.008. [DOI] [PMC free article] [PubMed] [Google Scholar]
- Yam JC, Kwok AK. Update on the treatment of diabetic retinopathy. Hong Kong Med J. 2007;13:46–60. [PubMed] [Google Scholar]
- Yu DY, Cringle SJ. Oxygen distribution in the mouse retina. Invest Ophthalmol Vis Sci. 2006;47:1109–1112. doi: 10.1167/iovs.05-1118. [DOI] [PubMed] [Google Scholar]
- Yu DY, Cringle SJ, Alder VA, Su EN. Intraretinal oxygen distribution in rats as a function of systemic blood pressure. Am J Physiol. 1994;267:H2498–H2507. doi: 10.1152/ajpheart.1994.267.6.H2498. [DOI] [PubMed] [Google Scholar]
- Yu DY, Cringle SJ, Yu PK, Su EN. Intraretinal oxygen distribution and consumption during retinal artery occlusion and graded hyperoxic ventilation in the rat. Invest Ophthalmol Vis Sci. 2007;48:2290–2296. doi: 10.1167/iovs.06-1197. [DOI] [PubMed] [Google Scholar]
- Zhang J, Wu Y, Jin Y, Ji F, Sinclair SH, Luo Y, Xu G, Lu L, Dai W, Yanoff M, Li W, Xu GT. Intravitreal injection of erythropoietin protects both retinal vascular and neuronal cells in early diabetes. Invest Ophthalmol Vis Sci. 2008;49:732–742. doi: 10.1167/iovs.07-0721. [DOI] [PubMed] [Google Scholar]
- Zhang Y, Wang Q, Zhang J, Lei X, Xu GT, Ye W. Protection of exendin-4 analogue in early experimental diabetic retinopathy. Graefes Arch Clin Exp Ophthalmol. 2009;247:699–706. doi: 10.1007/s00417-008-1004-3. [DOI] [PubMed] [Google Scholar]