Abstract
Small-world networks are a class of networks that exhibit efficient long-distance communication and tightly interconnected local neighborhoods. In recent years, functional and structural brain networks have been examined using network theory-based methods, and consistently shown to have small-world properties. Moreover, some voxel-based brain networks exhibited properties of scale-free networks, a class of networks with mega-hubs. However, there are considerable inconsistencies across studies in the methods used and the results observed, particularly between region-based and voxel-based brain networks. We constructed functional brain networks at multiple resolutions using the same resting-state fMRI data, and compared various network metrics, degree distribution, and localization of nodes of interest. It was found that the networks with higher resolutions exhibited the properties of small-world networks more prominently. It was also found that voxel-based networks were more robust against network fragmentation compared to region-based networks. Although the degree distributions of all networks followed an exponentially truncated power law rather than true power law, the higher the resolution, the closer the distribution was to a power law. The voxel-based analyses also enhanced visualization of the results in the 3D brain space. It was found that nodes with high connectivity tended have high efficiency, a co-localization of properties that was not as consistently observed in the region-based networks. Our results demonstrate benefits of constructing the brain network at the finest scale the experiment will permit.
Keywords: Resting-state fMRI, small-world network, scale-free network, graph theory, network theory, functional connectivity
Introduction
Two strangers, living hundreds of miles apart, can be reached through just a small number of intermediary acquaintances. This finding, originally reported by Milgram more than four decades ago (Milgram 1967), is widely known as the small-world phenomenon. This idea was combined with graph theory and was formally proposed as small-world networks by Watts and Strogatz in 1998 (Watts and Strogatz 1998). Small-world networks are a class of networks characterized by highly interconnected neighborhoods and efficient long-distance connections, connecting any two nodes in a network with just a few intermediary connections (Strogatz 2001). In a small-world network, the efficacy of long distance communication can be quantified by a metric known as the characteristic path length L (Stam and Reijneveld 2007; Watts and Strogatz 1998). L is the average of shortest distances between any two nodes in a network, in terms of the number of edges separating them or the geodesic distance. L is considerably small in a small-world network, and is comparable to that of a random network, a network resulting from connecting nodes at random. Equally important to a small-world network is tight local interconnections among neighboring nodes, a property that can be quantified by the clustering coefficient C (Stam and Reijneveld 2007; Watts and Strogatz 1998). C represents the probability that a node’s neighbors are also neighbors to each other. In a social science analogy, C is the probability that one’s friends are also friends of each other. C of a small-world network is very large relative to that of a similarly sized random network, summarizing the cliquishness of nodes in local neighborhoods. A network with small L and large C is typical of a small-world network, and many networks have been shown to exhibit such small-world properties, including the network of Hollywood actors, the nervous system of caenorhabditis elegans, and power grids (Watts and Strogatz 1998).
Equally intriguing as small-world networks is a class of complex networks known as scale-free networks (Barabasi and Albert 1999). In a scale-free network, degree (denoted by k), or the number of edges at each node, is highly heterogeneous; while the vast majority of nodes are connected to just a few other nodes, a very few nodes have extremely high degrees and act as hubs in the network. Such disparity in the node degree can be identified from the probability distribution plot of k for all the nodes in the network. Such plots may indicate that k follows a fat tail distribution known as a power law distribution, with mega-hubs at the extreme tail of the distribution. The degree distributions from many real networks, however, have exponentially truncated power law distributions that still have some hubs, but not as many as found in a scale-free network with a power law distribution (Amaral, et al. 2000; Lusseau and Newman 2004; Mossa, et al. 2002; Newman 2005).
Characterization of the above network properties in the brain as a unified system has recently become an exciting research focus. The nervous systems of mammals such as cats and monkeys have been shown to exhibit small-world network properties based on histologically identified regional connections (Hilgetag, et al. 2000; Honey and Sporns 2008; Sporns, et al. 2007; Sporns and Zwi 2004). Neuronal synchrony in the cat visual cortex has also been reported to exhibit small-world characteristics using an Ising model (Yu, et al. 2008). Small-world characteristics of structural and anatomical connectivity have also been examined in the human brain (Bullmore and Sporns 2009) using various in-vivo imaging methods, such as diffusion tensor imaging (DTI) (Gong, et al. 2009; Iturria-Medina, et al. 2008), diffusion spectrum imaging (Hagmann, et al. 2008; Hagmann, et al. 2007), and cortical thickness analysis (He, et al. 2008; He, et al. 2007). Similarly, functional imaging techniques such as functional MRI (fMRI) and magnetoencephalography (MEG) have been used to evaluate the properties of functional networks (Achard, et al. 2006; Bassett, et al. 2006; Buckner, et al. 2009; Cecchi, et al. 2007; Eguiluz, et al. 2005; Reijneveld, et al. 2007; Stam 2004; Supekar, et al. 2008; van den Heuvel, et al. 2008).
A particular advantage of structural and functional imaging data is that the entire brain can be imaged at once. Therefore, the full brain network can be characterized in anatomically accurate brain space and evaluated in a single analysis. This can be done by constructing a region-based network with nodes corresponding to anatomically-defined regions of interests (ROIs) (Achard, et al. 2006; Bassett, et al. 2006; Gong, et al. 2009; He, et al. 2007; Iturria-Medina, et al. 2008), or by constructing a voxel-based network treating each voxel as a network node (Buckner, et al. 2009; Cecchi, et al. 2007; Eguiluz, et al. 2005; van den Heuvel, et al. 2008).
Although both types of networks model the same biological system, the human brain, a striking difference between the two types of network has been reported, namely the distribution of node degree k. Interestingly, voxel-based functional brain networks have been reported as scale-free networks (Cecchi, et al. 2007; Eguiluz, et al. 2005; van den Heuvel, et al. 2008) with the degree distribution following a power law distribution, but this has not been observed in region-based networks (Achard, et al. 2006; Bassett, et al. 2006; Gong, et al. 2009; He, et al. 2007; Iturria-Medina, et al. 2008). The distribution from region-based networks is not truly scale-free but follows an exponentially truncated power law distribution (Achard, et al. 2006; Gong, et al. 2009; He, et al. 2007). Although the reason for the discrepancy is unclear, it may be due to difference in data processing steps in constructing the brain network (Bullmore and Sporns 2009). Another possible reason for the discrepancy is the difference in the scale of these networks; while voxel-based networks represent a mid-scale or mesoscopic organization of the brain, region-based networks represent a coarser macroscopic organization of the brain. Thus the granularity of local network topology may not be accurately represented in region-based networks.
Another remarkable difference between the region-based and voxel-based networks is their ability to localize nodes with interesting characteristics in the brain space. Although computationally burdensome, voxel-based network analyses (Cecchi, et al. 2007; Eguiluz, et al. 2005; van den Heuvel, et al. 2008) are able to localize hubs to particular anatomical areas since each node has a 3D voxel coordinate in the brain. Visualizing node characteristics in the brain space facilitates identification of interesting nodes as well as their topological and spatial relationships with other areas of the brain. Although both region-based and voxel-based network analyses have consistently identified the posterior cingulate cortex (PCC) and the nearby precuneus (PCun) as highly connected nodes, or hubs (Buckner, et al. 2009; Hagmann, et al. 2008; van den Heuvel, et al. 2008), only voxel-based networks allow further localization of hub nodes within these anatomical areas.
The main goal of this work is to compare network characteristics between region-based and voxel-based brain networks. To do so, the same resting-state fMRI data were used to construct region-based networks and voxel-based networks. In particular, we focused on contrasting the network characteristics as the whole, as well as localization of important network nodes. Since the same data set was used in both region-based and voxel-based networks, any difference between these two types of networks can be attributed to the difference in the network construction processes while eliminating confounding factors such as differences in imaging modalities and subject variability.
Materials and Methods
Image Acquisition
fMRI data from 10 normal subjects were included in this analysis (5 female, average age 27.7 years old [4.7 SD]). These subjects were part of a larger study with selection criteria reported elsewhere (Peiffer, et al. 2009). In brief, for each subject, 120 images were acquired during 5 minutes of resting using a gradient echo echo-planar imaging (EPI) protocol with TR/TE = 2500/40 ms on a 1.5T GE twin-speed LX scanner with a birdcage head coil (GE Medical Systems, Milwaukee, WI). The acquired images were motion corrected, spatially normalized to the MNI (Montreal Neurological Institute) space and re-sliced to 4×4×5 mm voxel size using an in-house processing script based on SPM99 package (Wellcome Trust Centre for Neuroimaging, London, UK). In order to avoid artificially introducing local spatial correlation, the resulting images were not smoothed (van den Heuvel, et al. 2008).
Creating Brain Networks
For each subject, Pearson correlation coefficients were calculated between the node time courses of all possible combinations of node pairs, corrected for physiological noise and motion. To do so, we followed a processing stream widely used in connectivity analyses of fMRI data (Fox, et al. 2005; van den Heuvel, et al. 2008). Specifically, to correct for physiological noise, the spatially normalized fMRI time series for each subject was first band-pass filtered (0.009 – 0.08 Hz) to reduce respiratory and other physiological noises. Moreover, the mean time courses from the entire brain, the deep white matter, and the ventricles were regressed out from the filtered time series. The mean time course from the entire brain was obtained by averaging the voxel values within the brain parenchyma mask consisting of gray matter and white matter voxels. The mean time course from the ventricles was obtained by averaging voxels within the ventricles using the ventricle mask produced by WFU PickAtlas Tool (Maldjian, et al. 2003). The mean deep white matter time course was obtained as the average time course in a sphere of 8mm radius positioned in the anterior portion of the right centrum semiovale comprising of solely white matter voxels. The same mask images for the whole brain, ventricles, and deep white matter were used in all the subjects’ data processing. To account for subject motion, the 6 rigid-body motion parameters from the motion correction process were also regressed out from the time series. For a region-based network, node time courses were obtained by averaging the voxel time courses in 90 distinct anatomical areas defined by the AAL (Anatomical Automatic Labeling) atlas (Tzourio-Mazoyer, et al. 2002). For a voxel-based network, each voxel time course was treated as a node time course in the gray matter area corresponding to the AAL atlas. Functional connectivity analyses were performed on the above denoised motion-corrected time series by calculating Pearson correlation coefficients between all node pairs, resulting in correlation matrices of 90×90 for the region-based networks and approximately 16,000×16,000 for the voxel-based networks.
Each correlation matrix was thresholded and converted to a binary adjacency matrix with 1 indicating the presence and 0 indicating the absence of an edge between two nodes. Any two nodes were considered functionally connected if the correlation coefficient between them achieved a correlation threshold R. To define the network at the same connection strength across subjects and in different network scales (region-based vs. voxel-based), we applied correlation threshold R ranging from 0.4 to 0.7 in 0.1 increments. The lower bound R=0.4 was chosen to ensure that the adjacency matrix was sufficiently sparse for the network metric calculation for the voxel-based networks (van den Heuvel, et al. 2008). The upper bound R=0.7 was chosen to avoid excessive fragmentation of region-based networks. We also defined the networks so that the relationship between the number of nodes N and the average node degree K is the same across different subjects and network scales. In particular, we defined the network in a way that S=log(N)/log(K) is the same across subjects and network scales, with S=2.0 to 4.0 in 0.5 increments. S represents the path length of an Erdos-Rényi random network with N nodes and average degree K (Watts and Strogatz 1998), and can describe the relationship between N and K as N=KS. Since the path length of a network with N and K is the shortest when the network is of Erdos-Rényi type, with S=log(N)/log(K) (Watts and Strogatz 1998), our S value can be seen as the lower bound of the path length L. By matching S values, we expected that both region-based and voxel-based networks would have the similar path length. The range of S (2.0 – 4.0) was representative of the range of path lengths of various functional and structural region-based networks from the literature (see Table 2 of He et al., (2007)). It is possible to generate networks in different scales by matching the sparsity or cost (K/N) (Wang, et al. 2009). However, matching the cost across the network scales inherently assumes that the number of edges increases linearly as the number of nodes increases. Although this may be a reasonable assumption if the magnitude of the scale difference is small (Wang, et al. 2009), down-sampling a network to just 1/4 of its original size has been shown to increase K (Kim 2004), indicating that the relationship between N and K may not be linear. Since there was an approximately 170-fold difference in sizes in terms of N between the region-based and voxel-based networks, we did not match the networks across the scales by the cost.
Global Network Metrics
Various network metrics were calculated to assess small-world properties of each network. To calculate the characteristic path length L, the distance matrix describing geodesic distances between all possible node pairs was calculated by Dijkstra’s algorithm (Dijkstra 1959) as implemented in the MatlabBGL package (David Gleich; Stanford University, Stanford, CA). Since some nodes and subgraphs could be isolated from the rest of network, having the geodesic distance of infinity to/from the other nodes in the network, the path length L was calculated as the harmonic mean of geodesic distances, as suggested by Latora & Marchiori (Latora and Marchiori 2001; Newman 2003). In particular, L was calculated as
where dij is the geodesic distance between nodes i and j. The clustering coefficient C was also calculated using MatlabBGL. Network metrics C and L of a corresponding hypothetical random network were also calculated for each network, denoted by Crand and Lrand. These random network metrics were calculated as the average of C and L from 30 random networks having the same N and degree distribution as the original network. Each random network was generated by randomly reconnecting each edge in the original network on average of 10 times to annihilate any local neighborhood structure while preserving the original degree distribution (Maslov and Sneppen 2002; Newman, et al. 2001). The algorithm for random network generation was implemented by a function in the Brain Connectivity Tool Library (Computational Cognitive Neuroscience Laboratory; Indiana University, Bloomington, IN, USA). Although random networks have efficient long distance connections, manifested in small Lrand, their local interconnections are very limited, resulting in small Crand. Small-world properties are often identified by comparing C and L from the brain network to Crand and Lrand of the corresponding random networks, with the ratio γ=C/ Crand being large due to strongly connected neighborhoods and the ratio λ=L/Lrand being close to one due to efficient long distance connections. These two ratios are summarized in the small-world metric σ = γ/ λ, with σ > 1 indicating the small-world characteristic of a network (Humphries and Gurney 2008; Humphries, et al. 2006).
Intermediate Network Resolutions
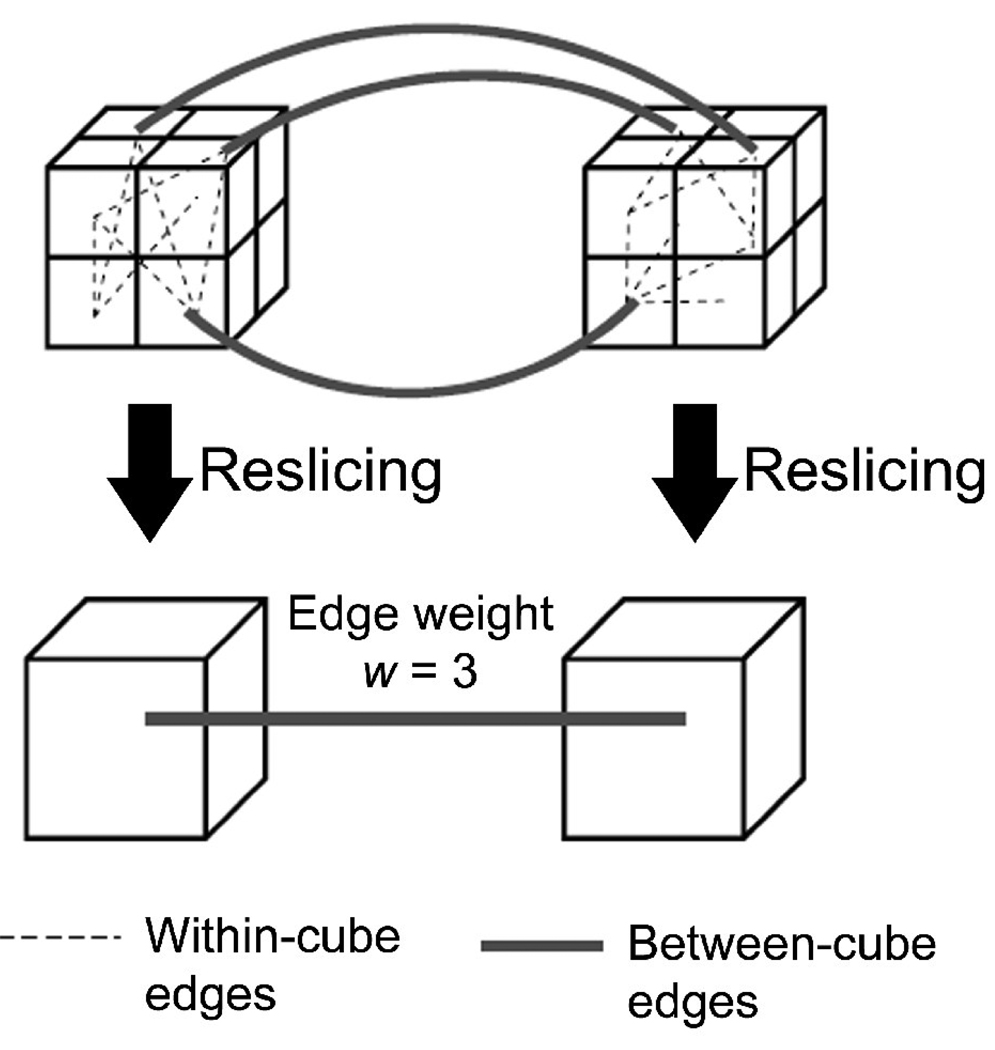
To investigate the influence of the network granularity further, we down-sampled the voxel-based networks to create networks with fewer nodes, and investigated the properties of the resliced networks. The reslicing process was done by following the Kadanoff block spin renormalization group procedure in a 3D voxel space (Kim 2004). First, nodes in each voxelbased network were mapped in a 3D lattice according to their voxel coordinates, representing the network in a 3D voxel space. Then each 2×2×2 voxel cube in the 3D voxel space was resliced as a single voxel, merging nodes within the cube to form a single node (see Figure 1). Edges within the cube were disregarded while edges connecting distinct cubes were retained. The number of edges between each cube pair was recorded as the connection weight w for the edge between the resliced cubes. This coarse graining procedure is known to increase node degrees in the resulting resliced network (Kim 2004). Thus, to maintain the similar S value in the resliced network as the original voxel-based network, the edge weights w were thresholded to form a network matching the S value of the original voxel-based network as closely as possible. This thresholding procedure produced a binary adjacency matrix describing a resliced network in a coarser scale. This reslicing procedure was repeated twice for each voxel-based network, effectively reducing the voxel size to 1/23 = 1/8 of the original network in each reslicing step.
Figure 1.
A schematic of the coarse graining procedure in a 3D voxel space. Nodes in each 2×2×2 voxel cube were merged together to form a single node in the resliced space. While edges within each cube were disregarded, nodes connecting a cube pair were retained. The number of edges connecting two cubes was used as the edge weight between the cubes.
Local Node Metrics
As alternative to L and C, metrics known as efficiency can also quantify efficient long-distance communication and tight local inter-connections in a small-world network, denoted by Eglob and Eloc, respectively (Latora and Marchiori 2001). These efficiency metrics are on the scale from 0 to 1, with 0 being least efficient and 1 being the most efficient. While these metrics can be calculated for the entire network as a whole, they can also be calculated locally at each node separately (Wang, et al. 2009). Such node metrics enable identification of important nodes, and since each node has a 3D coordinate, the identified nodes can be projected onto a 3D brain space. In particular, the node global efficiency Eglob(i) is calculated as
where dij is the shortest geodesic distance or the smallest number of edges between nodes i and j. The node local efficiency Eloc(i) is calculated as the global efficiency of the subgraph Gi, a graph consisting of nodes connected to i but i itself is absent.
In addition to the nodal efficiency metrics above, node degree k was also projected back to the original 3D brain space. In the 3D degree image, hubs were identified as the most connected nodes with high degree k, as done in previous brain small-world analyses (Buckner, et al. 2009; Hagmann, et al. 2008; van den Heuvel, et al. 2008).
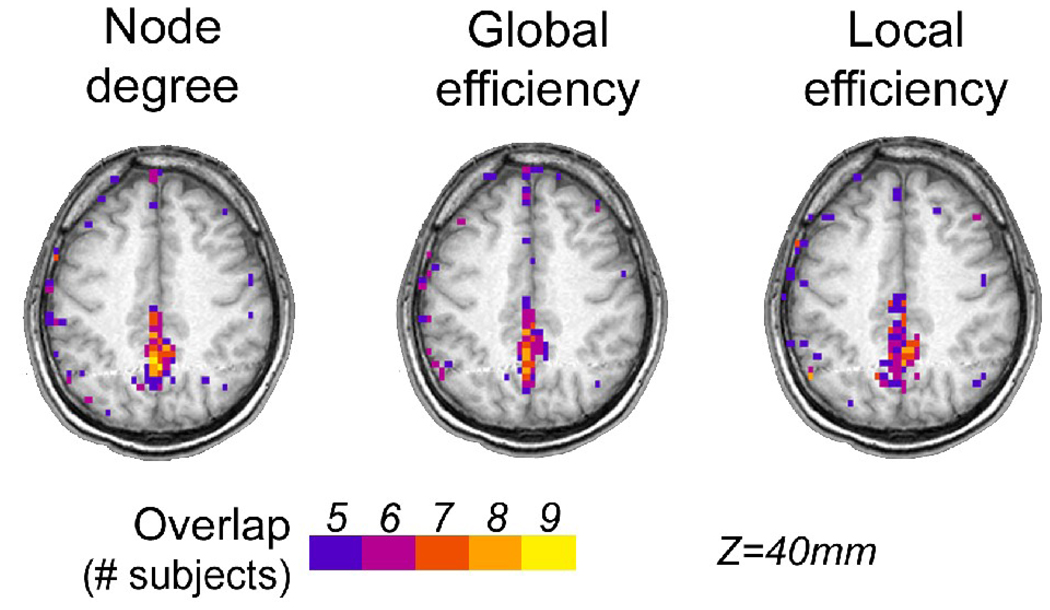
Finally, any consistent patterns in the locations of important nodes were examined by generating an overlap image for each nodal metric. This was done by identifying nodes with top 20% node metric values (k, Eglob, or Eloc) in each subject, and by counting the occurrence of the high node metric across subjects. This procedure would result in an overlap image with each voxel corresponding to the count of subjects with the high node metric at that specific voxel location. Since all voxel-based networks were analyzed in the normalized space, voxel coordinates were comparable across subjects, thus such overlap maps could be generated in this study.
Results
Global Network Metrics
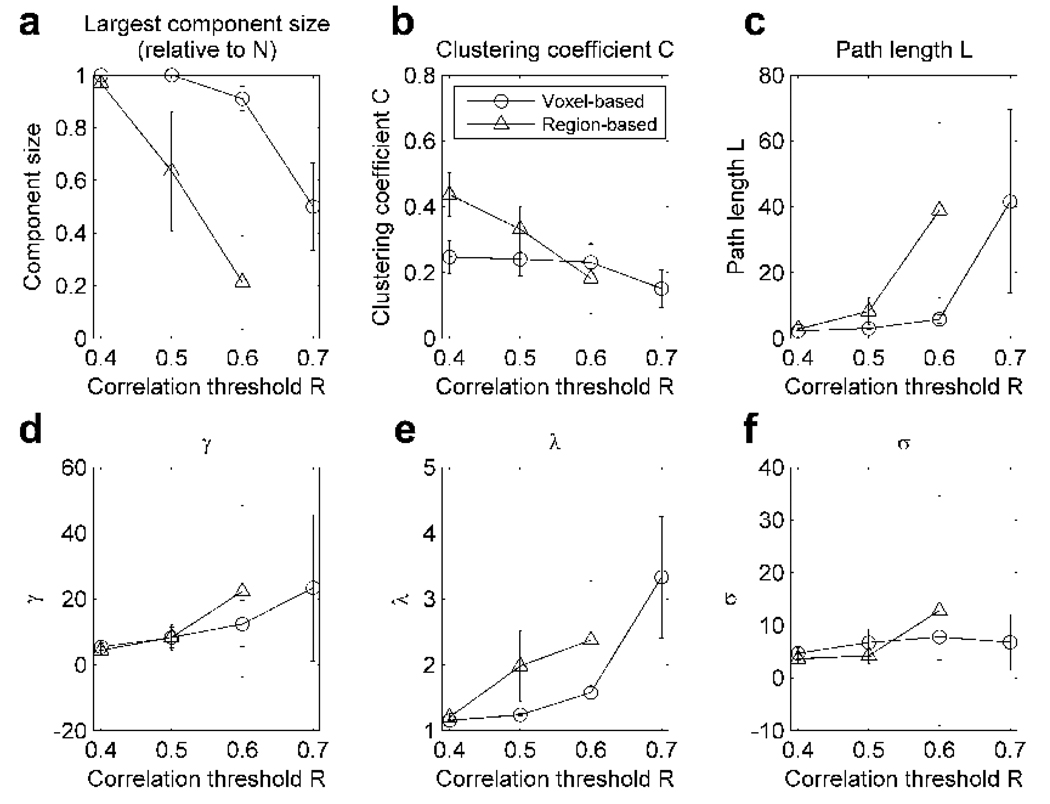
A region-based network and a voxel-based network were produced for each subject. Figure 2 shows the mean and standard deviation of various network metrics obtained at different correlation thresholds R. For R=0.70 threshold, the region-based networks fragmented tremendously, resulting in 7 out of 10 subjects with the largest component having less than 10 nodes. Thus the network metrics for this threshold was not calculated for the region-based networks. The largest component size in Figure 2a refers to the number of nodes in the largest connected component divided by the number of all available network nodes N. As noted above, higher the threshold R, the more fragmented the networks became, more so in the region-based networks. This suggests that the region-based networks are less robust against higher thresholds. While the variability in C did not change dramatically in both region-based and voxel-based networks (see Figure 2b), higher R thresholds seemed to increase the variability across subjects in other statistics in Figure 2. In particular, the variability in L, γ, and λ was considerably larger for R=0.6 in the region-based networks and R=0.7 for the voxel-based networks (Figure 2c, d, and e, respectively). These results indicated that defining networks based on the connection strength R may not be appropriate for across subject comparisons.
Figure 2.
The mean and standard deviation of various network metrics from the voxel-based and region-based networks defined at different correlation coefficient thresholds R. The metrics are: (a) the number of nodes in the largest connected component divided by all the available nodes N, (b) clustering coefficient C, (c) path length L, (d) γ=C/ Crand, (e) λ=L/Lrand, and (f) small-world metric σ = γ/ λ.
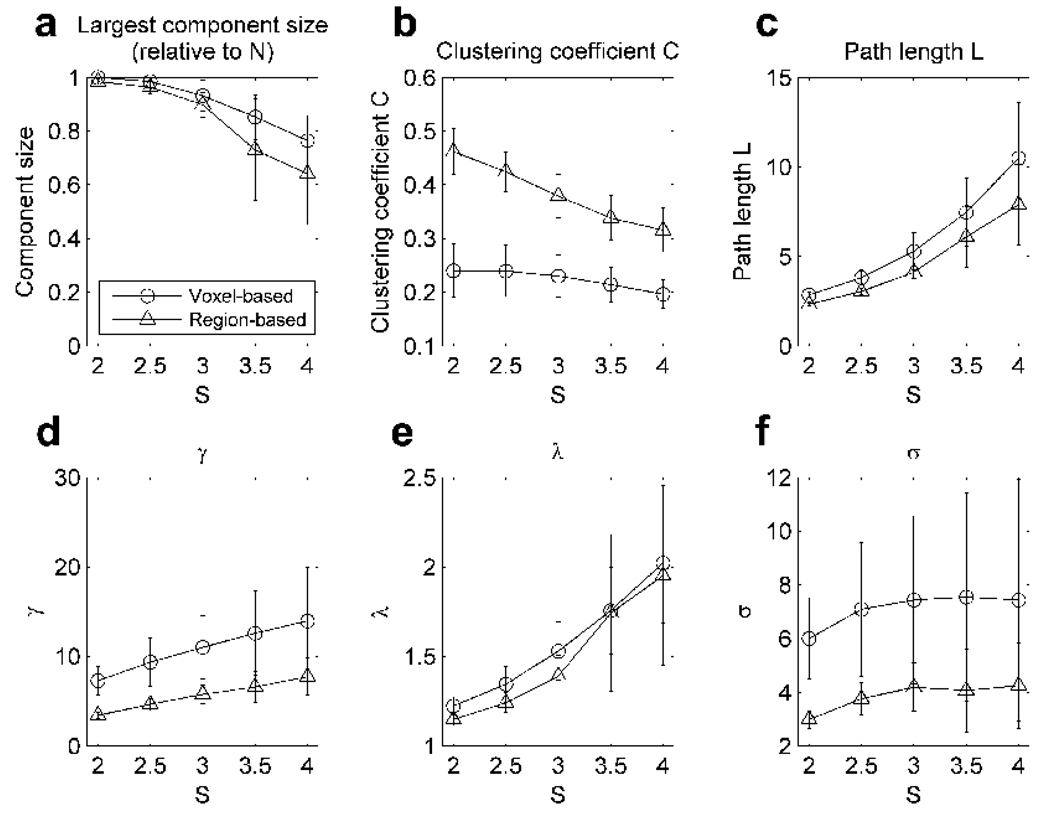
Figure 3 shows the mean and standard deviation of the network metrics obtained for the networks generated with various S values. The network metrics from this thresholding procedure were contrasted to those obtained by setting a specific connection strength R (Figure 2). The effects of higher thresholds, corresponding to higher values of S, included an increase in L, γ, and λ (Figure 3c, d and e, respectively). Although the region-based networks had larger values of C compared to the voxel-based networks (see Figure 3b), relative to comparable random networks, γ was actually higher among the voxel-based networks, indicating a higher likelihood of clustering than by chance alone. Overall, both region-based and voxel-based networks were small-world networks as indicated by σ >1, but the voxel-based networks produced consistently higher σ than the region-based networks. The variability in the metrics presented in Figure 3 seemed to decrease using S thresholds compared to the variability of the same metrics calculated for various R thresholds. This was probably due to the fact that the networks were matched by their sizes, resulting in similar network metrics across subjects. It should also be noted that the network fragmentation was less severe for the region-based networks (Figure 3a), since the S thresholds were adjusted to preserve a certain level of connectivity in terms of the average degree K. Another interesting finding was that L and λ were very similar between the region-based and voxel-based networks, despite the 170-fold difference in the size of the networks. This may be because the S value was motivated by the shortest possible path length of an Erdos-Rényi random network, implicitly producing networks with similar path lengths. Thus, in order to compare the network across subjects or across scales, matching the S value during the thresholding process may be more practical than matching the correlation threshold R.
Figure 3.
The mean and standard deviation of various network metrics from the voxel-based and region-based networks defined at different values of S, which is defined as S=log(N)/log(K) or N=KS. The metrics are: (a) the number of nodes in the largest connected component divided by all the available nodes N, (b) clustering coefficient C, (c) path length L, (d) γ=C/ Crand, (e) λ=L/Lrand, and (f) small-world metric σ = γ/ λ.
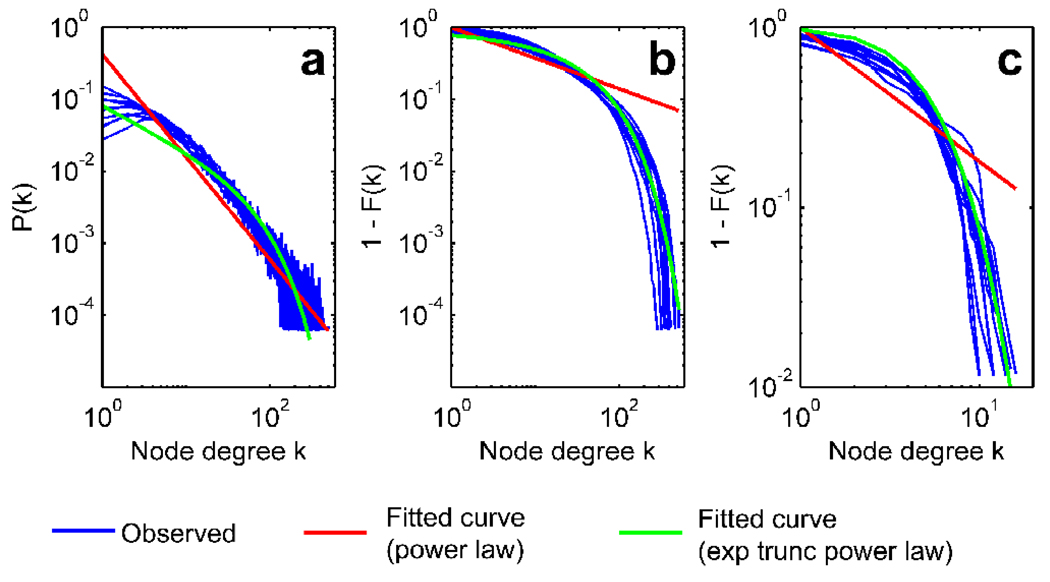
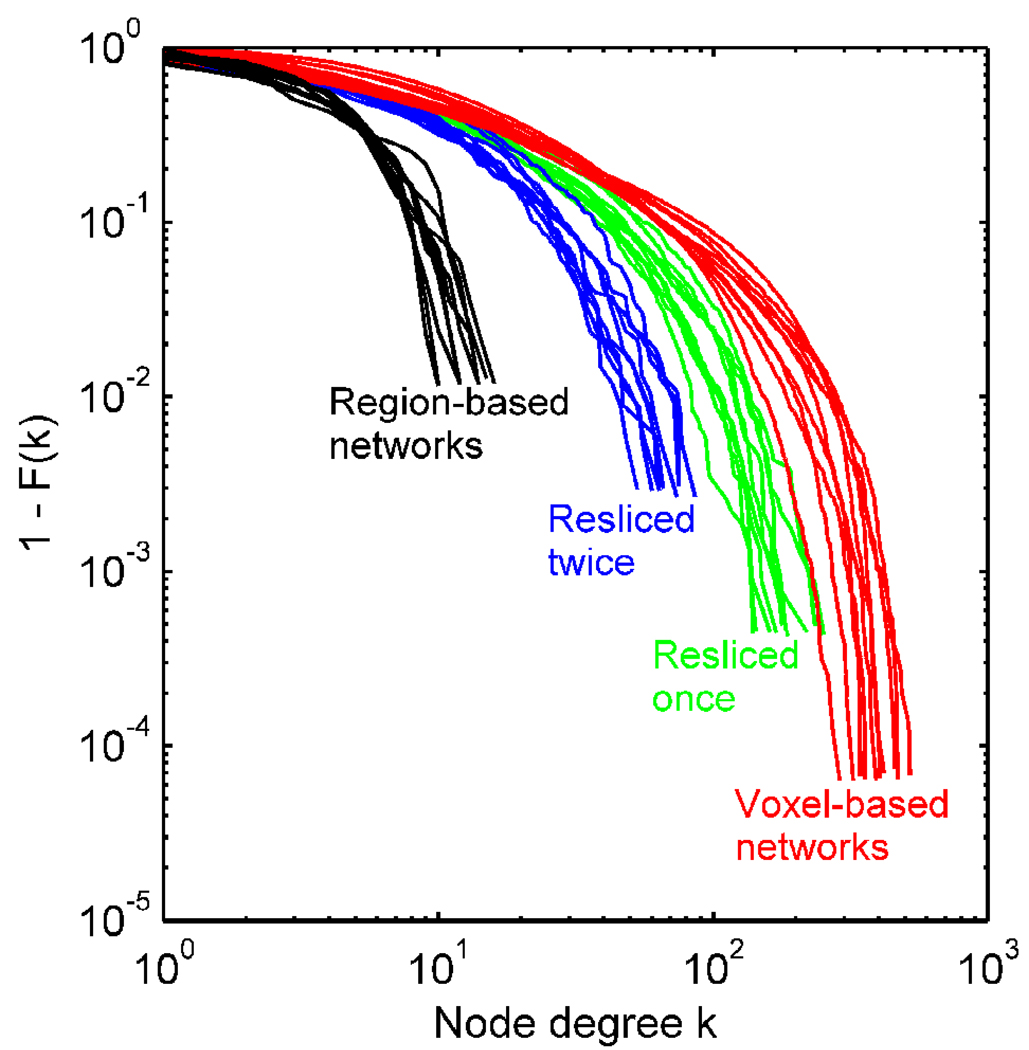
Figure 4 shows the degree distributions resulting from the voxel-based and region-based networks for S=3.0. Figure 4(a) shows the degree distributions of the voxel-based networks plotted on a log-log scale. For all the subjects, the degree distribution P(k) appears to follow a straight line as seen in other voxel-based networks previously reported (Cecchi, et al. 2007; Eguiluz, et al. 2005; van den Heuvel, et al. 2008), indicative of a power law distribution P(k) ∝ k−β with β ≈ 1.4 (red line, Figure 4a). However, the tail of the distributions exhibited increased uncertainty, giving an appearance of a fuzzy tail. To understand the distribution profile better (Keller 2005), we calculated the cumulative distribution F(k)=Σk’<k P(k) and plotted the complementary cumulative distribution 1-F(k) on a log-log scale in Figure 4b. If the distribution were truly a power law distribution, then the plot of 1-F(k) would also follow a straight line (Keller 2005). Instead, the distributions decayed faster than a power law distribution, and followed an exponentially truncated power law distribution P(k) ∝ k−β exp(-k/θ) (green curve with −β=−0.62 and θ=76.0, Figure 4b). Figure 4c shows the log-log plots of 1−F(k) from the region-based networks. The distributions were curved, showing an accelerated decay for higher k. These distributions also followed an exponentially truncated power law. As a reference, Figure 4c also shows the best-fit curve with −β = 1.75 and θ = 1.87. These parameters were within a similar range as other region-based functional and anatomical brain networks (Achard, et al. 2006; Bassett, et al. 2006; Gong, et al. 2009; He, et al. 2007; Iturria-Medina, et al. 2008).
Figure 4.
Node degree distributions from the voxel-based and region-based networks: the probability distributions P(k) from the voxel-based networks (a), the complimentary cumulative distributions 1 − F(k) from the voxel-based networks (b), and the complementary cumulative distributions from the region-based networks (c). The networks were defined at S=3.0. The best-fit curves of a power law distribution and an exponentially truncated power law distribution are also shown.
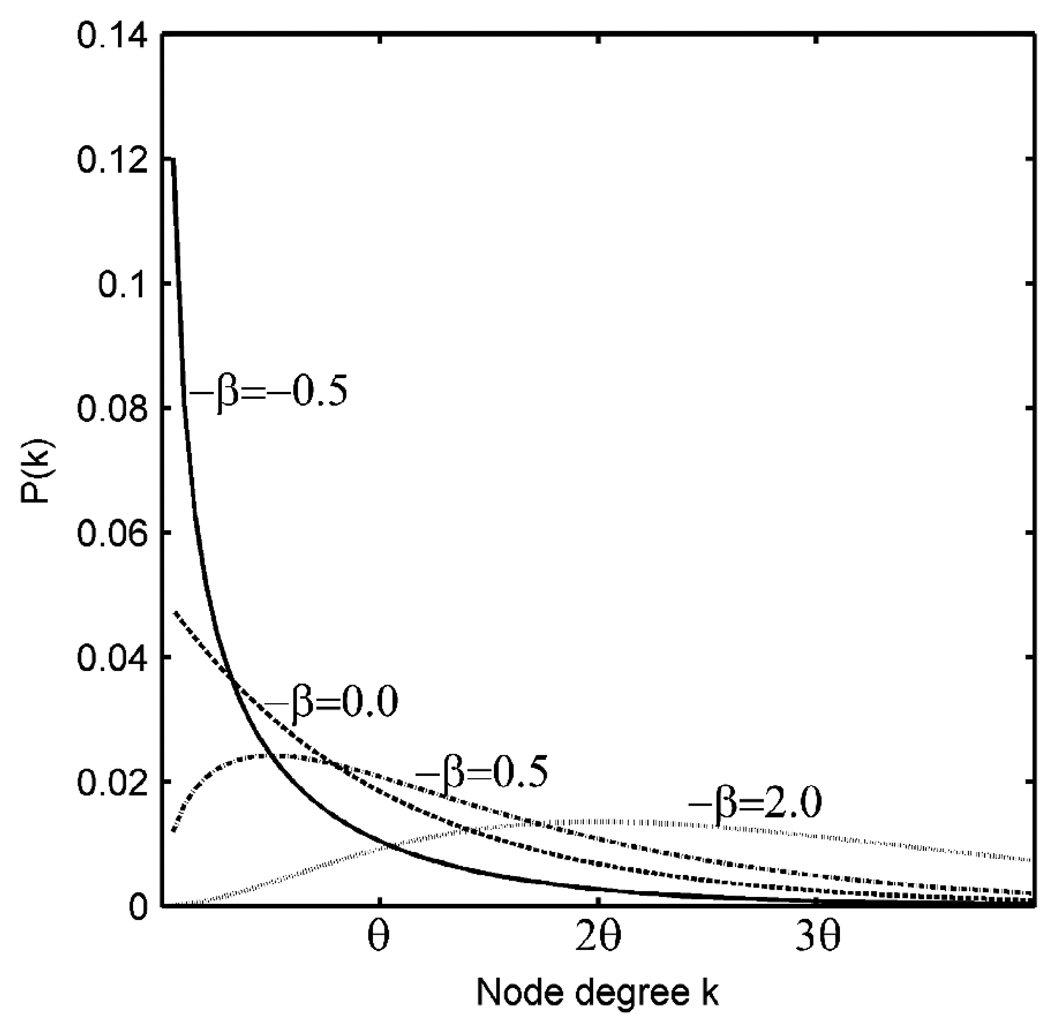
Interestingly, the characteristics of the exponentially truncated power law distributions were different between the region-based and voxel-based networks. In particular, in the voxelbased networks, the exponent of k, −β, was negative, whereas in the region-based networks, the exponent was positive. This difference in the sign of the exponent can be considered conceptually as the difference in prevalence of low degree nodes in the network. The schematic in Figure 5 compares the probability density function P(k) of exponentially truncated power law distributions with different exponent parameters −β. As it can be seen in the figure, distributions with positive exponents (i.e., −β >0), as in the region-based networks, have few low degree nodes. This suggests that low degree nodes may be underrepresented in the region-based networks.
Figure 5.
Probability density functions P(k) of exponentially truncated power law distributions with different exponent parameters −β.
Intermediate Network Resolutions
Figure 6 shows the degree distributions for the voxel-based networks with and without reslicing, as well as that of the region-based networks at S=3.0. They all followed exponentially truncated power law distributions but with different parameters. Table 1 shows the mean parameter estimates of −β and θ for the distribution curve P(k) ∝ k−β exp(−k/θ) at different network scales, as well as other network metrics. As the network resolution increased from a coarse macroscopic representation to a finer mesoscopic representation at the original voxel size, the exponent of k (i.e., −β) decreased. The cut-off parameter θ on the other hand increased as the number of nodes increases in finer representations of the network. These results indicated that the degree distributions at different network resolutions followed a continuum of exponentially truncated power law distributions. It was also found that the network metrics γ, λ, and σ decreased as the networks became coarser.
Figure 6.
Node degree distributions 1 − F(k) of the voxel-based networks, without and with reslicing by a coarse graining procedure. The degree distributions of the region-based networks are also shown.
Table 1.
The various network metrics and parameter estimates for voxel-based networks with different scales
| Network | N | C | L | γ | λ | σ | −β | θ |
|---|---|---|---|---|---|---|---|---|
| Voxel-based networks | 15996 | 0.23 | 5.29 | 11.02 | 1.53 | 7.44 | −0.62 | 75.97 |
| Resliced once | 2767 | 0.26 | 5.72 | 5.93 | 1.28 | 4.65 | −0.46 | 32.72 |
| Resliced twice | 481 | 0.28 | 5.78 | 3.32 | 1.15 | 2.90 | −0.11 | 12.84 |
| Region-based networks | 90 | 0.38 | 4.13 | 5.76 | 1.39 | 4.18 | 1.75 | 1.87 |
Compared to these resliced networks, it is interesting to note that the region-based networks did not fit in the trend in various parameters presented in Table 1. The region-based networks seemed to fit on the other end of the spectrum of the parameters −β and θ, with −β being positive and θ being much smaller than that of the other networks. Moreover, the other network metrics of the region-based networks, such as γ, λ, and σ, seemed to fit in between the same metrics from the once-resliced and twice-resliced networks. These peculiarities of the region-based network parameters may be due to the fact that the region-based networks were formed in a different mechanism than the coarse graining rocedure described in Figure 1.
Local Node Metrics
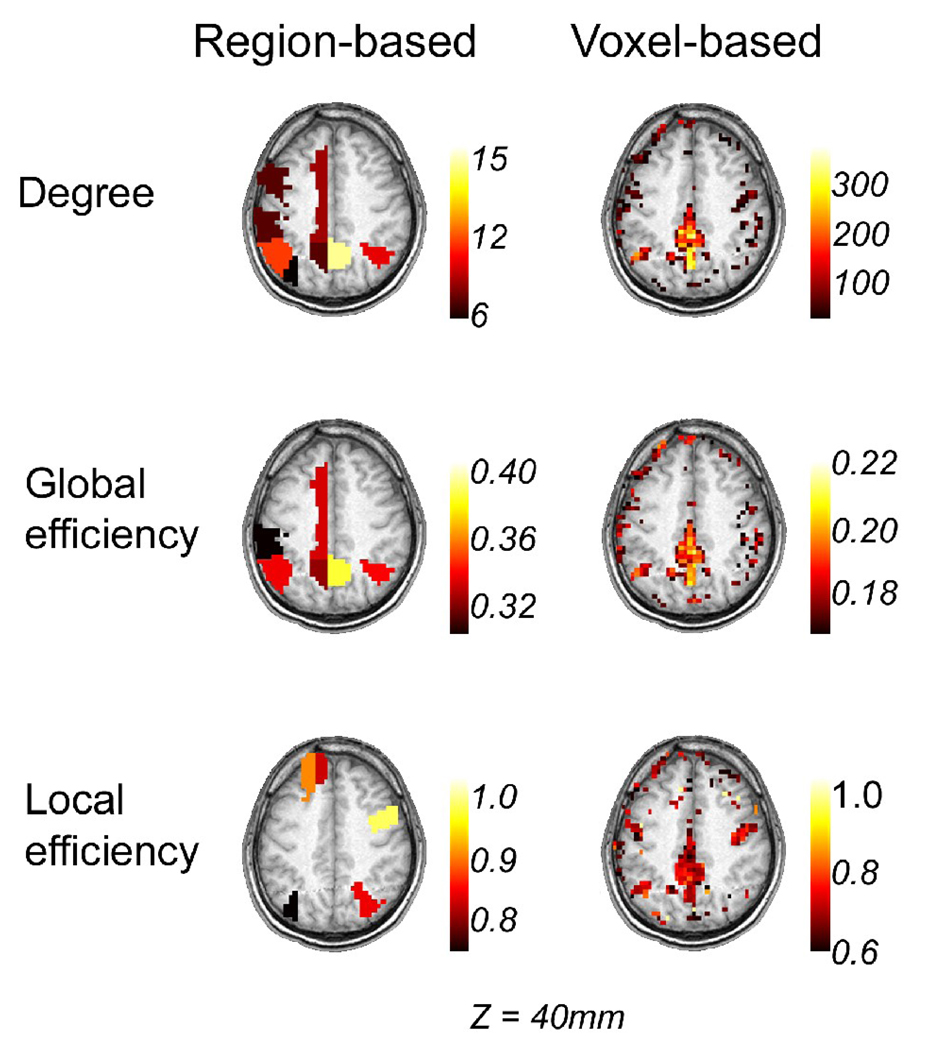
Figure 7 shows node metrics (k, Eglob, and Eloc) from one of the subjects obtained at S=3.0, projected onto the brain space according to the voxel coordinates. As it can be seen from the figure, areas with high metrics (top 20%) can be localized more easily in the voxel-based network (Figure 7, right) compared to the region-based network (Figure 7, left). Although both networks demonstrated that high-degree and high-global efficiency nodes were located in the precuneus (PCun) and posterior cingulate cortex (PCC), the voxel-based network demonstrated spatial clustering of high degree voxels and allowed precise localization of these nodes without making a priori assumptions using anatomical constraints. The results from the voxel-based network (Figure 7, right) also indicated that high-degree nodes coincided with high-efficiency nodes, both global and local. This was not the case for the region-based network (Figure 7, left). For example, multiple areas in the left frontal cortex exhibited high local efficiency but not high degree in the region-based network. In addition, several areas exhibited high degree and high global efficiency (PCC, PCun, and left medial cingulate) but did not exhibit high local efficiency.
Figure 7.
Node metrics for the region-based (left column) and voxel-based (right column) networks of a single subject (subject 6) defined at S=3.0. Node degrees (first row) as well as global (second row) and local (third row) efficiencies are shown. The images are shown in the neurological convention, with the subject’s left side displayed on the left side.
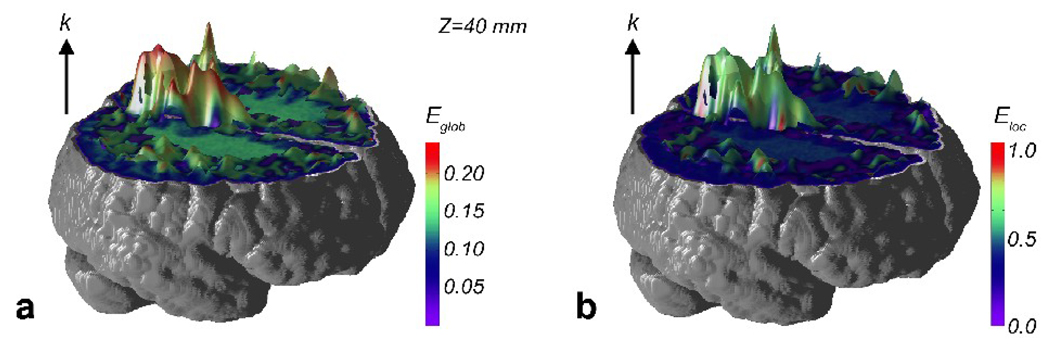
To further evaluate the relationship between the node degree and efficiency, we plotted the node degree k and an efficiency metric (global or local) together as surface plots for the voxel-based network. In Figure 8, the surface height is indicative of the value of k and the surface color the node efficiency metric. From these surface plots, it can be seen that high degree peaks generally corresponded to areas of high efficiency in green and red, most prominently in PCC and PCun.
Figure 8.
Surface plots of the node degree k of a single subject (subject 6) defined at S=3.0, with the surface colors corresponding to nodal efficiency metrics: (a) node global efficiency Eglob and (b) node local efficiency Eloc.
To investigate whether or not the results on the local node metrics above were reproducible across subjects, we compared locations of high-degree and high-efficiency nodes across subjects. This was done by counting the occurrence of the high node metrics (top 20% of node degree k, global efficiency Eglob, and local efficiency Eloc) and projecting the overlap counts in the 3D brain space as an image as seen in Figure 9. The overlap patterns were similar across the three metrics, with PCun and PCC being the areas with the highest concentration of overlaps. Interestingly the results are strikingly similar to that based on the anatomical connectivity from DSI data (Hagmann, et al. 2008).
Figure 9.
Spatial overlap of top 20% node degree (left), global efficiency (middle), and local efficiency (right) across subjects in the voxel-based networks defined at S=3.0. The images are shown in the neurological convention, with the subject’s left side displayed on the left side.
Discussion
In this study, the same data set was used to construct both region-based and voxel-based network from the same subject, enabling us to focus on the network property differences purely due to averaging of data in anatomical regions, as this is the only difference between the region-based and voxel-based networks. From our analyses, we found that the voxel-based networks were more clustered than the region-based networks, yielding higher g in general. The voxel-based networks thus appeared to be more small-worldly than the region-based networks, although both networks were small-world networks.
We also found that the degree distributions from the voxel-based networks followed exponentially truncated power law distributions as in the region-based networks. However, the parameters in the degree distribution differed depending on the scale at which the network was formed. The exponent of k in an exponentially truncated power law distribution seemed to increase as the network resolution became coarser in the resliced networks, consistent with the finding by Wang et al. comparing 70-node vs. 90-node networks (Wang, et al. 2009). Unlike the voxel-based networks or the resliced networks, the region-based networks had a positive exponent of k. A positive exponent of k can also be seen as low degree nodes being underrepresented in the region-based networks. This finding provides further evidence that the network formed at a higher resolution is more representative of the real system. It should be noted that, however, the region-based networks based on the AAL atlas exhibited somewhat different characteristics compared to the resliced networks, in terms of the degree distribution and network metrics. Thus the region-based networks should not be considered simply as a downscaled version of voxel-based networks. A more appropriate intermediate resolution network between the voxel-based networks and the region-based networks can be formed by the anatomo-functional parcellation proposed by Thirion et al (2006).
In addition to all of the differences between the region-based and voxel-based networks described above, one remarkable advantage of studying the functional brain network at the voxel-level rather than at the region-level is the spatial localization ability. For example, the high-degree area in the PCC seen in the voxel-based network was centered in the middle of 3 different ROIs in the region-based network (Figure 7 left). However the union of these 3 ROIs comprised a much larger area compared to the extent of the high-degree nodes in the corresponding location in the voxel-based network (Figure 7 right). It should also be noted that some ROIs in the region-based network comprised a larger number of voxels compared to other ROIs. A larger ROI may be connected to more nodes just by the fact that a variety of voxels are included in that ROI. However, the region-based network analysis does not have any correction mechanism to account for the difference in the spatial extent of ROIs. Unlike a region-based network, a voxel-based network is not constrained by the assumption that voxels from the same anatomical regions are similar that they can be averaged to form a larger node. There is also an important advantage of voxel-based network data compared to other types of network data. In other types of networks, such as social, technological, or biological networks, each individual node may not have the spatial coordinate information associated with it, resulting in visualization of network nodes with an arbitrary spatial configuration. On the other hand, any node in a voxel-based network has a 3D spatial coordinate in the brain, hence any node metric can be readily visualized in the form of a 3D image. Such visualization enables not only the localization of important nodes, but also examinations of anatomical and spatial relationships among them.
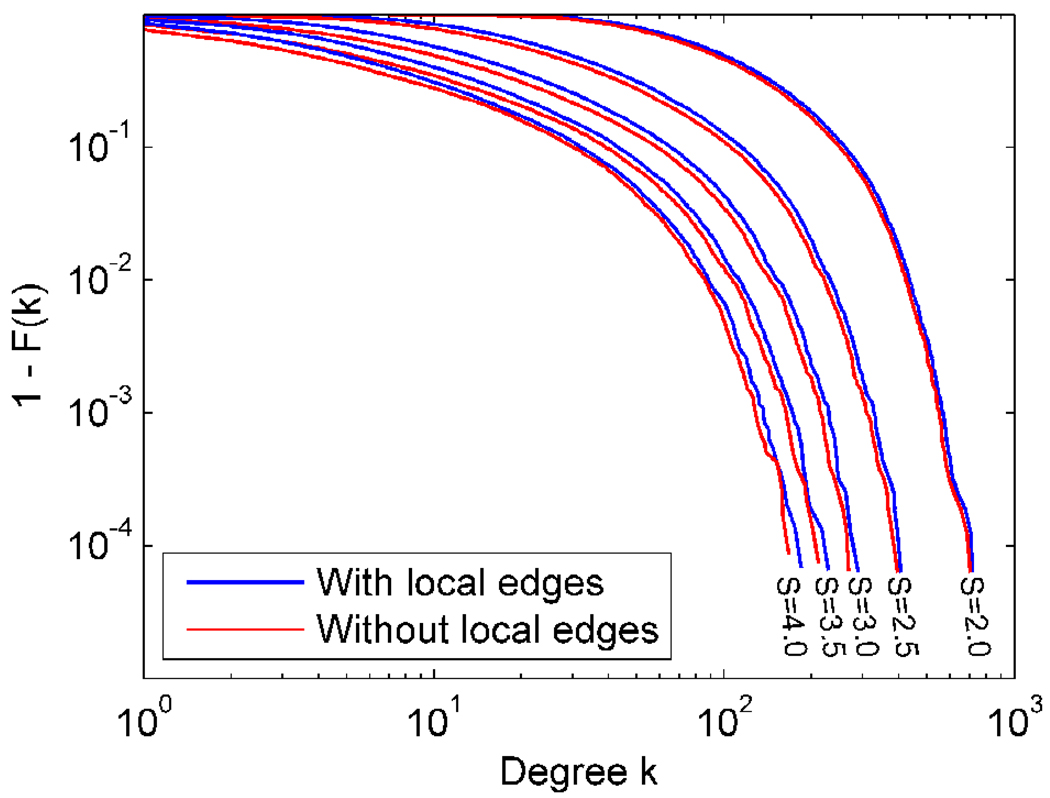
One possible concern in an analysis of a voxel-based network is that local spatial correlations may manifest as edges even though there may not be direct functional connectivity. In order to avoid local correlations as much as possible, the spatially normalized data were not spatially smoothed in this study. However, the spatial normalization process itself could introduce local correlations which could bias the structure of the network. To examine potential effects of local correlations on network metrics, we deleted local edges connecting spatially neighboring voxels in the voxel-based network in one of the subjects and recalculated some network metrics. Spatially neighboring voxels were defined by the 26-connectivity scheme, in which 26 voxels sharing at least one vertex with a given voxel were considered as its neighbors. From this analysis, it was found that C reduced and L increased due to deletion of local edges (see Table 2). The magnitude of the changes was larger for higher thresholds (i.e., larger S values). The degree distribution did not change dramatically despite the deletion of local edges (see Figure 10). From these findings, it can be seen that the effect of local correlations increases as the threshold increases.
Table 2.
Various network metrics of a voxel-based network from a single subject with and without local edges
| Threshold | Largest Component Size (relative to N) |
Clustering Coefficient | Path Length | |||
|---|---|---|---|---|---|---|
| With local edges |
Without local edges |
With local edges |
Without local edges |
With local edges |
Without local edges |
|
| S=2.0 | 1.000 | 1.000 | 0.18 | 0.16 | 2.7 | 2.7 |
| S=2.5 | 1.000 | 0.999 | 0.18 | 0.15 | 3.3 | 3.4 |
| S=3.0 | 0.988 | 0.957 | 0.19 | 0.13 | 4.1 | 4.6 |
| S=3.5 | 0.948 | 0.833 | 0.19 | 0.11 | 5.2 | 6.9 |
| S=4.0 | 0.886 | 0.695 | 0.18 | 0.10 | 6.7 | 10.9 |
Figure 10.
Degree distributions of voxel-based networks from a single subject formed at different S thresholds, with and without local edges connecting spatially neighboring nodes.
Analyses of the degree distributions demonstrated that the brain networks in this study followed an exponentially truncated power law (Achard, et al. 2006; Gong, et al. 2009; He, et al. 2007) rather than a power law (Cecchi, et al. 2007; Eguiluz, et al. 2005; van den Heuvel, et al. 2008), an issue that had remained unresolved in the literature (Bullmore and Sporns 2009). Our data showed that if the degree distributions themselves were plotted as done in some previous studies (Eguiluz, et al. 2005; van den Heuvel, et al. 2008), the data appeared to follow a power law (Figure 4(a)). When the data were transformed to one minus the cumulative distribution, the exponentially truncated power law became evident. Thus, one should evaluate the fit of the cumulative distribution rather the probability distribution itself. Furthermore, the data demonstrated that degree distributions represented a continuum of exponentially truncated power law distributions as seen in Figure 6. Finer scales seemed to decrease the exponent −β and increase the cut-off parameter θ, making the distribution resemble a more scale-free pattern. A previous work has suggested that sub-samples of scale-free networks are not necessarily scale-free (Stumpf, et al. 2005). On the other hand, another work has suggested that coarse graining of a scale-free network preserves the scale-free property (Kim 2004). Thus, it is not clear if the brain network exhibits scale-free properties at its highest resolution. Our work suggests that coarser networks, such as region-based networks or resliced networks, exhibit greater truncation than voxel-based networks with higher granularity and possibly under representing low degree nodes.
Although we were able to compare the voxel-based and region-based networks across subjects and to demonstrate their differences in this study, there were some issues to be considered in future studies. First, although our use of S values enabled us to reduce the inter-subject variability in some network metrics, it is not clear which S value would be appropriate for a comparison of networks with different scales or resolutions. As it can be seen in Figure 3a, higher values of S tend to fragment region-based networks somewhat. However, lower values of S would result in a network with a larger number of edges, which could pose a computational challenge in calculating network metrics C and L in a voxel-based network. In our analyses, we focused on the networks defined at S=3.0 as a middle ground. However, there needs to be a further examination of S values in the future. Secondly, to the best of our knowledge, there is no established method to assess node metrics (k, Eglob, and Eloc) across subjects. It is possible to use a statistical parametric mapping (SPM)-type approach to compare node metrics (Buckner, et al. 2009; van den Heuvel, et al. 2008). However, such approaches may place too much emphasis on identifying significant nodes and shift the focus away from the underlying network in which these nodes are simply building blocks. A network theory-based method of a cross-subject analysis, taking advantage of the underlying network topology, is thus much desired. Lastly, our analyses were based on unweighted networks in order to reduce computational burdens, particularly for the voxel-based networks. This may eliminate the useful information on how strongly two nodes are connected. The calculation algorithms for C and L used in this study can be applied to a weighted network if the network is sufficiently small (Iturria-Medina, et al. 2008). Thus optimization of these computational algorithms is highly desired on voxel-based networks, since the use of weighted networks avoids the arbitrary nature of the thresholding procedure altogether.
In summary, we were able to compare the network properties of the region-based and voxel-based brain networks, for the entire network as well as at the node level. Both types of networks were small-world networks exhibiting highly clustered neighborhoods and efficient long-distance connections. Despite the tremendous difference in the numbers of nodes and edges, the path length was comparable between the two types of networks. However, the voxel-based networks exhibited higher relative clustering when compared to the equivalent random network, resulting in higher small-worldness σ. We also were able to highlight differences between the region-based and voxel-based networks in the degree distribution profile. Finally, mapping the network metrics back into the 3D brain space revealed that the fine granularity of the voxel-based analyses was preferable, and this process identified areas where high degree and high efficiency were co-localized. Based on these findings, we conclude that voxel-based networks exhibit many desirable properties that are not available in region-based networks. Thus, despite intensive computational burdens associated with a large number of nodes and the need for a thresholding procedure, there are distinct benefits of modeling the brain network at the highest resolution possible for any given study.
Acknowledgments
This work was supported by the Translational Scholar Award to SH from the Translational Science Institute of Wake Forest University. Data collection for this work was supported by the National Institute of Health (NS042658), as well as the Roena Kulynych Memory and Cognition Research Center and the General Clinical Research Center (RR07122) of Wake Forest University. We would like to thank Drs. Ann Peiffer and Christina Hugenschmidt for collecting the data.
Footnotes
Publisher's Disclaimer: This is a PDF file of an unedited manuscript that has been accepted for publication. As a service to our customers we are providing this early version of the manuscript. The manuscript will undergo copyediting, typesetting, and review of the resulting proof before it is published in its final citable form. Please note that during the production process errors may be discovered which could affect the content, and all legal disclaimers that apply to the journal pertain.
References
- Achard S, Salvador R, Whitcher B, Suckling J, Bullmore E. A resilient, low-frequency, small-world human brain functional network with highly connected association cortical hubs. J Neurosci. 2006;26(1):63–72. doi: 10.1523/JNEUROSCI.3874-05.2006. [DOI] [PMC free article] [PubMed] [Google Scholar]
- Amaral LAN, Scala A, Barthelemy M, Stanley HE. Classes of small-world networks. Proceedings of the National Academy of Sciences of the United States of America. 2000;97(21):11149–11152. doi: 10.1073/pnas.200327197. [DOI] [PMC free article] [PubMed] [Google Scholar]
- Barabasi AL, Albert R. Emergence of scaling in random networks. Science. 1999;286(5439):509–512. doi: 10.1126/science.286.5439.509. [DOI] [PubMed] [Google Scholar]
- Bassett DS, Meyer-Lindenberg A, Achard S, Duke T, Bullmore E. Adaptive reconfiguration of fractal small-world human brain functional networks. Proceedings of the National Academy of Sciences of the United States of America. 2006;103(51):19518–19523. doi: 10.1073/pnas.0606005103. [DOI] [PMC free article] [PubMed] [Google Scholar]
- Buckner RL, Sepulcre J, Talukdar T, Krienen FM, Liu H, Hedden T, Andrews-Hanna JR, Sperling RA, Johnson KA. Cortical hubs revealed by intrinsic functional connectivity: mapping, assessment of stability, and relation to Alzheimer's disease. J Neurosci. 2009;29(6):1860–1873. doi: 10.1523/JNEUROSCI.5062-08.2009. [DOI] [PMC free article] [PubMed] [Google Scholar]
- Bullmore E, Sporns O. Complex brain networks: graph theoretical analysis of structural and functional systems. Nature Review Neuroscience. 2009;10(3):186–198. doi: 10.1038/nrn2575. [DOI] [PubMed] [Google Scholar]
- Cecchi GA, Rao AR, Centeno MV, Baliki M, Apkarian AV, Chialvo DR. Identifying directed links in large scale functional networks: application to brain fMRI. BMC Cell Biology. 2007;8 Suppl 1:S5. doi: 10.1186/1471-2121-8-S1-S5. [DOI] [PMC free article] [PubMed] [Google Scholar]
- Dijkstra EW. A note on two problems in connexion with graphs. Numerische Mathematik. 1959;1:269–271. [Google Scholar]
- Eguiluz VM, Chialvo DR, Cecchi GA, Baliki M, Apkarian AV. Scale-free brain functional networks. Physical Review Letters. 2005;94(1):018102. doi: 10.1103/PhysRevLett.94.018102. [DOI] [PubMed] [Google Scholar]
- Fox MD, Snyder AZ, Vincent JL, Corbetta M, Van Essen DC, Raichle ME. The human brain is intrinsically organized into dynamic, anticorrelated functional networks. Proceedings of the National Academy of Sciences of the United States of America. 2005;102(27):9673–9678. doi: 10.1073/pnas.0504136102. [DOI] [PMC free article] [PubMed] [Google Scholar]
- Gong G, He Y, Concha L, Lebel C, Gross DW, Evans AC, Beaulieu C. Mapping anatomical connectivity patterns of human cerebral cortex using in vivo diffusion tensor imaging tractography. Cereb Cortex. 2009;19(3):524–536. doi: 10.1093/cercor/bhn102. [DOI] [PMC free article] [PubMed] [Google Scholar]
- Hagmann P, Cammoun L, Gigandet X, Meuli R, Honey CJ, Wedeen VJ, Sporns O. Mapping the structural core of human cerebral cortex. PLoS Biology. 2008;6(7):e159. doi: 10.1371/journal.pbio.0060159. [DOI] [PMC free article] [PubMed] [Google Scholar]
- Hagmann P, Kurant M, Gigandet X, Thiran P, Wedeen VJ, Meuli R, Thiran JP. Mapping human whole-brain structural networks with diffusion MRI. PLoS ONE. 2007;2(7):e597. doi: 10.1371/journal.pone.0000597. [DOI] [PMC free article] [PubMed] [Google Scholar]
- He Y, Chen Z, Evans A. Structural insights into aberrant topological patterns of large-scale cortical networks in Alzheimer's disease. J Neurosci. 2008;28(18):4756–4766. doi: 10.1523/JNEUROSCI.0141-08.2008. [DOI] [PMC free article] [PubMed] [Google Scholar]
- He Y, Chen ZJ, Evans AC. Small-world anatomical networks in the human brain revealed by cortical thickness from MRI. Cereb Cortex. 2007;17(10):2407–2419. doi: 10.1093/cercor/bhl149. [DOI] [PubMed] [Google Scholar]
- Hilgetag CC, Burns GA, O'Neill MA, Scannell JW, Young MP. Anatomical connectivity defines the organization of clusters of cortical areas in the macaque monkey and the cat. Philosophical Transactions of the Royal Society B: Biological Sciences. 2000;355(1393):91–110. doi: 10.1098/rstb.2000.0551. [DOI] [PMC free article] [PubMed] [Google Scholar]
- Honey CJ, Sporns O. Dynamical consequences of lesions in cortical networks. Hum Brain Mapp. 2008;29(7):802–809. doi: 10.1002/hbm.20579. [DOI] [PMC free article] [PubMed] [Google Scholar]
- Humphries MD, Gurney K. Network 'small-world-ness': a quantitative method for determining canonical network equivalence. PLoS ONE. 2008;3(4):e0002051. doi: 10.1371/journal.pone.0002051. [DOI] [PMC free article] [PubMed] [Google Scholar]
- Humphries MD, Gurney K, Prescott TJ. The brainstem reticular formation is a small-world, not scale-free, network. Proc Biol Sci. 2006;273(1585):503–511. doi: 10.1098/rspb.2005.3354. [DOI] [PMC free article] [PubMed] [Google Scholar]
- Iturria-Medina Y, Sotero RC, Canales-Rodriguez EJ, Aleman-Gomez Y, Melie-Garcia L. Studying the human brain anatomical network via diffusion-weighted MRI and Graph Theory. Neuroimage. 2008;40(3):1064–1076. doi: 10.1016/j.neuroimage.2007.10.060. [DOI] [PubMed] [Google Scholar]
- Keller EF. Revisiting "scale-free" networks. Bioessays. 2005;27(10):1060–1068. doi: 10.1002/bies.20294. [DOI] [PubMed] [Google Scholar]
- Kim BJ. Geographical Coarse Graining of Complex Networks. Physical Review Letters. 2004;93:168701. doi: 10.1103/PhysRevLett.93.168701. [DOI] [PubMed] [Google Scholar]
- Latora V, Marchiori M. Efficient behavior of small-world networks. Physical Review Letters. 2001;87(19):198701. doi: 10.1103/PhysRevLett.87.198701. [DOI] [PubMed] [Google Scholar]
- Lusseau D, Newman MEJ. Identifying the role that animals play in their social networks. Proceedings of the Royal Society of London Series B-Biological Sciences. 2004;271:S477–S481. doi: 10.1098/rsbl.2004.0225. [DOI] [PMC free article] [PubMed] [Google Scholar]
- Maldjian JA, Laurienti PJ, Kraft RA, Burdette JH. An automated method for neuroanatomic and cytoarchitectonic atlas-based interrogation of fMRI data sets. Neuroimage. 2003;19(3):1233–1239. doi: 10.1016/s1053-8119(03)00169-1. [DOI] [PubMed] [Google Scholar]
- Maslov S, Sneppen K. Specificity and stability in topology of protein networks. Science. 2002;296(5569):910–913. doi: 10.1126/science.1065103. [DOI] [PubMed] [Google Scholar]
- Milgram S. The small world problem. Psychology Today. 1967;2:60–67. [Google Scholar]
- Mossa S, Barthelemy M, Stanley HE, Amaral LAN. Truncation of power law behavior in "scale-free" network models due to information filtering. Physical Review Letters. 2002;88(13) doi: 10.1103/PhysRevLett.88.138701. [DOI] [PubMed] [Google Scholar]
- Newman MEJ. The structure and function of complex networks. SIAM Review. 2003;45:167–256. [Google Scholar]
- Newman MEJ. Power laws, Pareto distributions and Zipf's law. Contemporary Physics. 2005;46(5):323–351. [Google Scholar]
- Newman MEJ, Strogatz SH, Watts DJ. Random graphs with arbitrary degree distributions and their applications. Physical Review E. 2001;6402(2) doi: 10.1103/PhysRevE.64.026118. [DOI] [PubMed] [Google Scholar]
- Peiffer AM, Hugenschmidt CE, Maldjian JA, Casanova R, Srikanth R, Hayasaka S, Burdette JH, Kraft RA, Laurienti PJ. Aging and the interaction of sensory cortical function and structure. Hum Brain Mapp. 2009;30(1):228–240. doi: 10.1002/hbm.20497. [DOI] [PMC free article] [PubMed] [Google Scholar]
- Reijneveld JC, Ponten SC, Berendse HW, Stam CJ. The application of graph theoretical analysis to complex networks in the brain. Clinical Neurophysiology. 2007;118(11):2317–2331. doi: 10.1016/j.clinph.2007.08.010. [DOI] [PubMed] [Google Scholar]
- Sporns O, Honey CJ, Kotter R. Identification and classification of hubs in brain networks. PLoS ONE. 2007;2(10):e1049. doi: 10.1371/journal.pone.0001049. [DOI] [PMC free article] [PubMed] [Google Scholar]
- Sporns O, Zwi JD. The small world of the cerebral cortex. Neuroinformatics. 2004;2(2):145–162. doi: 10.1385/NI:2:2:145. [DOI] [PubMed] [Google Scholar]
- Stam CJ. Functional connectivity patterns of human magnetoencephalographic recordings: a 'small-world' network? Neuroscience Letters. 2004;355(1–2):25–28. doi: 10.1016/j.neulet.2003.10.063. [DOI] [PubMed] [Google Scholar]
- Stam CJ, Reijneveld JC. Graph theoretical analysis of complex networks in the brain. Nonlinear Biomedical Physics. 2007;1(1):3. doi: 10.1186/1753-4631-1-3. [DOI] [PMC free article] [PubMed] [Google Scholar]
- Strogatz SH. Exploring complex networks. Nature. 2001;410(6825):268–276. doi: 10.1038/35065725. [DOI] [PubMed] [Google Scholar]
- Stumpf MPH, Wiuf C, May RM. Subnets of scale-free networks are not scale-free: Sampling properties of networks. Proceedings of the National Academy of Sciences of the United States of America. 2005;102(12):4221–4224. doi: 10.1073/pnas.0501179102. [DOI] [PMC free article] [PubMed] [Google Scholar]
- Supekar K, Menon V, Rubin D, Musen M, Greicius MD. Network analysis of intrinsic functional brain connectivity in Alzheimer's disease. PLoS Computational Biology. 2008;4(6):e1000100. doi: 10.1371/journal.pcbi.1000100. [DOI] [PMC free article] [PubMed] [Google Scholar]
- Thirion B, Flandin G, Pinel P, Roche A, Ciuciu P, Poline JB. Dealing with the shortcomings of spatial normalization: multi-subject parcellation of fMRI datasets. Hum Brain Mapp. 2006;27(8):678–693. doi: 10.1002/hbm.20210. [DOI] [PMC free article] [PubMed] [Google Scholar]
- Tzourio-Mazoyer N, Landeau B, Papathanassiou D, Crivello F, Etard O, Delcroix N, Mazoyer B, Joliot M. Automated anatomical labeling of activations in SPM using a macroscopic anatomical parcellation of the MNI MRI single-subject brain. Neuroimage. 2002;15(1):273–289. doi: 10.1006/nimg.2001.0978. [DOI] [PubMed] [Google Scholar]
- van den Heuvel MP, Stam CJ, Boersma M, Hulshoff Pol HE. Small-world and scale-free organization of voxel-based resting-state functional connectivity in the human brain. Neuroimage. 2008;43(3):528–539. doi: 10.1016/j.neuroimage.2008.08.010. [DOI] [PubMed] [Google Scholar]
- Wang J, Wang L, Zang Y, Yang H, Tang H, Gong Q, Chen Z, Zhu C, He Y. Parcellation-dependent small-world brain functional networks: A resting-state fMRI study. Hum Brain Mapp. 2009;30(5):1511–1523. doi: 10.1002/hbm.20623. [DOI] [PMC free article] [PubMed] [Google Scholar]
- Watts DJ, Strogatz SH. Collective dynamics of 'small-world' networks. Nature. 1998;393(6684):440–442. doi: 10.1038/30918. [DOI] [PubMed] [Google Scholar]
- Yu S, Huang D, Singer W, Nikolic D. A small world of neuronal synchrony. Cereb Cortex. 2008;18(12):2891–2901. doi: 10.1093/cercor/bhn047. [DOI] [PMC free article] [PubMed] [Google Scholar]


