

In 1925, the German physiologist and psychiatrist Hans Berger first recorded the brain activity of his 15-year-old son. In his pioneering paper, published in 1929, he was the first to use the term “electroencephalogram” (EEG) to describe brain wave recordings.1 The use of the EEG in a clinical study of humans with epilepsy was first published in the English language in 1935.2,3 Even during the 1930s, researchers were using the EEG to study sleep, but a major breakthrough came in 1953, with the description of rapid eye movement (REM) sleep.4 Although the EEG has been used for at least 70 years to qualify and quantify sleep stages, it remains a very powerful tool for sleep research.
In this article, recent advances in the area of slow wave sleep (SWS) research will be reviewed, focusing on the use of high-density EEG recordings to identify the source and propagation of slow oscillations and the relationship between slow waves and synaptic strength.
CHARACTERIZING SLEEP SPINDLES AND SLOW OSCILLATIONS
Two key EEG phenomena of nonREM (NREM) sleep are slow waves/slow oscillations and sleep spindles. This spontaneous brain activity during sleep reflects brain functioning that is not confounded by attention and motivational factors that occur during wakefulness. During slow oscillations (< 1 Hz), the membrane potentials of the majority of cortical neurons alternate in a synchronized fashion, between a depolarized upstate and a hyperpolarized downstate, with each slow oscillation lasting approximately 1 second.5 Slow oscillations often trigger spindles, which peak at 13–14 Hz (Figures 1 and 2).
Figure 1.
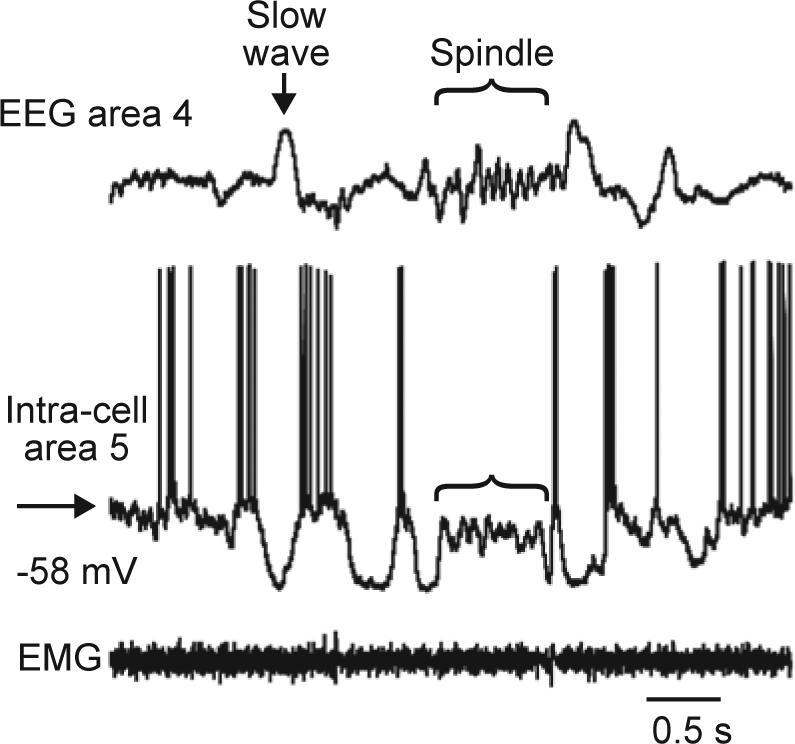
Slow waves and spindles at the cellular level measured by intracellular recording in a single healthy volunteer (Timofeev, unpublished data). EEG, electroencephalogram; EMG, electromyogram. Reproduced, with permission, from Igor Timofeev.
Figure 2.

Topographic representation of slow waves and spindles during sleep in a single healthy volunteer (Tononi et al., unpublished).
High-density EEG recordings employing 256 channels have been used by Massimini and colleagues to investigate the spatial and temporal development of slow oscillations during the first sleep episode of the night in eight human subjects.6 A clear correlation between the detection of slow oscillations and sleep stage was reported, with the rate of occurrence of slow oscillations increasing progressively as sleep deepened. Moreover, Massimini and colleagues discovered that each slow oscillation is a traveling wave, with a discrete site of origin and direction of propagation that varies from cycle to cycle. Signals recorded from all the electrodes that detected a cycle of slow oscillation were sorted according to the timing of the negative peak, demonstrating that the negative peak was continuously shifting (Figure 3A). The maximum delay across all cycles and all subjects varied between 40 ms and 360 ms, with a positive correlation between the variation and the number of electrodes affected by the slow oscillation (p < 0.05). The propagation of the negative peaks of each cycle of the slow oscillation can be visualized using “delay maps” (Figure 3B). Using data from a row of 20 electrodes located along the midline of the scalp, Massimini and colleagues were also able to calculate that the average speed of propagation of the slow oscillation on the scalp was 2.7 ± 0.2 ms, ranging between 1.2 and 7 ms. An example of such a calculation is shown in Figures 3C.6 However, although each individual cycle of slow oscillation has a distinct site of origin and pattern of propagation, repeat EEG recordings from the same subjects a week later demonstrated that the general pattern of origin and propagation of slow oscillations is reproducible across nights and subjects.6
Figure 3.

Slow oscillations propagate as a traveling wave.6 Measured in a single healthy volunteer. A: Signals recorded from the channels affected by a single slow oscillation cycle ranked from top to bottom according to the delay of the negative peak. The width of the red area represents the maximum delay (120 ms) from the negative peak at the top trace to the negative peak at the bottom trace. B: The spatial distribution of the delays on a delay map. The red asterisk marks the location of the channel at which the delay was 0 (the origin), while the blue lines represent the streamlines calculated on the vector fields of delays. C: The speed of wave propagation is measured from a row of electrodes placed on the anteroposterior axis (left). The slope of the linear correlation between the distance on the scalp and the measured delay was used to determine the speed (right). Reproduced, with permission, from Massimini et al.6
SOURCE MODELING OF SLEEP SLOW WAVES
A new application of the 256-channel high-density EEG, beyond localizing changes in voltage on the surface of the scalp, is to attempt to map the specific area of the brain where slow oscillations originate and the regions of the brain to which they travel. This technique is called source localization, and an excellent example is shown in Figure 4. The number of electrodes employed during this technique makes it feasible to localize the cortical sources of brain activity with much higher spatial resolution than traditional EEG recordings and temporal resolution superior to either positron emission tomography or functional magnetic resonance imaging.
Figure 4.

Illustration of source localization using high-density EEG (Tononi et al., unpublished). Measured in a single healthy volunteer. A:Butterfly plot of an individual slow wave for all 256 channels. B: A streamline plot indicating the direction of travel on the scalp. C:Scalp topography for the slow wave at the times indicated on the EEG traces. D: Slice and flat map views indicating the area where there is the largest source of currents during the slow wave. EEG, electroencephalogram.
Using source localization with high-density EEG studies, it is possible to demonstrate that during NREM sleep with slow wave activity (SWA) in the range 0.3–6 Hz, large currents appear primarily along midline structures including the anterior cingulate, cingulate, posterior cingulate, and the precuneus, as well as areas around the lateral sulci.7
Another phenomenon that has been described during NREM sleep is that characterized by slow waves with multiple negative peaks, which appear in the upper delta frequency range (2–4 Hz). Multipeak waves occur more frequently during late sleep compared with early sleep and are negatively correlated with the occurrence of SWA.8 Analysis of multipeak waves using high-density EEG and source localization has demonstrated that the origin and/or propagation of each peak of the wave are spatially unique (Figure 5).8 This indicates that multipeak waves arise from the asynchronous generation of slow oscillations with different origins and/or paths of propagation, and suggests that all “delta” waves may be generated by the superimposition of multiple slow oscillations with distinct spatial origins. Thus, during NREM sleep, we may simply be observing the fundamental phenomenon of the alternation of neurons between the active and quiescent states.8
Figure 5.

Examples of traveling waves for single-peak and multipeak waves. Measured in seven healthy male volunteers. A: Butterfly plots of all channels involved in an individual peak. Red dots show the negative peaks for each derivation. The blue line indicates the representative time for source localization depicted in C. B: Topographic display of the interpolated (100×100) delay gradient based on the corresponding time for the earliest channel detection for that peak (see corresponding red dots above). Individual channels are indicated as black dots. Streamlines along the gradient were computed for each channel and the longest is highlighted in blue. The origin is indicated by the large red dot. C: Top, right, and left views of the minimum norm least squares source estimation 70 ms after the maximum negative peak (indicated by the corresponding vertical blue lines in A). Absolute values of the currents are displayed. EEG, electroencephalogram. Reproduced, with permission, from Riedner et al.8
SLEEP SLOW WAVES AS INDICATORS OF THE NET STRENGTH OF CORTICAL SYNAPSES
Sleep SWA appears to be homeostatically regulated throughout the cortex, as detailed earlier in the article by Dijk.9 In normal subjects, the average amplitude of slow oscillations during sleep changes with age10 and measurements of synaptic density in the cerebral cortex in postmortem samples from normal human brains indicate that synaptic density also changes with age.11 The striking similarity between the shapes of the two curves suggests that there may be a relationship between slow waves and synaptic density.10
As described earlier by Dijk,9 SWA decreases during sleep. To investigate the hypothesis that the homeostatic decrease of SWA is due to a progressive decrease in synaptic strength, Esser and colleagues employed a large-scale computer model of the sleeping thalamocortical system to examine the dynamics of single-cell oscillations, cortical synchronization, and local field potentials (LFPs) under conditions of high or low synaptic strength. They demonstrated that a decrease in cortical synaptic strength led to a decreased incidence of high-amplitude slow waves, a decrease in wave slope and an increase in the number of multipeak waves, with spectral analysis confirming the association of these changes with a decrease in SWA.12 The model's predictions were confirmed using LFP recordings from the rat cerebral cortex during periods of early and late sleep, when the homeostatic sleep pressure is high and low, respectively.13 The data demonstrated that, in rats, the decline in SWA from early to late sleep was associated with a decrease in the incidence of high-amplitude slow waves, a decrease in the wave slope, and a higher proportion of multipeak waves, compatible with the hypothesis that the average synaptic strength decreases during the course of sleep.13 Moreover, sleep deprivation resulted in an increase in the number of high-amplitude slow waves, steeper slopes, and fewer multipeak waves, suggesting that changes in SWA are likely to be the result of homeostatic sleep regulation and not circadian time. Finally, the model's predictions were confirmed in humans. Using high-density EEG recordings, Riedner and colleagues showed that the reduction in SWA during sleep is associated with a decreased incidence of high-amplitude slow waves, a reduction in the slope of the slow waves, and an increased number of multipeak waves.8 The data from these three different systems confirm that reductions in cortical synaptic strength can explain the reduction in SWA and slow wave parameters as sleep pressure decreases, although other mechanisms may also be involved.
This hypothesis is further supported by data from studies that either strengthen or depress synaptic activity in specific areas of the brain. When subjects carry out a learning task that is known to activate, and presumably strengthen, cortical synapses in specific regions of the brain immediately before sleep, high-density EEG recordings during the first 2 hours of sleep demonstrate a local increase in SWA.14 In contrast, temporary limb immobilization promoted synaptic depression in sensorimotor areas and led to a significant reduction in SWA over the affected sensorimotor area.15 Further evidence for a tight relationship between cortical plasticity and sleep intensity has come from a recent study employing a paired associative stimulation protocol.16 In this study, median nerve stimuli were followed after a 25-ms or 10-ms interval by transcranial magnetic stimulation (TMS) pulses to the contralateral cortical hand area, producing a sustained increase or decrease of cortical excitability, respectively. Analysis of high-density EEGs, recorded during subsequent sleep, demonstrated that there was a local increase in SWA in subjects who had displayed increases in cortical responses after TMS and a decrease in local SWA in subjects who had displayed decreases in cortical responses. Changes in SWA during sleep and changes in TMS-induced cortical EEG response were localized to similar cortical regions and showed a positive correlation.
CONCLUSIONS
All slow waves in the sleep EEG are manifestations of the same fundamental cellular phenomenon: the slow oscillation of cortical neurons between a depolarized upstate and a hyperpolarized downstate. Slow waves originate in specific cortical regions and travel over the brain, each with a distinct site of origin and pattern of propagation. Moreover, slow waves with multiple negative peaks may simply result from the superimposition of multiple slow oscillations, each with a distinct origin and/or path of propagation.8
Slow wave homeostasis appears to be associated with net synaptic strength, which is thought to increase during wakefulness and decrease during sleep. Computer simulations that model the effects of synaptic strength of sleep slow waves have demonstrated that a decrease in cortical synaptic strength results in a decrease in SWA, accompanied by a decrease in incidence of high-amplitude slow waves, a decrease in wave slope, and an increase in the number of multipeak waves.12 Tests of the model in rats and humans have confirmed that the decline of SWA during sleep is indeed coupled with these changes in slow wave parameters, indicating that reductions in cortical synaptic strength can explain a reduction in SWA.8,13
Overall, sleep SWA and SWS may represent useful indices of cortical synaptic strength in both healthy patients and those with disease. Furthermore, the ability to trigger slow waves artificially by TMS and the resemblance of these waves to those occurring spontaneously17 suggest that in the future it may be possible to harness SWA to permit effective power naps and to treat disease.
DISCLOSURE STATEMENT
Dr Tononi has received funding from an NIH Director's Pioneer Award, NIMH, NINDS, and DARPA; has consulted for Sanofi-Aventis; has participated in speaking engagements for Sanofi-Aventis and Respironics; and holds a Chair in Sleep medicine at the University of Wisconsin at Madison endowed with a gift from Respironics.
ACKNOWLEDGMENTS
The author would like to thank his collaborators: Ruth Benca, Daniel Bushey, Chiara Cirelli, Chris Douglas, Steve Esser, Ugo Faraguna, Fabio Ferrarelli, Lice Ghilardi, Sean Hill, Reto Huber, Marcello Massimini, Mike Murphy, Michael Petersen, Brady Riedner, and Vlad Vyazovskiy.
REFERENCES
- 1.Berger H. Uber das Elektrenkephalogramm des Menschen. 1st report. Arch Psychiat Nervenkr. 1929;87:527–70. [Google Scholar]
- 2.Gibbs FA, Davis H, Lennox WG. The electroencephalogram in epilepsy and in conditions of impaired consciousness. Arch Neurol Psychiatry (Chicago) 1935;34:1133–48. [Google Scholar]
- 3.Gibbs FA, Davis H. Changes in the human electroencephalogram associated with loss of consciousness. Am J Physiol. 1935;113:49–50. [Google Scholar]
- 4.Aserinsky E, Kleitman N. Regularly occurring periods of eye motility, and concomitant phenomena, during sleep. Science. 1953;118:273–4. doi: 10.1126/science.118.3062.273. [DOI] [PubMed] [Google Scholar]
- 5.Steriade M, Nunez A, Amzica F. A novel slow (< 1 Hz) oscillation of neocortical neurons in vivo: depolarizing and hyperpolarizing components. J Neurosci. 1993;13:3252–65. doi: 10.1523/JNEUROSCI.13-08-03252.1993. [DOI] [PMC free article] [PubMed] [Google Scholar]
- 6.Massimini M, Huber R, Ferrarelli F, Hill S, Tononi G. The sleep slow oscillation as a traveling wave. J Neurosci. 2004;24:6862–70. doi: 10.1523/JNEUROSCI.1318-04.2004. [DOI] [PMC free article] [PubMed] [Google Scholar]
- 7.Murphy M, Riedner BA, Huber R, et al. Source modeling sleep slow waves. Proc Natl Acad Sci U S A. 2009;106:1608–1613. doi: 10.1073/pnas.0807933106. [DOI] [PMC free article] [PubMed] [Google Scholar]
- 8.Riedner BA, Vyazovskiy VV, Huber R, et al. Sleep homeostasis and cortical synchronization: III. A high-density EEG study of sleep slow waves in humans. Sleep. 2007;30:1643–57. doi: 10.1093/sleep/30.12.1643. [DOI] [PMC free article] [PubMed] [Google Scholar]
- 9.Dijk D-J. Regulation and functional correlates of slow wave sleep. J Clin Sleep Med. 2009;5(Supplement):S6–S15. [PMC free article] [PubMed] [Google Scholar]
- 10.Feinberg I. Schizophrenia: caused by a fault in programmed synaptic elimination during adolescence? J Psychiatr Res. 1982;17:319–34. doi: 10.1016/0022-3956(82)90038-3. [DOI] [PubMed] [Google Scholar]
- 11.Huttenlocher PR. Synaptic density in human frontal cortex - developmental changes and effects of aging. Brain Res. 1979;163:195–205. doi: 10.1016/0006-8993(79)90349-4. [DOI] [PubMed] [Google Scholar]
- 12.Esser SK, Hill SL, Tononi G. Sleep homeostasis and cortical synchronization: I. Modeling the effects of synaptic strength on sleep slow waves. Sleep. 2007;30:1617–30. doi: 10.1093/sleep/30.12.1617. [DOI] [PMC free article] [PubMed] [Google Scholar]
- 13.Vyazovskiy VV, Riedner BA, Cirelli C, Tononi G. Sleep homeostasis and cortical synchronization: II. A local field potential study of sleep slow waves in the rat. Sleep. 2007;30:1631–42. doi: 10.1093/sleep/30.12.1631. [DOI] [PMC free article] [PubMed] [Google Scholar]
- 14.Huber R, Ghilardi MF, Massimini M, Tononi G. Local sleep and learning. Nature. 2004;430:78–81. doi: 10.1038/nature02663. [DOI] [PubMed] [Google Scholar]
- 15.Huber R, Ghilardi MF, Massimini M, et al. Arm immobilization causes cortical plastic changes and locally decreases sleep slow wave activity. Nat Neurosci. 2006;9:1169–76. doi: 10.1038/nn1758. [DOI] [PubMed] [Google Scholar]
- 16.Huber R, Maatta S, Esser SK, et al. Measures of cortical plasticity after transcranial paired associative stimulation predict changes in electroencephalogram slow-wave activity during subsequent sleep. J Neurosci. 2008;28:7911–8. doi: 10.1523/JNEUROSCI.1636-08.2008. [DOI] [PMC free article] [PubMed] [Google Scholar]
- 17.Massimini M, Ferrarelli F, Esser SK, et al. Triggering sleep slow waves by transcranial magnetic stimulation. Proc Natl Acad Sci U S A. 2007;104:8496–501. doi: 10.1073/pnas.0702495104. [DOI] [PMC free article] [PubMed] [Google Scholar]