Abstract
PEGylated gold nanoparticles are decorated with various amounts of human transferrin (Tf) to give a series of Tf-targeted particles with near-constant size and electrokinetic potential. The effects of Tf content on nanoparticle tumor targeting were investigated in mice bearing s.c. Neuro2A tumors. Quantitative biodistributions of the nanoparticles 24 h after i.v. tail-vein injections show that the nanoparticle accumulations in the tumors and other organs are independent of Tf. However, the nanoparticle localizations within a particular organ are influenced by the Tf content. In tumor tissue, the content of targeting ligands significantly influences the number of nanoparticles localized within the cancer cells. In liver tissue, high Tf content leads to small amounts of the nanoparticles residing in hepatocytes, whereas most nanoparticles remain in nonparenchymal cells. These results suggest that targeted nanoparticles can provide greater intracellular delivery of therapeutic agents to the cancer cells within solid tumors than their nontargeted analogs.
Keywords: in vivo distribution, intracellular localization, ligand content, targeted delivery
Targeted nanoparticle delivery of therapeutic molecules has the potential to provide safer and more effective therapies for cancer applications (1). Recent work has focused on understanding the parameters that influence targeted nanoparticle behavior and the development of design rules for creating nanoparticle-based therapeutics and imaging agents. Passive tumor targeting takes advantage of the irregularity and leakiness of tumor vasculature to allow nanoparticle accumulation in the tumor (caused by the enhanced permeability and retention effect) (2, 3). Active targeting exploits the (over)expression of surface receptors on cancer cells by providing targeting ligands that can engage these receptors. Previous studies on active targeting have used an assortment of ligands ranging from proteins [antibodies (4) and their molecular fragments (5)], nucleic acids [aptamers (6)], and small molecules [vitamins (7), peptides (8), or carbohydrates (9)]. Ligand incorporation facilitates the entry of nanoparticles to cancer cells via receptor-mediated endocytosis, after which they can release their drug payloads to provide a therapeutic action. Perrault et al. (10) convincingly illustrated that PEGylated gold nanoparticles (AuNPs) must be <100 nm in diameter to move away from the vasculature and throughout the tumor. This condition is necessary for engaging cancer cell surface receptors and attacking molecular targets within cancer cells. Park et al. (11) showed that antibody-targeted liposomes had enhanced antitumor effects as compared with their untargeted counterparts. The same investigators later concluded that the antibody targeting does not increase accumulation of liposomes in tumor as compared with untargeted controls but rather increases the particle localization within cancer cells (12). Using multimodal in vivo imaging techniques, Bartlett et al. (13) demonstrated that untargeted and transferrin (Tf)-targeted polymeric nanoparticles containing siRNA have the same whole-body distribution (and kinetics) and accumulation in tumor, but the targeted particles lead to more pronounced gene inhibition within cancer cells. Very recently, with the aid of computer simulations, Schmidt and Wittrup (14) predicted similar uptake in tumor of both targeted and untargeted liposomes ∼50 nm in size. These examples indicate that the targeting ligand does not influence organ distribution (e.g., bulk tumor localization) but instead influences distribution within tumor tissue (i.e., in cancer cells versus non-cancer cells such as leukocytes and blood endothelial cells). These findings suggest that active targeting of nanoparticles occurs via a mechanism different from that of individual targeting ligands (e.g., antibodies). Thus, further examination of active targeting with nanoparticles is merited. We prepared a series of AuNPs with Tf contents spanning two orders of magnitude for comparison with untargeted particles to test the mechanistic effects of the active targeting of nanoparticles in solid tumors and to delineate particle distribution patterns caused by ligand targeting at the cellular level, a level not investigated in previous organ and tissue distribution studies.
AuNPs provide a well-defined, rigid core for surface modification with Tf. Gold has a low level of in vivo toxicity (15), and scalable synthesis of AuNPs with tunable dimensions is straightforward (16). With the “silver enhancement” method, AuNPs catalyze the selective surface deposition of metallic silver, enabling their visualization as size-enhanced entities in tissue sections under light microscopy (17). Additionally, the high electron density of AuNPs permits the direct visualization of their cellular localization with transmission electron microscopy. The combination of these imaging methods, when used together with inductively coupled plasmonic mass spectrometry (ICP-MS) that can be employed to measure organ-level gold content (18), renders AuNPs a versatile imaging platform for the top-down elucidation of the nanoparticle biodistribution on organ, tissue, and (sub)cellular levels.
The decoration of AuNPs with thiolated poly(ethylene glycol) (PEG-SH) via the formation of stable, covalent gold–thiol linkages (bond energy = 30–40 kJ/mol) (19) can reduce nonspecific interactions (20), allowing the targeting ligands immobilized on the particle surface to engage cell surface receptors with high specificity. PEGylation also prolongs the circulation time of nanoparticles (21), giving sufficient time for particles to localize in different organs.
Human holo-Tf is the targeting ligand used here to probe the effects of active targeting. Because of rapid cell division and stringent demand for iron (for heme synthesis), many cancer cell types have abundant expression of Tf receptors (TfRs) (22). Tf is a 79-kDa endogenous glycoprotein that binds to TfRs at extracellular pH (Kd = 1–100 nM) (23, 24) and triggers receptor-mediated endocytosis (25). It has a history of use as a targeting agent for cancer cells. For example, Tf-targeted siRNA-containing nanoparticles markedly inhibit tumor growth in metastatic Ewing’s sarcoma, whereas their untargeted counterparts do not (26). The covalent conjugation of Tf onto PEG-AuNPs at varying amounts to form Tf -targeted, PEGylated gold nanoparticles (Tf-PEG-AuNPs) and the i.v. injection of these particles into mice bearing s.c. Neuro2A tumors provide the model system for investigating the effects of targeting ligand content on in vivo particle distribution at the organ, tissue, and cellular levels.
Results and Discussion
Synthesis and Characterization of Tf-PEG-SAc.
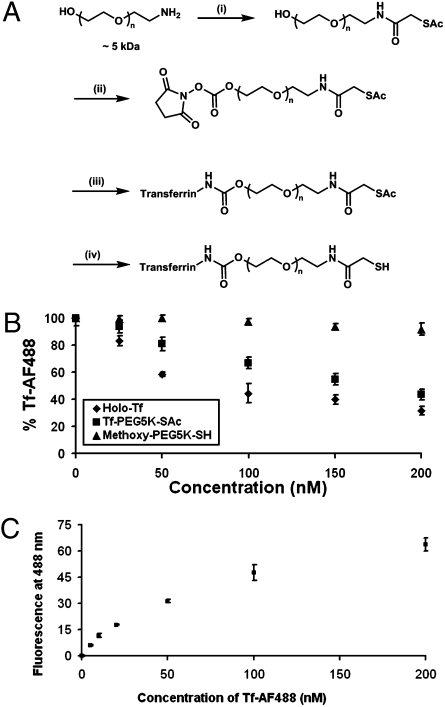
Fig. 1A illustrates the synthesis scheme for Tf-PEG-SAc, a PEG conjugate [molecular weight (MW): 5,000] that contains the targeting ligand (Tf) and an acetyl-protected sulfur group (SAc). This conjugate decorates the surface of the gold nanoparticles to extend Tf away from the gold surface to the nanoparticle periphery, as well as to facilitate the engagement of Tf with surface TfRs of cancer cells within the tumor. Purification of the crude reaction mixture using hydrophobic interaction chromatography (HIC) gave pure, mono-PEGylated Tf-PEG-SAc with an apparent molecular weight of 84 kDa (Fig. S1). This PEGylation method is not site-specific on the Tf, so excessive protein PEGylation may block the active sites of Tf for binding to TfRs. Therefore, we used only the mono-PEGylated fraction for nanoparticle assembly. The competitive binding of Tf-PEG-SAc against Tf conjugated to AlexaFluor488 (Tf-AF488) was used to estimate the effects of mono-PEGylation on Tf binding affinity (Fig. 1B), with holo-Tf and methoxy-PEG-thiol (mPEG-SH; MW: 5,000) as positive and negative controls, respectively. A 1:1 ratio of Tf-AF488 to free holo-Tf gives an ∼45% reduction in fluorescence, suggesting that Tf-AF488 and free holo-Tf have almost equal binding affinity. Tf-PEG-SAc fluorescence is reduced as the Tf-PEG-SAc concentration increases, although the magnitude of the reduction is less than that of free holo-Tf. A 1:1 ratio of Tf-AF488 to Tf-PEG-SAc gives an ∼20% decline in fluorescence. Thus, mono-PEGylation does alter the affinity of Tf to TfRs on Neuro2A cells but not to a large extent. Furthermore, a saturation binding experiment of Tf-AF488 to TfRs of Neuro2A cells was used to measure the affinity of Tf-PEG-SAc (Fig. 1C). A Scatchard analysis of these data yields a Kd for Tf-AF488 of 64 nM (Fig. S2B) and hence a Kd of 64 nM for free holo-Tf (based on the competitive binding study). The estimated Kd for Tf-PEG-SAc is 144 nM, because the binding affinity of Tf-PEG-SAc to TfRs is 2.25-fold less than that of free holo-Tfs.
Fig. 1.
Synthesis and characterization of Tf-PEG-SAc. (A) Reaction conditions: (i) SATA, 4 h, DMF, room temperature; (ii) DSC, DMF/dioxane, 4 h, room temperature; (iii) Holo-Tf, 2 h, room temperature, 50 mM sodium phosphate (pH 7.4); (iv) hydroxylamine, 2 h, room temperature, 50 mM sodium phosphate, 25 mM EDTA (pH 7.5). Step iv renders free thiol groups for conjugation onto AuNPs to form Tf-PEG-AuNPs. (B) Competitive binding assay. PEGylation to form Tf-PEG-SAc did not drastically reduce the binding affinity of Tf. Reported data are expressed as the percent of fluorescence of cells incubated only with Tf-AF488. (C) Saturation binding of Tf-AF488 to Neuro2A cells. Error bars represent 1 SD from duplicate experiments.
Synthesis and Characterization of Tf-PEG-AuNPs.
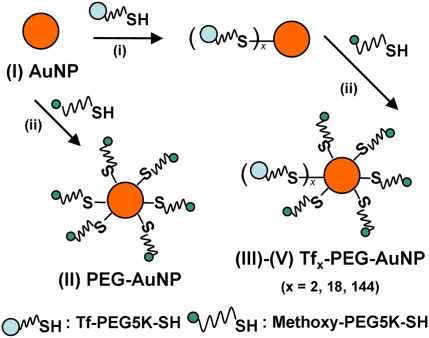
The addition of Tf-PEG-SH (deprotected Tf conjugate) into an aqueous suspension of 50-nm unmodified AuNPs (condition I) initiates the assembly of Tf-PEG-AuNPs (Fig. 2). We selected this gold particle size to mimic the size of our siRNA-containing therapeutic nanoparticles (∼70 nm) (13, 26) and to achieve optimal receptor-mediated endocytosis in cells amid other particle sizes in the 10- to 100-nm range (27). Adjustment of input ligand concentration during the assembly process gave targeted nanoparticles with Tf contents spanning two orders of magnitude [conditions III (2 Tf per particle), IV (18 Tf per particle), and V (144 Tf per particle)], with a coupling efficiency that decreases with input Tf concentration from 87% (III) to 60% (V) (Table S1). Complete PEGylation with excess mPEG-SH followed to mask any unreacted gold surface of the nanoparticles. PEGylated nanoparticles (condition II) were prepared for use as an untargeted control. Table 1 lists the physicochemical properties of the nanoparticles. Hydrodynamic diameters of Tf-PEG-AuNPs are near-constant in water and 1× PBS independent of Tf content (∼80 nm). Their electrokinetic (ζ) potentials in 1 mM KCl are also the same and are independent of Tf content (∼−10 mV). With an isoelectric point of 5.9 (25), Tf is negatively charged in 1× PBS (pH 7.4), but the overall particle ζ potential does not change significantly with Tf content. Thus, this set of nanoparticles is well suited to ascertain the effects of targeting ligand content on nanoparticle distribution at relatively constant nanoparticle diameter and ζ potential.
Fig. 2.
Synthesis of Tf-PEG-AuNPs. Unmodified 50-nm AuNPs (I) were reacted with excess mPEG-SH to form PEG-AuNPs (II) as untargeted particles or first were reacted with various amounts of Tf-PEG-SH and later excess mPEG-SH to form Tf-PEG-AuNPs (III: 2 Tf per particle; IV: 18 Tf per particle; V: 144 Tf per particle).
Table 1.
Physicochemical properties of AuNPs
| NP | HD-water(nm) | HD-1xPBS(nm) | ZP(mV) | Tf content(# Tf/particle) |
| I | 49.4 ± 0.6 | 755.4 ± 8.7 | −18.3 ± 1.2 | N/A |
| II | 73.2 ± 1.3 | 74.9 ± 0.9 | −10.9 ± 1.3 | N/A |
| III | 77.0 ± 0.9 | 77.7 ± 1.5 | −10.8 ± 0.9 | 2.1 ± 0.2 |
| IV | 78.5 ± 1.7 | 81.3 ± 2.9 | −9.0 ± 1.7 | 17.5 ± 2.5 |
| V | 81.0 ± 2.5 | 87.5 ± 3.4 | −9.9 ± 1.7 | 144.3 ± 15.6 |
I, unmodified AuNP; II, PEG-AuNP; III–V, Tf-PEG-AuNP of 2, 18, and 144 Tf per particle, respectively; HD, hydrodynamic diameter; N/A, not applicable; NP, nanoparticle; ZP, ζ potential in 1 mM KCl. The table presents data as average ± SD from three experiments.
Stability and Binding Affinity of Tf-PEG-AuNPs.
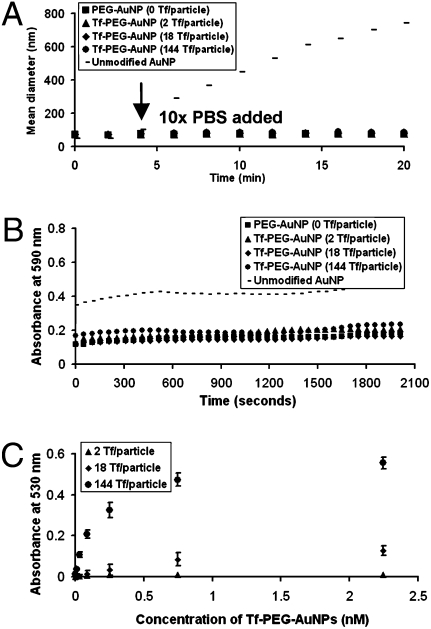
Particle stability in physiological conditions is a prerequisite for effective active targeting. Unmodified AuNPs (I) aggregate rapidly in 1× PBS (Fig. 3A). PEGylation imparts steric stability to II–V in salt solutions, as can be seen from their nearly constant hydrodynamic diameter (HD) when exposed to 1× PBS (Fig. 3A). Moreover, II–V do not flocculate in 90% fresh mouse serum in 1× PBS (Fig. 3B). These results strongly suggest that the PEGylated nanoparticles will not aggregate in vivo. From the saturation binding experiment of Tf-PEG-AuNPs, IV and V bind to Neuro2A cells in a fashion that depends on both Tf content and nanoparticle concentration (Fig. 3C), validating the successful conjugation of Tf-PEG-SH onto the particle surface. A Scatchard analysis was used to estimate the Kd of Tf-PEG-AuNPs, assuming a homogeneous distribution of Tf on the nanoparticle surface. The measured values of IV and V were 1.06 and 0.13 nM, respectively. If, because of geometric scaling considerations, 21.33% of the Tf on the particle surface is in actual contact with TfRs on the surface of Neuro2A cells (Fig. S3), the resultant Kds of IV and V are 0.23 and 0.03 nM, respectively, representing ≈600-fold and 4800-fold enhancement in binding affinity, respectively, compared with free Tf-PEG-SAc (Kd = 144 nM) (Table S2 and Fig. S4). The magnitude of binding affinity enhancement also increases with the ligand content on the particle surface. Such enhancement underscores the multivalent effect that occurs when particle curvature permits localized surfaces of multiple Tfs to interact simultaneously with surface TfRs to trigger endocytosis. Furthermore, given the low binding affinity, the poor signal-to-noise ratio from the binding data of III does not warrant a meaningful estimation of the Kd for III. In theory, with such dilute Tf content (2 Tf per particle), the binding affinity of III should approach that of the monovalent ligand, Tf-PEG-SAc (Kd = 144 nM).
Fig. 3.
Particle stability and binding. (A) In vitro stability against salt. Unmodified 50-nm AuNPs (I) showed instant aggregation after the addition of PBS at the fourth minute, but II–V remained stable. (B) In vitro stability against serum. PEGylation attenuated particle aggregation in 90% mouse serum. (C) Saturation binding of Tf-PEG-AuNPs to Neuro2A cells. Tf-PEG-AuNPs bound in a Tf content-dependent manner (III–V). Error bars indicate 1 SD from duplicate experiments.
In Vivo Tumor Distribution of Tf-PEG-AuNPs.
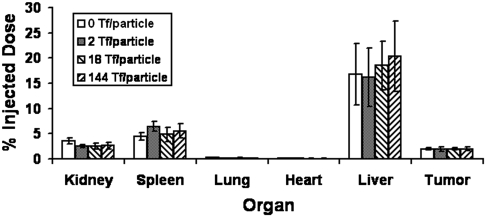
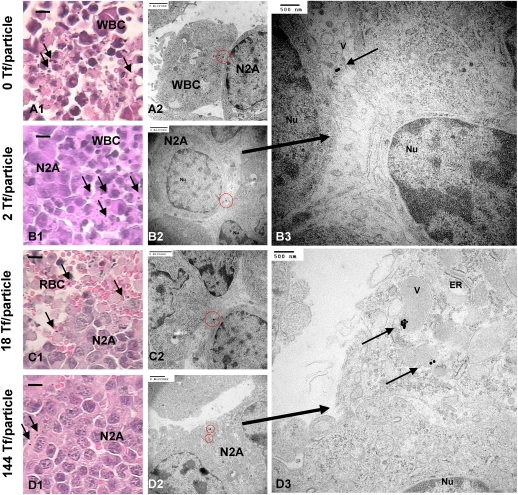
Mice bearing s.c. Neuro2A tumors received i.v. administration of II–V via the tail vein and were euthanized 24 h later to collect organs for analyses. Despite the overexpression of surface TfRs by Neuro2A cells (Fig. S2A) at the organ level, the tumor amasses only 2–3% of the injected dose (ID) of particles, independent of Tf content (Fig. 4). At the tissue level, histological examination reveals predominant localization of AuNPs in the vicinity of leukocytes for all Tf contents (Fig. 5 A–B1). Intracellular accumulation of nanoparticles inside Neuro2A cells is rare (Fig. 5 B–C1) at low Tf content (II–IV), but a further increase in Tf content to 144 Tf per particle leads to considerable nanoparticle uptake by Neuro2A cells, as seen from isolated nanoparticles of V residing near Neuro2A cells (Fig. 5D1). Electron microscopy reveals clear, Tf content-dependent, intracellular nanoparticle localization. Although II–IV localize mostly inside leukocytes (Fig. 5A2) or externally touch the surface of Neuro2A cells (Fig. 5 B–C2), clusters of V reside within large endocytic vesicles of Neuro2A cells (Fig. 5D2). The abundance of mitochondria and endoplasmic reticulum (essential for robust cellular metabolic activities) indicates nanoparticle localizations inside target Neuro2A cells but not inside other leukocytes, endothelial cells, or other noncancer cells (Fig. 5D3). Thus, ligand content does not alter the extent of bulk nanoparticle content in the tumor. Instead, it biases the tissue and cellular distribution with increasing targeting ligand content favoring the intracellular localization within cancer cells. These results support the work of Kirpotin et al. (12) and our previous observations from the targeted delivery of siRNA (13). Furthermore, III and IV demonstrate the same in vivo distribution patterns within the tumor as II. Therefore, a critical Tf content is necessary to promote intracellular accumulation of nanoparticles in cancer cells.
Fig. 4.
In vivo organ distribution. Bulk particle localization in all organs was independent of Tf content. Gold contents are normalized to % injected dose. Error bars indicate 1 SD from each Tf-PEG-AuNP class (n = 3).
Fig. 5.
In vivo tumor tissue and intracellular distribution. (A–D1) Light micrographs of “silver-enhanced” tumor sections. Arrows indicate “silver-enhanced” AuNPs. (Scale bar, 10 μm.) Independent of Tf content, most particles resided near leukocytes. Electron micrographs show particles either engulfed by leukocytes (A2) or tangentially touching Neuro2A cells (B–C2; enlarged image, B3). (D2 and enlarged image, D3) Particles with a high Tf content (V: 144 Tf per particle) can enter Neuro2A cells. ER, endoplasmic reticulum; M, mitochondrion; N2A, Neuro2A cell; Nu, nucleus; RBC, red blood cell; V, vesicle; WBC, leukocyte. [Scale bars: A1–D2 (2 μm); B3 and D3 (500 nm).]
In Vivo Hepatic Distribution of Tf-PEG-AuNPs.
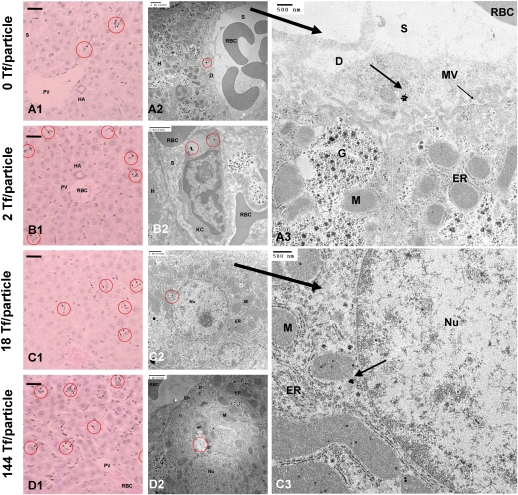
Because nanoparticles always localize in liver to some extent, we address the fate of Tf-PEG-AuNPs in the liver. Compared with Neuro2A cells, hepatocytes have weaker expression of TfRs. At the organ level, Tf content does not influence the level of nanoparticle localization in the liver (17–21% ID) (Fig. 4). At the tissue level, most particles (independent of Tf content) experience phagocytic uptake by Kupffer cells (Fig. 6B2) or reside along hepatic sinusoids (Fig. 6 A–D1) or in the space of Disse, a region between hepatocytes and blood endothelial cells that contains reticular fibers, microvilli, and collagen (Fig. 6A3). Tf-PEG-AuNPs rarely enter hepatocytes (independent of Tf content) (Fig. 6A2). As in tumor, Tf targeting does not affect bulk particle content in the liver but yields infrequent instances of accumulation inside hepatocytes, given sufficiently high Tf content. From electron micrographs, at the cellular level, IV and V reside inside vesicles as small clusters near the hepatocyte nucleus, surrounded by mitochondria and endoplasmic reticulum (Fig. 6 C2–3 and D2). Below the threshold Tf content, however, II and III never permeate the space of Disse and enter hepatocytes. Thus, the Tf targeting ligand content does not alter the extent of bulk content in the liver; it only biases particle localization nearby and entry into hepatocytes.
Fig. 6.
In vivo liver tissue and intracellular distribution. (A–D1) Light micrographs of “silver-enhanced” liver sections. Arrows indicate “silver-enhanced” AuNPs. (Scale bar, 10 μm.) Independent of Tf content, particles rarely enter hepatocytes. Electron micrographs show particles either engulfed by Kupffer cells (A2) or residing in the space of Disse (A2; enlarged image, A3). Hepatocytes can internalize particles with high Tf contents (IV and V: C–D2; enlarged image: C3). D, space of Disse; En, endothelial cell; ER, endoplasmic reticulum; G, Golgi apparatus; H, hepatocyte; HA, hepatic artery; KC and red circle, Kupffer cell; M, mitochondrion; MV, microvillus; Nu, nucleus; PV, hepatic portal vein; RBC, red-blood cell; S, sinusoid. [Scale bars: A1–D2 (2 μm; A3 and C3 (500 nm).]
In summary, our results demonstrate the use of Tf-PEG-AuNPs as imaging agents to understand targeted nanoparticle behavior in vivo. With similar sizes and ζ potentials, targeted particles of different Tf contents (II–V) permit the investigation of the effect of targeting ligand content on nanoparticle distribution in vivo. PEGylation confers steric stability against salt- and serum-induced aggregation in vitro. Because II–V localize in cellular structures of the tumor and liver as individual entities, it is suggested that the steric stabilization occurs in vivo as well. Despite complete nanoparticle PEGylation, the organs of the reticuloendothelial system (liver and spleen) still show significant localization (17–21% ID and 5–6% ID, respectively) in excess of that in tumor (2–3% ID), irrespective of Tf content. Active targeting with Tf-PEG-AuNPs leads to nanoparticle internalization into cancer cells that have abundant TfR expression (Neuro2A cells). These data, when taken together with past tumor permeation work conducted with other targeted nanoparticle delivery systems [dextran (11), immunoliposomes (12), and Tf-targeted cyclodextrin (13)], support the conclusion that targeted nanoparticles <100 nm in size always deliver a higher payload (drug, imaging agent, or combination) into cancer cells of the tumor than their untargeted counterparts. Furthermore, the present study indicates that there is a minimum targeting ligand content on the nanoparticle that provides adequate conditions for effective active targeting. Below this content threshold, targeted nanoparticles manifest in vivo distribution patterns similar to those of untargeted particles at the organ, tissue, and cellular levels. To achieve effective intracellular targeting of cancer cells in solid tumors, our results underscore the importance of optimizing the ligand content on the nanoparticle surface rather than simplistically switching nanoparticles from an “off” state to an “on” state, (i.e., untargeted vs. targeted nanoparticles).
Materials and Methods
Synthesis of Tf-PEG-Sac.
HO-PEG-NH2 (MW: 5,000) (Laysan Bio) was reacted with excess N-Succinimidyl-S-acetylthioacetate (SATA) (Pierce Biotechnology) in dimethylformamide (DMF) at room temperature for 4 h. The product was reacted with excess N, N-disuccinimidyl carbonate (DSC) (Pierce Biotechnology) in DMF/dioxane at room temperature for 4 h to give NHS-PEG-SAc. Upon solvent removal and drying in vacuuo, NHS-PEG-SAc was reacted with Tf (Sigma) at a 2:5 molar ratio in 50 mM sodium phosphate at room temperature for 2.5 h to form Tf-PEG-SAc. Purification involved passing the reaction mixture through a 5-mL HiTrap Phenyl HIC column in ÄKTA FPLC (GE Healthcare), with 1 M ammonium sulfate as the high-salt condition and 50 mM sodium phosphate as the low-salt condition.
Competitive Binding Assay.
Plated in a 24-well plate at a population of 5 × 10⁴ 2 d in advance, Neuro2A cells were incubated in 0.45 mL of OptiMEM I containing 50 nM Tf-AF488 and different amounts of Tf-PEG-SAc at 37 °C and 5% CO2 for 1 h. After PBS rinses to remove unbound Tf conjugates, cells were analyzed with FACSCalibur (Becton Dickinson Biosciences) to quantify the mean fluorescence at 488 nm. The Tf on both Tf-PEG-SAc and Tf-AF488 bind to and compete for surface TfRs of Neuro2A cells. Reported data show the percent of mean fluorescence of cells incubated with Tf-AF488 only. For comparison, analogous experiments were conducted with holo-Tf and mPEG-SH (MW: 5,000) (Sigma-Aldrich).
Binding of Tf-AF488 to Neuro2A Cells.
Plated in a 24-well plate at a population of 5 × 10⁴ cells per well 2 days in advance mouse neuroblastoma (Neuro2A) cells were incubated in 0.45 mL of OptiMEM I (Invitrogen) containing various concentrations of Tf-AF488 at 37 °C and 5% CO2 for 1 h. After PBS rinses to remove unbound Tf-AF488, cells were analyzed with FACSCalibur (BD Biosciences) to quantify the mean fluorescence at 488 nm. A Scatchard analysis gave the dissociation constant (Kd) of Tf-AF488 from TfRs of Neuro2A cells.
Assembly of Tf-PEG-AuNPs.
The deprotection of 6 μL of 1-μg/μL Tf-PEG-SAc in 1× PBS was performed with the addition of 54 μL of 50 mM NH2OH in 50 mM sodium phosphate and 25 mM EDTA (pH 7.5) at room temperature for 2 h. The addition of deionized water to Tf-PEG-SH (the deprotected Tf conjugate) yielded a 0.3-mL volume for salt removal by a 0.5-mL Zeba Desalt Spin Column (Thermo Scientific). Salt removal was necessary to prevent salt-induced aggregation of AuNPs but led to 25% loss of Tf content because of entrapment in the column. To prepare AuNPs with increasing Tf contents, 0.5 μL, 5 μL, or 50 μL of desalted Tf-PEG-SH (15 ng/μL) was added to 0.5 mL of 50-nm unconjugated AuNPs (Ted Pella) at a concentration of 4.5 × 10¹⁰ particles/mL The reaction proceeded at room temperature with shaking for 1 h. Complete PEGylation of the unreacted gold surface required the introduction of 10 μL of 1 mM mPEG-SH (MW: 5,000) into the reaction mixture and proceeded at room temperature with shaking for 30 min. The reaction mixture was centrifuged at 14,000 × g for 10 min, followed by removal of the supernatant fraction that contained unreacted or dimerized Tf- and methoxy-PEGs. Tf-PEG-AuNPs sank to the bottom of the reaction vial as a brick red pellet. The pellet was rinsed twice with 0.45 mL of 1× PBS for 10 min on a shaker. Also, 0.5 mL of 50-nm AuNPs was PEGylated with 10 μL of 1 mM mPEG-SH at room temperature with shaking for 30 min. The removal of excess mPEG-SH yielded PEG-AuNPs as untargeted control particles.
Physicochemical Characterizations.
HD and ζ potential of AuNPs were measured using ZetaPals (Brookhaven Instruments Corporation). For HD measurements, the particle pellet was resuspended in 1.2 mL of deionized water or 1× PBS. Reported HDs are average values from three runs of 3 min each. For ζ-potential analysis, the pellet was resuspended in 1.4 mL of 1 mM KCl. Reported ζ potentials are average values from 10 runs each with a target residual of 0.012 measured at a conductance of 320 ± 32 μS.
Estimation of Tf Content.
A human Tf ELISA quantitation kit (Bethyl Laboratories) was used to determine the amount of unbound Tf-PEG-SH in the supernatant fractions collected from the synthesis and PBS rinsing steps. Given the initial amount of Tf-PEG-SH added, a mass balance indirectly yields the Tf content of Tf-PEG-AuNPs. All reported contents are from triplicate experiments.
Particle Stability in Salt- and Serum-Containing Solutions.
To monitor particle stability in salt solutions, a pellet containing 2.25 × 10¹⁰ unmodified AuNPs (I), PEG-AuNPs (no Tf: II), or Tf-PEG-AuNPs of different Tf contents (III: 2 Tf per particle; IV: 18Tf per particle; V: 144 Tf per particle) were resuspended in 1.26 mL of deionized water in a cuvette placed inside the ZetaPals instrument. Four minutes into HD measurements, 0.14 mL of 10× PBS was added to the cuvette. Size measurements continued for 16 more minutes. The assessment of particle stability in serum entailed the resuspension of a pellet containing 2.25 × 10¹⁰ particles of I–V in 200 μL of 90% fresh mouse serum [collected by saphenous vein extraction from A/J mice (Jackson Laboratory)] in 1× PBS. A Safire2 Microplate Reader (Tecan) was used to measure the absorbance of the AuNP-serum mixture at 37 °C for 1 h at 590 nm, a wavelength indicative of gold flocculation.
Binding of Tf-PEG-AuNPs to Neuro2A Cells.
Plated in a 24-well plate at a population of 8 × 10⁵ cells per well 2 d in advance, Neuro2A cells were incubated in 0.2 mL of OptiMEM I containing different concentrations of III–V at 37 °C and 5% CO2 for 1 h. After PBS rinses to remove unbound particles, a Safire2 Microplate Reader (Tecan) was used to measure the cell absorbance at 530 nm, the plasmon peak of II. To account for nonspecific adsorption, Neuro2A cells were incubated with identical concentrations of II. For Scatchard analyses to deduce the effective Kds of III–V, the free gold concentration was quantified by Safire2 based on a calibration curve of known concentrations of II. Reported values, after deduction of nonspecific gold signals, are from duplicate experiments.
Cell Lines.
Neuro2A cells were cultured at 37 °C and 5% CO2 in DMEM, supplemented with 10% FBS, 100 U/mL penicillin, and 100 U/mL streptomycin. Before tumor implantation, cells were washed with PBS, trypsinized, and resuspended in serum-free, antibiotic-free DMEM.
Animal Models.
All animal experiments complied with National Institute of Health Guidelines for Animal Care and were approved by the California Institute of Technology Institutional Animal Care and Use Committee. In the right hind flank, each 8-week-old, female A/J mouse received s.c. implantation of 106 Neuro2A cells in 0.1 mL of DMEM.
Systemic Administration.
Two weeks after tumor implantation, four mouse groups (n = 3) received i.v tail-vein administration of 4.5 × 10¹¹ particles of II V (in 0.5 mL of 5% glucose). Animals were euthanized by CO2 overdose 24 h after injection, followed by collection and immersion-fixation of the tumor, liver, kidney, heart, spleen, and lung in 4% paraformaldehyde in 1× PBS at 4 °C for 2 weeks.
ICP-MS.
Homogenized organs were oxidized in 0.5 mL of acid mixture (70% HNO3 and 35% HCl at a 3:1 volume ratio) in a microwave until they dissolved fully. After the addition of 20.5 mL of deionized water, the sample was centrifuged at 3200 × g for 15 min to remove cell debris, leaving the supernatant for gold content analysis using an HP 4500 ICP-MS (Agilent). Nebulization occurred with a flow of 1.3 L/min of argon using a Babbington type nebulizer in a Pyrex Scott-type spray chamber. The argon plasma power was 1200 W with a flow of 15 L/min and an auxiliary flow of 1.1 L/min. A calibration curve of various concentrations of II was used to measure the gold content, using 2.5% HNO3 and 0.42% HCl as the blank solvent and tissues from uninjected A/J mice to account for background organ gold content. Reported values are expressed as the percent of ID. Error bars indicate 1 SD from three different mice in each mouse group.
Histology with Silver Enhancement.
Tissue blocks (∼1 cm3) were dehydrated gradually with ethanol and embedded in molten paraffin to generate sections 4 μm thick. Deparaffinized sections underwent silver enhancement (17) to enlarge AuNPs for visualization under light microscopy and were counter stained with Gill’s hematoxylin and 1% eosin in 95% ethanol.
Transmission Electron Microscopy.
Tissue blocks (∼1 mm3) were fixed in 2.5% glutaraldehyde (in 0.1 M sodium cacodylate, pH 7.4) for 2 h, stained by 1% OsO4 at 4 °C for 2 h and 0.9% OsO4 and 0.3% K4Fe(CN)6 at 4 °C for 2 h. Gradual dehydration with ethanol and propylene oxide enabled tissue embedding in Epon 812 resins (Electron Microscopy Sciences). Sections 80 nm thick were deposited on carbon and Formvar-coated, 200-mesh, nickel grids (Electron Microscopy Sciences) and were stained with 3% uranyl acetate and Reynolds lead citrate for visualization under a 120 kV BioTwin CM120 transmission electron microscope (Philips).
Supplementary Material
Acknowledgments
We thank Debbie Guerrero, Siva Wu, Jennifer Bower (House Ear Institute), Carol Garland, and Nathan Dalleska (California Institute of Technology) for advice on histology, transmission electron microscopy, and ICP-MS. This work was supported by National Cancer Institute Grant CA 119347 and National Institutes of Health Grant R01 EB004657.
Footnotes
The authors declare no conflict of interest.
This article contains supporting information online at www.pnas.org/cgi/content/full/ 0914140107/DCSupplemental.
References
- 1.Davis ME, Chen ZG, Shin DM. Nanoparticle therapeutics: An emerging treatment modality for cancer. Nat Rev Drug Discov. 2008;7:771–782. doi: 10.1038/nrd2614. [DOI] [PubMed] [Google Scholar]
- 2.Matsumura Y, Maeda H. A new concept for macromolecular therapeutics in cancer chemotherapy: Mechanism of tumoritropic accumulation of proteins and the antitumor agent SMANCS. Cancer Res. 1986;46:6387–6392. [PubMed] [Google Scholar]
- 3.Dreher MR, et al. Tumor vascular permeability, accumulation, and penetration of macromolecular drug carriers. J Natl Cancer Inst. 2006;98:335–344. doi: 10.1093/jnci/djj070. [DOI] [PubMed] [Google Scholar]
- 4.Lopes de Menezes DE, Pilarski LM, Allen TM. In vitro and in vivo targeting of immunoliposomal doxorubicin to human B-cell lymphoma. Cancer Res. 1998;58:3320–3330. [PubMed] [Google Scholar]
- 5.Zhou Y, et al. Impact of single-chain Fv antibody fragment affinity on nanoparticle targeting of epidermal growth factor receptor-expressing tumor cells. J Mol Biol. 2007;371:934–947. doi: 10.1016/j.jmb.2007.05.011. [DOI] [PMC free article] [PubMed] [Google Scholar]
- 6.Farokhzad OC, et al. Nanoparticle-aptamer bioconjugates: A new approach for targeting prostate cancer cells. Cancer Res. 2004;64:7668–7672. doi: 10.1158/0008-5472.CAN-04-2550. [DOI] [PubMed] [Google Scholar]
- 7.Bhattacharya R, et al. Attaching folic acid on gold nanoparticles using noncovalent interaction via different polyethylene glycol backbones and targeting of cancer cells. Nanomed Nanotechnol Biol Med. 2007;3:224–238. [Google Scholar]
- 8.Montet X, Funovics M, Montet-Abou K, Weissleder R, Josephson L. Multivalent effects of RGD peptides obtained by nanoparticle display. J Med Chem. 2006;49:6087–6093. doi: 10.1021/jm060515m. [DOI] [PubMed] [Google Scholar]
- 9.Popielarski SR, Pun SH, Davis ME. A nanoparticle-based model delivery system to guide the rational design of gene delivery to the liver. 1. Synthesis and characterization. Bioconjug Chem. 2005;16:1063–1070. doi: 10.1021/bc050113d. [DOI] [PubMed] [Google Scholar]
- 10.Perrault SD, Walkey C, Jennings T, Fischer HC, Chan WC. Mediating tumor targeting efficiency of nanoparticles through design. Nano Lett. 2009;9:1909–1915. doi: 10.1021/nl900031y. [DOI] [PubMed] [Google Scholar]
- 11.Park JW, et al. Anti-HER2 immunoliposomes: Enhanced efficacy attributable to targeted delivery. Clin Cancer Res. 2002;8:1172–1181. [PubMed] [Google Scholar]
- 12.Kirpotin DB, et al. Antibody targeting of long-circulating lipidic nanoparticles does not increase tumor localization but does increase internalization in animal models. Cancer Res. 2006;66:6732–6740. doi: 10.1158/0008-5472.CAN-05-4199. [DOI] [PubMed] [Google Scholar]
- 13.Bartlett DW, Su H, Hildebrandt IJ, Weber WA, Davis ME. Impact of tumor-specific targeting on the biodistribution and efficacy of siRNA nanoparticles measured by multimodality in vivo imaging. Proc Natl Acad Sci USA. 2007;104:15549–15554. doi: 10.1073/pnas.0707461104. [DOI] [PMC free article] [PubMed] [Google Scholar]
- 14.Schmidt MM, Wittrup KD. A modeling analysis of the effects of molecular size and binding affinity on tumor targeting. Mol Cancer Ther. 2009;8:2861–2871. doi: 10.1158/1535-7163.MCT-09-0195. [DOI] [PMC free article] [PubMed] [Google Scholar]
- 15.Thomas M, Klibanov AM. Conjugation to gold nanoparticles enhances polyethylenimine’s transfer of plasmid DNA into mammalian cells. Proc Natl Acad Sci USA. 2003;100:9138–9143. doi: 10.1073/pnas.1233634100. [DOI] [PMC free article] [PubMed] [Google Scholar]
- 16.Frens G. Controlled nucleation for the regulation of the particle size in monodisperse gold suspensions. Nat Phys Sci. 1972;241:20–22. [Google Scholar]
- 17.Danscher G. Histochemical demonstration of heavy metals. Histochemistry. 1981;71:1–16. doi: 10.1007/BF00592566. [DOI] [PubMed] [Google Scholar]
- 18.De Jong WH, et al. Particle size-dependent organ distribution of gold nanoparticles after intravenous administration. Biomaterials. 2008;29:1912–1919. doi: 10.1016/j.biomaterials.2007.12.037. [DOI] [PubMed] [Google Scholar]
- 19.Yang M, Yau HCM, Chan HL. Adsorption kinetics and ligand-binding properties of thiol-modified double-stranded DNA on a gold surface. Langmuir. 1998;14:6121–6129. [Google Scholar]
- 20.Kubetzko S, Sarkar CA, Plückthun A. Protein PEGylation decreases observed target association rates via a dual blocking mechanism. Mol Pharmacol. 2005;68:1439–1454. doi: 10.1124/mol.105.014910. [DOI] [PubMed] [Google Scholar]
- 21.Ishida O, et al. Liposomes bearing polyethyleneglycol-coupled transferrin with intracellular targeting property to the solid tumors in vivo. Pharm Res. 2001;18:1042–1048. doi: 10.1023/a:1010960900254. [DOI] [PubMed] [Google Scholar]
- 22.Gatter KC, Brown G, Trowbridge IS, Woolston RE, Mason DY. Transferrin receptors in human tissues: Their distribution and possible clinical relevance. J Clin Pathol. 1983;36:539–545. doi: 10.1136/jcp.36.5.539. [DOI] [PMC free article] [PubMed] [Google Scholar]
- 23.Sawyer ST, Krantz SB. Transferrin receptor number, synthesis, and endocytosis during erythropoietin-induced maturation of Friend virus-infected erythroid cells. J Biol Chem. 1986;261:9187–9195. [PubMed] [Google Scholar]
- 24.Stein BS, Sussman HH. Peptide mapping of the human transferrin receptor in normal and transformed cells. J Biol Chem. 1983;258:2668–2673. [PubMed] [Google Scholar]
- 25.Enns CA, Rutledge EA, Williams AM. The transferrin receptor. Biomembranes. 1996;4:255–287. [Google Scholar]
- 26.Hu-Lieskovan S, Heidel JD, Bartlett DW, Davis ME, Triche TJ. Sequence-specific knockdown of EWS-FLI1 by targeted, nonviral delivery of small interfering RNA inhibits tumor growth in a murine model of metastatic Ewing’s sarcoma. Cancer Res. 2005;65:8984–8992. doi: 10.1158/0008-5472.CAN-05-0565. [DOI] [PubMed] [Google Scholar]
- 27.Jiang W, Kim BYS, Rutka JT, Chan WCW. Nanoparticle-mediated cellular response is size-dependent. Nat Nanotechnol. 2008;3:145–150. doi: 10.1038/nnano.2008.30. [DOI] [PubMed] [Google Scholar]
Associated Data
This section collects any data citations, data availability statements, or supplementary materials included in this article.


