

Abstract
Neocortical networks are composed of diverse populations of cells that differ in their chemical content, electrophysiological characteristics, and connectivity. Gamma-frequency oscillatory activity of inhibitory subnetworks has been hypothesized to regulate information processing in the cortex as a whole. Inhibitory neurons in these subnetworks synchronize their firing and selectively innervate the perisomatic compartments of their target neurons, generating both tonic and rapidly fluctuating inhibition. How do different types of cortical neurons respond to changes in the level and structure of perisomatic inhibition? What accounts for response heterogeneity between cell types, and are these response properties fixed or flexible? To answer these questions, we use in vitro whole-cell recording and dynamic-clamp somatic current injection to study six distinct types of cortical neurons. We demonstrate that different types of neurons systematically vary in their receptiveness to fast changes in the structure of inhibition and the range over which changes in inhibitory tone affect their output. Using simple neuron models and model neuron hybrids (dynamic clamp), we determine which intrinsic differences between cell types lead to these variations in receptiveness. These results suggest important differences in the way cell types are affected by gamma-frequency inhibition, which may have important circuit level implications. Although intrinsic differences observed in vitro are useful for the elucidation of basic cellular properties and differences between cell types, we also investigate how the integrative properties of neurons are likely to be rapidly modulated in the context of active networks in vivo.
Introduction
Synchronization of neocortical neuronal activity, particularly at gamma (30–80 Hz) frequencies, is related to cognitive functions such as working memory maintenance, attentional selection, sensory-motor integration, and memory retrieval (for review, see Herrmann and Demiralp, 2005; Womelsdorf and Fries, 2006; Jensen et al., 2007), whereas disruption of oscillatory synchronization is associated with attention and cognition disorders, including schizophrenia, epilepsy, and attention deficit/hyperactivity disorder (for review, see Herrmann and Demiralp, 2005; Başar and Güntekin, 2008). However, the physiological and functional consequences of gamma activity for individual neurons remain unclear.
The generation and transmission of these oscillations depends critically on activity in networks of fast-spiking inhibitory neurons (Whittington et al., 1995; Freund, 2003) (for review, see Bartos et al., 2007; Fries, 2009), which synapse on the perisomatic compartments of their targets (Tamás et al., 2004). Indeed, the intracellular correlate of these population-level oscillations is synchronized, phase-locked inhibition (Klausberger et al., 2003; Hasenstaub et al., 2005) believed to play a role in timing or coordinating the activity of other neurons (Galarreta and Hestrin, 2002; Fries et al., 2007). Furthermore, fast changes in oscillatory synchronization are often enveloped by slow changes in overall local circuit activity and inhibitory tone (Hasenstaub et al., 2005; Lakatos et al., 2008). Thus, to understand how gamma activity contributes to cortical information processing, we must determine how fast changes in inhibitory synchrony, in concert with slow changes in inhibitory tone, interact with the integrative properties of target neurons.
There are many different types of cortical neurons, each having specific neurochemical properties, connectivity patterns, laminar distributions, and electrophysiological characteristics (Kawaguchi, 1993; Kasper et al., 1994; Markram et al., 2004). Because of these differences, neuron types may vary in the amplitude and timing of the synchronized inhibition they receive during a given epoch of gamma, as well as in their temporal filtering and integration of a given pattern of inhibitory inputs. Consistent with these expectations, experiments in cortical slices have demonstrated that spatiotemporal filtering of inhibitory synaptic inputs differs between inhibitory cell types (Tamás et al., 2000; Szabadics et al., 2001), and computational and experimental studies have shown that both slow and fast changes in inhibition affect the firing of neurons (Tiesinga et al., 2004; McLelland and Paulsen, 2009). Here, we further investigate the integrative properties of inhibitory and excitatory neuronal types, focusing on the interactions between slow and fast changes in inhibition and the properties that are likely to underlie response differences between cells.
We use intracellular recordings from a variety of excitatory and inhibitory cortical neurons in vitro to characterize the diverse relationships between slow and fast fluctuations in the somatic inhibitory inputs of a cell, and its action potential output. We then use a simple model to predict which intrinsic differences can account for the observed relationship differences. Next, we modify the intrinsic properties of neurons, using dynamic clamp, to test these predictions in multiple neuron types. Finally, we demonstrate how these relationships may be flexibly altered by factors such as neuromodulation and local circuit activity.
Materials and Methods
In vitro slice experiments.
All animal use was approved by the Institutional Animal Care and Use Committee at The Salk Institute for Biological Studies. The G42 transgenic mice were originally generated by Josh Huang (Cold Spring Harbor Laboratory, Cold Spring Harbor, NY) (Chattopadhyaya et al., 2004) and were obtained from The Jackson Laboratory (http://www.jax.org). G30 transgenic mice were originally generated by Gabor Szabo (Department of Functional Neuroanatomy, Institute of Experimental Medicine, Budapest, Hungary) (López-Bendito et al., 2004) and obtained from Sacha Nelson (Brandeis University, Waltham, MA). GIN transgenic mice were generated in John Swan's Laboratory at the Baylor College of Medicine (Houston, TX) (Oliva et al., 2000) and obtained from The Jackson Laboratory. C57BL/6J mice were obtained from The Jackson Laboratory.
To prepare brain slices, mice aged postnatal day 18 (P18) to P26 were deeply anesthetized with Nembutal (100 mg/kg, i.p.) and rapidly decapitated. A vibratome (series 1000; Vibratome) was used to cut 300-μm-thick coronal brain slices from the somatosensory cortex (S1). Slices were cut in ice-cold artificial CSF (ACSF) (24 mm NaCl, 5 mm KCl, 26 mm NaHCO3, 1 mm KH2PO4, 1 mm MgSO4, 10 mm glucose, 1.2 mm CaCl2, and 1 mm kynurenic acid) and incubated at 35°C for at least 30 min in ACSF bubbled with 95% O2/5% CO2 before transferring to a room temperature submerged chamber for recording.
Whole-cell recordings.
Neurons were visualized at 40× magnification using a differential interference contrast/fluorescent Olympus microscope and a video camera (VE 1000; MTI-Dage). Pyramidal neurons from layers III and V were identified by their laminar location, pyramidal-shaped cell bodies, and long apical dendrite. GFP+ cells from G42, G30, and GIN mice were identified by their fluorescence. Whole-cell recordings were performed using glass pipettes pulled on a P-97 micropipette puller (Sutter Instrument) from borosilicate glass (Sutter Instrument) to 3–5 MΩ, filled with 130 mm K-gluconate, 0.2 mm EGTA, 2 mm MgCl2, 6 mm KCl, 10 mm HEPES, 2.5 mm Na-ATP, 0.5 mm Na-GTP, and 10 mm K-phosphocreatine, pH 7.2. Signals were amplified with a MultiClamp 700B amplifier (Molecular Devices). Data were acquired and digitized using the Spike2 Power 1401 collection system (Cambridge Electronic Design). All recordings were performed in current-clamp mode. Intracellular recordings were accepted if they showed a stable resting membrane potential below −50 mV throughout the experiment with a SD of <0.9 mV, and had stable-size action potentials with heights at least 60 mV (for pyramidal neurons) or 40 mV (for interneurons) and widths at half-height of <2 ms.
Cell characterization.
The membrane time constant and input resistance were evaluated using current pulses sufficient to cause 2–5 mV hyperpolarizations. Afterhyperpolarization (AHP) duration and amplitude were measured from the average of more than five action potentials separated by at least 200 ms. AHP amplitude was measured as the maximum negative voltage deflection relative to spike threshold. AHP duration was measured as the time when mean voltage was two-thirds recovered toward rest.
Stimulus protocol.
Cells were stimulated with a constant depolarizing current Ibase sufficient to maintain firing at 3–5 Hz. To characterize the relative dependence of cells on inhibitory synchrony, compared with tonic inhibition, cells were simultaneously stimulated with a hyperpolarizing current whose mean offset randomly varied every 500 ms, and a zero-mean 40 Hz sine wave current whose amplitude randomly varied every 500 ms. Ten levels of tonic inhibition (equal intervals, ranging from 0 to Ibase), and 10 levels of gamma-wave amplitude (equal intervals, ranging from 0 to Ibase), were tested in each block of trials. Each block lasted at least 600 s, for at least 10 repeats of each trial condition.
Dynamic clamp.
In some blocks, as indicated in Results, the same protocol was repeated using conductance rather than current injections. Fast real-time dynamic clamp was implemented using RTLDC (Boston University, Boston, MA) (Dorval et al., 2001) combined with the Real-Time Application Interface (www.rtai.org), device drivers from the COMEDI project (www.comedi.org), and a NI DAQ PCI-MIO-16XE-50 board (National Instruments). The dynamic clamp was used to generate two conductances, one with a reversal potential of 0 mV (mimicking excitation) and another with a reversal potential of −80 mV (mimicking inhibition) (see Fig. 6). Cells were simultaneously stimulated with a constant excitatory conductance, a fluctuating inhibitory conductance, and a sine-varying inhibitory conductance, as in the current injection protocol above. In some blocks, as indicated in Results, dynamic clamp was also used to add a leak conductance (see Fig. 4C,D) or an AHP conductance (see Fig. 5C,D) to the neurons. The leak conductance of each cell was changed by adding a constant conductance whose reversal potential was set to match the resting membrane potential of the recorded neuron. The strength and duration of the AHP of each cell was changed by adding a conductance that reversed at −80 mV and decayed as a single exponential.
Figure 6.
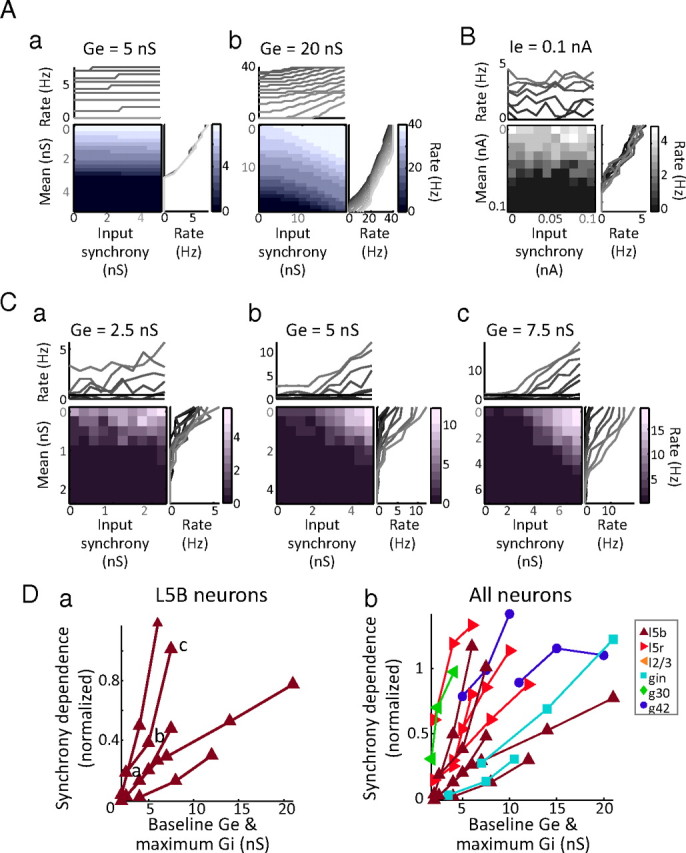
The relative synchrony dependence of neurons changes with background conductance input. Aa, In a model neuron stimulated with constant excitatory conductance and randomly varying inhibitory conductance, spike responses are only weakly dependent on input synchrony, compared with input mean. Ab, Proportionately increasing the inhibitory and excitatory conductance inputs of the model neuron causes its output to become synchrony dependent. B, In a layer 5 bursting neuron, changing the synchrony of the current stimulus has little effect on spike output. C, Driving the same neuron in B with stronger artificial synaptic drive (i.e., proportionately scaling up the mean inhibitory and excitatory conductances) creates synchrony dependence in the spike output of the cell. Da, In n = 6 large bursting pyramidal neurons, adding artificial synaptic drive changed their response profiles from relatively synchrony independent to relatively synchrony dependent. Db, In n = 13 neurons, including G42, GIN, L2/3, and L5R neurons, scaling up the excitatory and inhibitory conductances that the neuron received increased its synchrony dependence, whether or not the response of the neuron was initially synchrony dependent. Neurons are color- and marker-coded as in Figures 3–5.
Figure 4.

The relative synchrony dependence of neurons depends on passive membrane-filtering properties. A, The response of a single-compartment Hodgkin–Huxley-style model neuron to the stimulation protocol is relatively synchrony independent. a, Decreasing its time constant either by decreasing the capacitance (a→b) or increasing the leak conductance (a→c) increases synchrony dependence. B, Across n = 47 cells, time constant correlates with normalized synchrony dependence (Spearman's r = −0.84; p = 4.11 e-013). An example voltage trace from a layer 5 regular-spiking neuron with a short time constant (a) and an example G42 fast-spiking with a long time constant (b) are illustrated and corresponding points marked. Neuron types are color- and marker-coded as in Figure 3. C, Changing membrane-filtering properties changes synchrony dependence. The response of an example L5 regular-spiking cell is weakly dependent on input synchrony; reducing its time constant by the addition of leak conductance (a→b→c) increases its relative synchrony dependence. D, Across n = 7 L5R (red) and L5B (dark red) cells, increasing the leak conductance reliably increased the synchrony-to-mean ratio of the neuron (p < 0.05). Trial blocks shown in inset are marked. Inset, Example voltage traces from Ca, Cb, and Cc.
Figure 5.

The dynamic range of neurons depends on afterhyperpolarization amplitude and duration. A, In a single-compartment Hodgkin–Huxley-style model neuron with a brief, weak AHP, response rate depends steeply on input strength (a). Increasing either the AHP conductance amplitude (a→b) or the AHP duration (a→c) makes the input–output relationship shallower. B, The correlation of the shallowness of the input–output relationship with AHP duration for n = 47 neurons (Spearman's r = 0.64; p = 1.37 e-006) (a) and in the n = 31 neurons with input resistances between 50 and 200 MΩ (Spearman's r = 0.74; p = 6.93 e-006) (b). Neuronal types are color- and marker-coded as in Figures 3 and 4. C, Dynamic clamp was used to add an artificial AHP conductance to a sample G42 neuron (a). Either increasing the amplitude (a→b) or increasing the duration (a→c) of the artificial AHP conductance increases the dynamic range of the neuron. Across n = 5 cells, increasing either the amount of AHP (d) or the duration of the AHP (e) reliably increased the dynamic range of the neurons.
Analysis.
The slope of the rate–mean inhibition or rate–synchrony relationships were quantified by measuring the slope of the input–firing rate relationship about the midpoint, for all points with firing rates between 20 and 80% of the maximum of the cell. A separate slope was calculated for each rate–mean or rate–synchrony curve, and the median of these slopes was used for display and statistical analysis. To measure the relative synchrony dependence of the neuron, the median slope of the rate–synchrony relationship was normalized by dividing by the median slope of the rate–mean relationship. To identify significant pairwise comparisons, p values were corrected for multiple comparisons using the Benjamini–Hochberg step-up technique (Matlab Bioinformatics Toolbox; The MathWorks).
Model.
A single-compartment neuron model was implemented in Matlab. The model contained a Hodgkin–Huxley style transient Na+ conductance and delayed rectifier potassium conductance (Erisir et al., 1999). The default maximum sodium and potassium conductances were 700 and 1400 nS, respectively, and the corresponding currents reversed at 50 and −80 mV, respectively. The model also contained a constant leak conductance of 3 nS that reversed at −70 mV and an afterhyperpolarization conductance that was modeled as a single exponential reversing at −80 mV, with a default maximum conductance of 10% of the leak conductance of the cell and a default time constant of 40 ms. The model neuron was stimulated with the same experimental protocol as the real neurons. The capacitance (see Fig. 4A), leak conductance (see Fig. 4A), AHP duration (see Fig. 5A), and AHP amplitude (see Fig. 5A) of the model cell were systematically changed as indicated in Results.
Results
Integration of tonic and fluctuating inhibition depends on cell type
Whole-cell current-clamp recordings were performed on three types of projection neurons (Fig. 1A) and three types of inhibitory neurons (Fig. 1B). Projection neurons were identified by their pyramidal-shaped cell body and long apical dendrites, and separated into three classes based on their laminar location and spiking phenotype: layer 5 pyramidal neurons capable of generating intrinsic burst discharges (Fig. 1A, L5B) (Kasper et al., 1994), layer 5 pyramidal neurons generating regular trains of single spikes (Fig. 1A, L5R), and layer 2/3 pyramidal neurons generating regular-spiking adapting trains of action potentials (Fig. 1A, L2/3). In addition, three types of local-circuit inhibitory neurons were identified by green fluorescent protein (GFP) expression in the GIN, G42, and G30 lines of mice (Oliva et al., 2000; Chattopadhyaya et al., 2004; López-Bendito et al., 2004) and confirmed by their spiking phenotype. GFP+ cells in G42 mice generated rapid, nonadapting trains of action potentials (Fig. 1B, G42) and are parvalbumin-positive (Chattopadhyaya et al., 2004). GFP+ cells in the GIN mice generated slower, accommodating trains of action potentials (Fig. 1B, GIN), often exhibited low-threshold-spiking (LTS) behavior, and are somatostatin-positive Martinotti neurons (Oliva et al., 2000; Xu et al., 2006; Xu and Callaway, 2009). GIN neurons are heterogeneous in their spike parameters and expression of other chemical markers (Halabisky et al., 2006; Xu et al., 2006) but were not further subdivided in this study. Although the G30 line labels many neuron types with various morphologies and firing patterns, only irregular-spiking GFP+ cells were used in this study (Fig. 1B, G30). These cells are multipolar, cholecystokinin-positive, and express type 1 cannabinoid receptors (Galarreta et al., 2004; Xu and Callaway, 2009).
Figure 1.
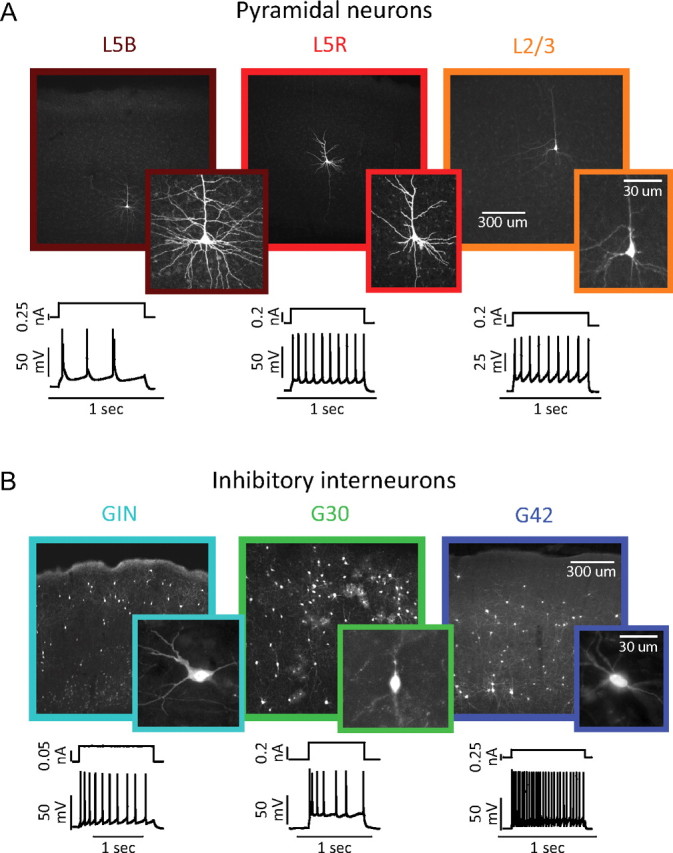
Six electrically and morphologically distinct types of neurons in mouse somatosensory cortex. A, Biocytin-filled reconstructions (top) and intracellular recordings (bottom) showing the laminar location, morphology, and spiking responses typical of layer 5 bursting (left, dark red), layer 5 regular-spiking (center, red), and layer 2/3 regular-spiking (right, orange) pyramidal neurons. B, Biocytin-filled reconstructions (top) and intracellular recordings (bottom) showing the laminar location, morphology, and spiking responses typical of GFP+ inhibitory neurons in the GIN (left, cyan, adapting-spiking), G30/SZ (center, green, irregular-spiking), and G42 (right, blue, fast-spiking).
Our experimental approach and data analysis methods are first exemplified in Figure 2, for a representative irregular-spiking inhibitory neuron. To examine how slow changes in the level of network activity interact with changes in fast synchronized inhibition to affect the responsiveness of these different neuronal types, each neuron was depolarized (Fig. 2A, tonic excitation) until it fired action potentials at least 3 Hz (Fig. 2Ba, example trace). Superimposed on this stimulus was a fluctuating 40 Hz sinusoidal hyperpolarizing current whose mean offset and amplitude varied randomly from trial to trial (Fig. 2A, fluctuating inhibition). To mimic changes in the synchrony of the inhibitory inputs of the cell without changes to the overall drive to the neuron, the mean level of hyperpolarizing current was maintained while changing the amplitude of the gamma-frequency sine wave, and spike rate was measured in each condition (Fig. 2Bd, green horizontal overlay). To mimic changes in the overall amount of inhibitory drive to a neuron without changes in the fast temporal structure, the mean level of hyperpolarizing current was changed without changing the amplitude of the superimposed sine wave, and spike rate was measured in each condition (Fig. 2Bd, green vertical overlay). Trials with differing levels of tonic inhibition and input synchrony were randomly interleaved to avoid systematic changes that might affect the responses of the cell (see Materials and Methods).
Figure 2.

Gamma-oscillation stimulation protocol and analysis. A, Neurons were stimulated with a constant level (Ibase) of depolarizing current (middle) and a fluctuating hyperpolarizing current (top). On each 500-ms-long trial, stimuli were constructed by randomly adding one of 10 levels of tonic inhibition (“input mean”) (equal intervals, ranging from 0 to Ibase) to a zero-mean 40 Hz oscillatory current (“input synchrony”) with an amplitude of 1 of 10 randomly selected values (equal intervals, ranging from 0 to Ibase). B, Sample responses to low-mean, low-synchrony inputs (a), low-mean, high-synchrony inputs (b), and high-mean, low-synchrony inputs (c). d, The responsiveness of the cell (black to white) systematically varied with mean inhibitory current (vertical axes) and inhibitory synchrony (horizontal axes). Responsiveness was reduced as the amount of inhibition increased (green vertical overlay) and increased as the inhibition became more synchronized (green horizontal overlay). Ca, Dependence of spike rate on input synchrony, for each level of mean inhibition. The green line represents the green-highlighted horizontal segment of Bd. Lighter gray, Less mean inhibition. b, Dependence of output spike rate on mean inhibition, for each level of input synchrony. The green line represents the green-highlighted vertical segment of Bd. Lighter gray, More inhibitory synchrony.
For each neuron, the response to changing levels of inhibition and changing levels of input synchrony was displayed as a summary grid (Fig. 2Bd). Each combination of input mean and input synchrony is represented by one box in the grid; brighter boxes represent combinations that typically elicit more action potentials. Horizontal slices through the grid represent the effect of changes in input synchrony on spike output, for a given mean (Fig. 2Bd, green horizontal overlay; Ca, green line). Vertical slices through the grid represent the effect of changes in mean inhibition, for a given level of inhibitory synchrony (Fig. 2Bd, green vertical overlay; Cb, green line). The full families of input–output curves are shown in Figure 2C.
Typical responses from the six types of neurons are shown in Figure 3, A and B, and population responses are shown in Figure 3, C and D. The different types of neurons systematically differed in their relative responses to changes in input mean and synchrony. Neurons whose response was relatively synchrony independent (Fig. 3Aa,Ba) showed approximately horizontal grid isoclines, approximately flat input–output curves for spike rate as a function of input synchrony (shown above the grids), and their input–output curves for spike rate as a function of mean inhibition (shown to the right of the grids) overlapped. Conversely, neurons whose response was relatively synchrony dependent (Fig. 3Ab,c;Bb,c) showed diagonal grid isoclines and sloped input–output curves for spike rate as a function of input synchrony. The spike rate dependence on input mean and synchrony of each neuron was calculated by taking the median of the slopes of the spike frequency–current (F–I) relationship about the midpoint for each condition. Relative synchrony dependence was quantified by dividing the synchrony dependence of the neuron by its mean dependence.
Figure 3.

Systematic, cell type-specific differences in responsiveness to gamma-band oscillatory synchronized inhibition. A, Typical responses of three types of pyramidal neurons: layer 5 bursting (L5B) (a), layer 5 regular spiking (L5R) (b), and layer 2/3 regular spiking (L2/3) (c). All of the firing rates of the example pyramidal cells change gradually with changes in mean drive, indicating a high dynamic range (“DR”) (in picoamperes/spike: L5B, 28; L5, 32; L2/3, 31). The example L2/3 and L5R pyramidal neurons show substantial dependence of firing rates on changes in input synchrony, normalized by changes in input mean (normalized synchrony dependence or “NSD,” unitless ratio: L2/3, 0.5; L5R, 0.35), whereas the firing rate of the L5B neuron is relatively unaffected by changes in input synchrony (NSD, 0.12). B, Typical responses of three types of inhibitory interneurons from the GIN, G30, and G42 mouse lines. The firing rates of the GIN and G30 neurons gradually change with changes in mean drive (DR in picoamperes/spike: GIN, 30; G30, 9). However, the firing rate of the GIN neuron is relatively unaffected by changes in input synchrony (NSD, 0.12), whereas the firing rate of the G30 neuron gradually increases with input synchrony (NSD, 0.5). The firing rate of the G42 neuron changes abruptly with changes in mean drive (DR, 0.7 pA/spike) and is strongly affected by changes in input synchrony (NSD, 1.1). C, Top, The six cell types differed in their normalized synchrony dependence (n = 47 cells). L5B, Dark red triangle, n = 8; L5R, red right triangle, n = 9; L2/3, orange left triangle, n = 10; GIN, cyan square, n = 5; G30, green diamond, n = 9; and G42, blue circle, n = 6. Bottom, Significant differences in normalized synchrony dependence between cell types (Kruskal–Wallis p < 0.05 after Benjamini–Hochberg multiple-comparisons correction) are indicated by the corresponding cell marker. D, Top, The median dependence of firing rate on changes on input mean (picoamperes per spike; n = 47 cells). Bottom, Significant differences (Kruskal–Wallis p < 0.05 after Benjamini–Hochberg multiple-comparisons correction) are indicated by the corresponding cell marker.
G42 fast-spiking neurons (Fig. 3Bc;C, blue circles) (n = 6) had the largest normalized synchrony dependence (Kruskal–Wallis, p < 0.05); these neurons were nearly as sensitive to changes in inhibitory synchrony as to changes in inhibitory mean. Bursting layer 5 pyramidal neurons (Fig. 3Aa;C, dark red up triangles) (n = 8) and GIN regular-spiking inhibitory neurons (Fig. 3Ba;C, cyan squares) (n = 5) had the smallest normalized synchrony dependence (Kruskal–Wallis, p < 0.05); these neurons were much more sensitive to changes in the overall drive to the cell than to changes in the synchrony of the inputs, and increases in the amplitude of the fast fluctuating input had little impact on their spike rate (Fig. 3Aa,Ba). L5R (Fig. 3Ab;C, red triangles) (n = 9) and L2/3 (Fig. 3Ac;C, orange triangles) (n = 10) excitatory neurons, and G30 (Fig. 3Bb;C, green diamonds) (n = 9) inhibitory neurons, increased their spike rate as the amplitude of the gamma oscillation increased and had intermediate normalized synchrony dependences.
The cell types also differed in their dynamic range: the responses of some neurons were all-or-none (i.e., changes in input mean or synchrony abruptly shifted them from never firing to firing at their maximum rate), whereas some showed graded responses. Because L5B (Fig. 3Aa) and GIN (Fig. 3Ba) neurons were insensitive to changes in the synchrony of inhibitory input, the dynamic ranges of all neurons were quantified by measuring the shallowness of the slope of the spike rate dependence on changes in mean inhibition. G42 fast-spiking neurons had the smallest dynamic range of the cell types (Fig. 3D, blue circles), either firing at every cycle of gamma or not at all. Pyramidal neurons of all types had the largest dynamic range (Fig. 3A;D, triangles); the responses of these neurons changed gradually with changes in inhibitory mean or synchrony. GIN regular-spiking inhibitory neurons exhibited the most variable dynamic ranges (Fig. 3D, cyan squares) and did not significantly differ from any other neuronal types. These results suggest that there are cell type-specific variations in the range over which changes in the level of tonic inhibition can affect neuronal responsiveness. What features of the biophysics of the cells might account for these differences?
Synchrony dependence and passive membrane properties
The input resistance and membrane capacitance of a cell act as a low-pass filter attenuating responses to inputs at high frequencies (Hutcheon and Yarom, 2000), leading us to hypothesize that the differences in relative synchrony dependence between cell types was attributable to differences in their average time constants. Consistent with this hypothesis, in a simple Hodgkin–Huxley-style model neuron stimulated with the same current protocol as the real neurons, output spike rate was nearly independent of input synchrony (Fig. 4Aa). Decreasing the time constant, either by decreasing the membrane capacitance (Fig. 4A, a→b) or by decreasing the total input resistance (Fig. 4A, a→c), increased the relative responsiveness of the model cell to changes in input synchrony.
To assess these relationships in our experimental data, for 47 recorded neurons, we compared their time constants with their normalized synchrony dependences, revealing a strong correlation (Spearman's r = −0.84; p = 4.11 e-013) (Fig. 4B). These results suggest that neurons with long time constants (Fig. 4Ba) filter out the fast fluctuations in their inputs and simply respond to the mean level of inhibition, whereas neurons with short time constants (Fig. 4Bb) can follow both slow changes in network activity and fast fluctuations in inhibitory drive.
To confirm our hypothesis that the time constant of the neuron controls the ability of gamma-frequency input to affect neuronal responsiveness, in layer V pyramidal neurons that were initially unresponsive to input synchrony, dynamic clamp was used to add a leak conductance (a constant conductance whose reversal potential matched the resting potential of the cell). The addition of leak conductance effectively decreased the membrane resistance and time constants of the cells (Fig. 4D, a→b→c). This manipulation caused synchrony-independent neurons to develop synchrony dependence. Across n = 7 layer 5 neurons, increasing leak conductance reliably increased the normalized synchrony dependence of the neuron (Friedman's p = 0.0009) (Fig. 4D).
Dynamic range and spike afterhyperpolarizations
Medium- and long-duration AHPs affect both the minimum achievable spike rate frequency and the frequency range that cells respond to (Schreiber et al., 2004; Prescott and Sejnowski, 2008). Different neurons vary greatly in the shape and amplitude of their AHPs, from a few milliseconds to several seconds (Sah and Faber, 2002). We thus hypothesized that differences in the range over which changes in network activity and fast fluctuating input affected neuronal responsiveness might be attributable to differences in their AHPs. To determine the potential impact of AHP conductances on the dynamic range of a neuron, we varied the amount and duration of the AHP conductance in a simple single-compartment Hodgkin–Huxley-style model neuron. Increasing the AHP conductance (Fig. 5A, a→b) or AHP duration (Fig. 5A, a→c) increased the dynamic range of the model cell: the model cell became responsive to a larger range of changes in mean inhibition (Fig. 5Ab,c, top to bottom) and inhibitory synchrony (Fig. 5Ab,c, left to right).
Consistent with this hypothesis, in 47 recorded cells, the AHP duration was closely correlated with the dynamic range (Spearman's r = 0.64; p = 1.37 e-006) (Fig. 5Ba). However, because the shallowness of the mean dependence, which is measured as picoamperes/spikes, can be distorted by combining neurons with drastically different conductances, we separately analyzed the data for cells with a more narrow range of input resistances. When only neurons with similar input resistance between 50 and 200 MΩ are plotted (Fig. 5Bb), an even stronger correlation between dynamic range and AHP duration is revealed (n = 31; r = 0.74; p = 6.93 e-006). Neurons with a short AHP duration (Fig. 1B, G42) are able to fire every time there is a relief of inhibition, provided that the neuron is sufficiently excited; conversely, neurons with a long AHP duration (Fig. 1A, pyramidal neurons) are still hyperpolarized during the next peak of the gamma cycle after firing an action potential, but increased levels of excitation can counteract this accumulated AHP, leading to an increased range over which neurons are responsive to changes in the level of inhibitory input.
To confirm these results, we used dynamic clamp to add an AHP conductance to G42 fast-spiking neurons, which initially all exhibited a small dynamic range (Fig. 3D, blue circles). Increasing the amount (in nS) (Fig. 5C, a→b) or the duration (Fig. 5C, a→c) of the additional AHP clearly increased the range over which changes in the level and structure of the inhibition affected the responses of the neurons. In n = 5 G42 cells, increasing the AHP amount (in nanosiemens) (Fig. 5Cd) (Friedman's p < 0.01) or duration (in milliseconds) (Fig. 5Ce) (Friedman's p < 0.01) reliably increased the dynamic range of the neuron.
Network activity changes the responsiveness of neurons to gamma oscillations
Different neuron types differ in the degree to which they are intrinsically responsive to gamma-band synchrony in their inputs, but all cortical neurons are embedded in recurrent networks. When these networks are active, their constituent neurons deluge one another with excitatory and inhibitory synaptic inputs. These inputs, together, can be large enough to substantially alter the effective input resistances and time constants of neurons (Paré et al., 1998; Shu et al., 2003; Haider et al., 2006; Cardin et al., 2008) (for review, see Haider and McCormick, 2009). Since membrane time constant is a key determinant of neuronal filtering properties, can increases in local network activity permit gamma oscillatory synaptic inputs to control the output of neurons, even for neurons whose intrinsic properties ordinarily make them unresponsive to gamma oscillations?
In a model neuron whose output is initially unaffected by gamma-frequency input synchrony (Fig. 6Aa), increasing the level of synaptic input of the neuron, by scaling up the inhibitory and excitatory conductance stimuli, causes the output of the neuron to become relatively more dependent on input synchrony (Fig. 6Ab). The same effect can also be seen in real neurons, by using dynamic clamp to generate artificial excitatory and inhibitory conductance stimuli (rather than depolarizing and hyperpolarizing current stimuli). An example L5 neuron whose response rate is unaffected by gamma-frequency input synchrony (Fig. 6B) becomes progressively more affected by changes in input synchrony as the excitatory and inhibitory conductance inputs are scaled up (Fig. 6C, a→c). Across n = 6 large bursting pyramidal neurons, scaling up the artificial synaptic drive significantly increased the normalized synchrony dependence by an average of 0.59 ± 0.37 (unitless; Friedman's p = 0.0025) (Fig. 6Da). In n = 13 neurons, including bursting and regular-spiking layer 5 and layer 2/3 pyramidal neurons, and G30, GIN, and G42 inhibitory neurons, additional drive increased the normalized synchrony dependence in all cases (by an average of 0.58 ± 0.26; unitless; Friedman's p = 7.7 e-007) (Fig. 6Db).
Discussion
Many groups have found that the generation of gamma-frequency oscillations involves the activation of networks of fast-spiking inhibitory neurons, which changes both the level and structure of inhibition in the local network (Whittington et al., 1995; Tamás et al., 2000; Freund, 2003) (for review, see Bartos et al., 2007; Fries, 2009). Because of their gap junction coupling (Galarreta and Hestrin, 2001, 2002), fast inhibitory synaptic connections (Bartos et al., 2001, 2002; Galarreta and Hestrin, 2002), narrow action potentials (Erisir et al., 1999), and low attenuation of high-frequency inputs (Fellous et al., 2001; Hasenstaub et al., 2005), these neurons tend to synchronize their firing at gamma frequencies, generating oscillatory inhibition (Hasenstaub et al., 2005; Cardin et al., 2009; Sohal et al., 2009). Fast-spiking interneurons make both divergent and convergent contacts onto the perisomatic compartments of other cortical neurons, producing strong and effective hyperpolarizations in their targets (Miles et al., 1996; Kawaguchi and Kubota, 1998; Papp et al., 2001; Tamás et al., 2004). Because cortical neurons vary in their laminar distribution and connectivity, different types of neurons may vary in the amplitude and timing of the synchronized inhibition they receive during gamma activity. In addition, because of differences in their biophysical properties, neurons will likely differ in how they integrate these inhibitory inputs. Here, we examined how changes in inhibitory tone and changes in inhibitory structure interact to control neuronal responsiveness, and how these interactions differ in different elements of the cortical circuit.
Cell type-specific differences in gamma-frequency input integration
Cell types differed considerably in both their relative dependence on tonic versus gamma-band oscillatory inhibition (Fig. 3C) as well as the range over which changes in the level and structure of inhibition affected their spike rate (Fig. 3D). Differences between the passive filtering properties (Fig. 4) and active conductances (Fig. 5) of the neurons help explain these variations.
G42 fast-spiking inhibitory neurons are the most sensitive to changes in gamma-band input synchrony and have the smallest dynamic range. Their short time constant and brief AHPs allow them to track gamma-frequency inputs and, if sufficiently excited, spike on every cycle of gamma, consistent with previous studies showing that these cells can follow fast-changing inputs (Fellous et al., 2001; Hasenstaub et al., 2005) and are key generators of gamma activity in the cortex (Cardin et al., 2009; Sohal et al., 2009). Irregular-spiking inhibitory neurons in the G30 line of mice also had short time constants and brief AHPs, consistent with their relatively large normalized synchrony dependences and small dynamic ranges. Both cell types make perisomatic synaptic contacts on their targets (Freund, 2003), which is the preferred location for regulating spike generation in the soma or axon initial segment. Thus, these neurons are biophysically capable of transforming gamma-band synchrony in their inputs into gamma-band oscillatory inhibition in their targets, implying that these cells are capable of transmitting or amplifying gamma oscillations through the local network.
The GIN inhibitory neurons were the most varied in their dynamic ranges. The GIN mouse line labels a relatively diverse population of neurons, with both monophasic and multiphasic afterhyperpolarizations and variable afterdepolarizations (Halabisky et al., 2006), which plausibly accounts for this variation. GIN regular- and low-threshold-spiking inhibitory neurons are reliably the least sensitive of the inhibitory neurons to changes in gamma-frequency input synchrony, consistent with their longer time constants. Since changes in input synchrony cannot increase the spike rates of these neurons, networks of GIN neurons will likely only be inhibited, not entrained, by increases in activity of fast-spiking networks, suggesting an inverse relationship between the activity in these two populations of interneurons. Consistent with this hypothesis, network manipulations that strongly activate low-threshold-spiking GIN neurons do not activate fast-spiking interneurons (Fanselow et al., 2008), and manipulations that strongly activate fast-spiking interneurons do not activate LTS interneurons (Cunningham et al., 2004).
Of the pyramidal neurons, layer 5 bursting neurons (L5B) responded least to changes in gamma-band input synchrony, because of their long time constants at rest (Fig. 3C). Although tonic increases in inhibition, if accompanied by increases in inhibitory synchrony, could have a net excitatory influence on other types of pyramidal neurons (Fig. 3Aa,b), they are likely to reliably inhibit the activity of L5B neurons. Among the pyramidal neurons whose firing could be controlled by oscillatory inhibition, their long-lasting AHPs typically inhibited them from firing on successive gamma cycles, but this inhibition was not absolute. This permitted their responses to be controlled in an analog manner by both the level and structure of their inhibitory inputs.
Fast, flexible control of gamma-frequency input integration
Although observations in vitro are useful for the elucidation of basic cellular properties, we note that these properties are in fact under rapid control. The time constant of a neuron depends on its membrane conductance: opening or closing any ligand- or voltage-gated ion channel will change the effective input resistance of the neuron, thus changing the frequency dependence of its input filtering and, as we have shown here, affect the ability of gamma-frequency input to control its firing. Therefore, neurons embedded in active networks will likely be more strongly affected by gamma-band input synchrony. Indeed, we found that using dynamic clamp to simulate increases in synaptic drive created the ability to respond to gamma-frequency oscillatory input in cells, such as L5 bursting neurons, that are not ordinarily responsive to gamma (Fig. 6), and enhanced responsiveness to gamma-oscillatory input in neurons of other types. These results suggest that increased background activity will likely increase the ability of the whole network to generate and transmit gamma oscillations. Consistent with this, increases in gamma activity often occur during periods of high network activity, including the peak of slower oscillations (Csicsvari et al., 2003; Freeman et al., 2003; Hasenstaub et al., 2005; Lakatos et al., 2005, 2008; Canolty et al., 2006), or periods of increased arousal or attention (Fries et al., 2001; Womelsdorf et al., 2006; Buschman and Miller, 2007; Lakatos et al., 2008).
Furthermore, the afterhyperpolarization amplitude and kinetics of neurons can be dynamically modulated (for review, see Vogalis et al., 2002). For instance, the slow AHP conductance (gsAHP) is regulated by a balance of phosphorylation and dephosphorylation in which activation of the cAMP/PKA (protein kinase A) pathway reduces the IsAHP, whereas activation of phosphatases leads to an increase in the current (Pedarzani et al., 1998). In many neurons, this conductance is reduced by neurotransmitters that act through G-protein-coupled receptors, such as noradrenaline (McCormick et al., 1991), serotonin (Higgs et al., 2006), glutamate (Nicoll, 1988), and acetylcholine (Blitzer et al., 1994). These same neurotransmitters can also increase network activity (Nicoll, 1988; McCormick et al., 1991; McCormick, 1992; Wang and McCormick, 1993; Steriade et al., 2001). The current study implies that increasing the overall excitability of the network and decreasing AHP duration should increase the likelihood of firing of neurons at IPSP termination, thus enhancing the transmission of gamma oscillatory activity through the whole network. Consistent with this hypothesis, cholinergic agonists have been found to enhance gamma activity in vivo (Rodriguez et al., 2004), and gamma oscillations are evoked in isolated slices using agonists for metabotropic glutamate receptors (Whittington et al., 1995), muscarinic acetylcholine receptors (Fisahn et al., 1998; Fellous and Sejnowski, 2000), and kainate receptors (Hájos et al., 2000; Fisahn et al., 2004).
These studies were performed in somata and single-compartment models. However, similar relationships likely hold in any compartment in which gamma oscillatory input is received and action potentials are generated, potentially including dendrites. The local time constant and the refractory period of local active conductances may play roles analogous to somatic time constant and AHP duration in regulating response dependence on oscillatory input. More generally, the ability of dendritic oscillatory input to control neuronal output will depend on dendritic filtering, which can attenuate or phase-shift specific frequencies, and on the electrotonic distance to the spike-initiating zone, which isolates dendritic conductance changes from somatic current fluxes.
The studies described here delve further into the complex interactions that occur between highly interconnected networks of diverse populations of cortical neuron types. We found that, in some cell types, fast changes in inhibitory structure can overcome the suppressive effects of increases in inhibitory tone; this effect is related to the passive-filtering properties of the cell. We also found cell type differences in the range over which changes in inhibitory tone and structure affect neuronal responsiveness; this dynamic range is related to the active conductances that control the intrinsic periodicity of the cell. Because these passive and active conductances are dynamically regulated in vivo by feedforward and recurrent synaptic activity and intracellular signaling molecules, neuronal responsiveness to inhibitory tone and structure can be changed over a range of timescales to suit the changing computational requirements of the network. Future studies will better reveal how each cell type contributes to and is regulated by dynamic changes in vivo as well as how dysregulation of these circuits at the genetic, molecular, cellular, and network levels contributes to neurological disease.
Footnotes
This work was supported by National Institutes of Health Grant MH063912, the Crick–Jacobs Center for Theoretical and Computational Biology, the Aginsky Foundation, and the Kavli Institute for Brain and Mind. We thank members of the Callaway Laboratory, Terry Sejnowski, and Massimo Scanziani for helpful discussions.
References
- Bartos M, Vida I, Frotscher M, Geiger JR, Jonas P. Rapid signaling at inhibitory synapses in a dentate gyrus interneuron network. J Neurosci. 2001;21:2687–2698. doi: 10.1523/JNEUROSCI.21-08-02687.2001. [DOI] [PMC free article] [PubMed] [Google Scholar]
- Bartos M, Vida I, Frotscher M, Meyer A, Monyer H, Geiger JR, Jonas P. Fast synaptic inhibition promotes synchronized gamma oscillations in hippocampal interneuron networks. Proc Natl Acad Sci U S A. 2002;99:13222–13227. doi: 10.1073/pnas.192233099. [DOI] [PMC free article] [PubMed] [Google Scholar]
- Bartos M, Vida I, Jonas P. Synaptic mechanisms of synchronized gamma oscillations in inhibitory interneuron networks. Nat Rev Neurosci. 2007;8:45–56. doi: 10.1038/nrn2044. [DOI] [PubMed] [Google Scholar]
- Başar E, Güntekin B. A review of brain oscillations in cognitive disorders and the role of neurotransmitters. Brain Res. 2008;1235:172–193. doi: 10.1016/j.brainres.2008.06.103. [DOI] [PubMed] [Google Scholar]
- Blitzer RD, Wong T, Nouranifar R, Landau EM. The cholinergic inhibition of afterhyperpolarization in rat hippocampus is independent of cAMP-dependent protein kinase. Brain Res. 1994;646:312–314. doi: 10.1016/0006-8993(94)90096-5. [DOI] [PubMed] [Google Scholar]
- Buschman TJ, Miller EK. Top-down versus bottom-up control of attention in the prefrontal and posterior parietal cortices. Science. 2007;315:1860–1862. doi: 10.1126/science.1138071. [DOI] [PubMed] [Google Scholar]
- Canolty RT, Edwards E, Dalal SS, Soltani M, Nagarajan SS, Kirsch HE, Berger MS, Barbaro NM, Knight RT. High gamma power is phase-locked to theta oscillations in human neocortex. Science. 2006;313:1626–1628. doi: 10.1126/science.1128115. [DOI] [PMC free article] [PubMed] [Google Scholar]
- Cardin JA, Palmer LA, Contreras D. Cellular mechanisms underlying stimulus-dependent gain modulation in primary visual cortex neurons in vivo. Neuron. 2008;59:150–160. doi: 10.1016/j.neuron.2008.05.002. [DOI] [PMC free article] [PubMed] [Google Scholar]
- Cardin JA, Carlen M, Meletis K, Knoblich U, Zhang F, Deisseroth K, Tsai LH, Moore CI. Driving fast-spiking cells induces gamma rhythm and controls sensory responses. Nature. 2009;459:663–667. doi: 10.1038/nature08002. [DOI] [PMC free article] [PubMed] [Google Scholar]
- Chattopadhyaya B, Di Cristo G, Higashiyama H, Knott GW, Kuhlman SJ, Welker E, Huang ZJ. Experience and activity-dependent maturation of perisomatic GABAergic innervation in primary visual cortex during a postnatal critical period. J Neurosci. 2004;24:9598–9611. doi: 10.1523/JNEUROSCI.1851-04.2004. [DOI] [PMC free article] [PubMed] [Google Scholar]
- Csicsvari J, Jamieson B, Wise KD, Buzsáki G. Mechanisms of gamma oscillations in the hippocampus of the behaving rat. Neuron. 2003;37:311–322. doi: 10.1016/s0896-6273(02)01169-8. [DOI] [PubMed] [Google Scholar]
- Cunningham MO, Whittington MA, Bibbig A, Roopun A, LeBeau FE, Vogt A, Monyer H, Buhl EH, Traub RD. A role for fast rhythmic bursting neurons in cortical gamma oscillations in vitro. Proc Natl Acad Sci U S A. 2004;101:7152–7157. doi: 10.1073/pnas.0402060101. [DOI] [PMC free article] [PubMed] [Google Scholar]
- Dorval AD, Christini DJ, White JA. Real-Time Linux dynamic clamp: a fast and flexible way to construct virtual ion channels in living cells. Ann Biomed Eng. 2001;29:897–907. doi: 10.1114/1.1408929. [DOI] [PubMed] [Google Scholar]
- Erisir A, Lau D, Rudy B, Leonard CS. Function of specific K+ channels in sustained high-frequency firing of fast-spiking neocortical interneurons. J Neurophysiol. 1999;82:2476–2489. doi: 10.1152/jn.1999.82.5.2476. [DOI] [PubMed] [Google Scholar]
- Fanselow EE, Richardson KA, Connors BW. Selective, state-dependent activation of somatostatin-expressing inhibitory interneurons in mouse neocortex. J Neurophysiol. 2008;100:2640–2652. doi: 10.1152/jn.90691.2008. [DOI] [PMC free article] [PubMed] [Google Scholar]
- Fellous JM, Sejnowski TJ. Cholinergic induction of oscillations in the hippocampal slice in the slow (0.5–2 Hz), theta (5–12 Hz), and gamma (35–70 Hz) bands. Hippocampus. 2000;10:187–197. doi: 10.1002/(SICI)1098-1063(2000)10:2<187::AID-HIPO8>3.0.CO;2-M. [DOI] [PubMed] [Google Scholar]
- Fellous JM, Houweling AR, Modi RH, Rao RP, Tiesinga PH, Sejnowski TJ. Frequency dependence of spike timing reliability in cortical pyramidal cells and interneurons. J Neurophysiol. 2001;85:1782–1787. doi: 10.1152/jn.2001.85.4.1782. [DOI] [PubMed] [Google Scholar]
- Fisahn A, Pike FG, Buhl EH, Paulsen O. Cholinergic induction of network oscillations at 40 Hz in the hippocampus in vitro. Nature. 1998;394:186–189. doi: 10.1038/28179. [DOI] [PubMed] [Google Scholar]
- Fisahn A, Contractor A, Traub RD, Buhl EH, Heinemann SF, McBain CJ. Distinct roles for the kainate receptor subunits GluR5 and GluR6 in kainate-induced hippocampal gamma oscillations. J Neurosci. 2004;24:9658–9668. doi: 10.1523/JNEUROSCI.2973-04.2004. [DOI] [PMC free article] [PubMed] [Google Scholar]
- Freeman WJ, Holmes MD, Burke BC, Vanhatalo S. Spatial spectra of scalp EEG and EMG from awake humans. Clin Neurophysiol. 2003;114:1053–1068. doi: 10.1016/s1388-2457(03)00045-2. [DOI] [PubMed] [Google Scholar]
- Freund TF. Interneuron diversity series: rhythm and mood in perisomatic inhibition. Trends Neurosci. 2003;26:489–495. doi: 10.1016/S0166-2236(03)00227-3. [DOI] [PubMed] [Google Scholar]
- Fries P. Neuronal gamma-band synchronization as a fundamental process in cortical computation. Annu Rev Neurosci. 2009;32:209–224. doi: 10.1146/annurev.neuro.051508.135603. [DOI] [PubMed] [Google Scholar]
- Fries P, Neuenschwander S, Engel AK, Goebel R, Singer W. Rapid feature selective neuronal synchronization through correlated latency shifting. Nat Neurosci. 2001;4:194–200. doi: 10.1038/84032. [DOI] [PubMed] [Google Scholar]
- Fries P, Nikolić D, Singer W. The gamma cycle. Trends Neurosci. 2007;30:309–316. doi: 10.1016/j.tins.2007.05.005. [DOI] [PubMed] [Google Scholar]
- Galarreta M, Hestrin S. Electrical synapses between GABA-releasing interneurons. Nat Rev Neurosci. 2001;2:425–433. doi: 10.1038/35077566. [DOI] [PubMed] [Google Scholar]
- Galarreta M, Hestrin S. Electrical and chemical synapses among parvalbumin fast-spiking GABAergic interneurons in adult mouse neocortex. Proc Natl Acad Sci U S A. 2002;99:12438–12443. doi: 10.1073/pnas.192159599. [DOI] [PMC free article] [PubMed] [Google Scholar]
- Galarreta M, Erdélyi F, Szabó G, Hestrin S. Electrical coupling among irregular-spiking GABAergic interneurons expressing cannabinoid receptors. J Neurosci. 2004;24:9770–9778. doi: 10.1523/JNEUROSCI.3027-04.2004. [DOI] [PMC free article] [PubMed] [Google Scholar]
- Haider B, McCormick DA. Rapid neocortical dynamics: cellular and network mechanisms. Neuron. 2009;62:171–189. doi: 10.1016/j.neuron.2009.04.008. [DOI] [PMC free article] [PubMed] [Google Scholar]
- Haider B, Duque A, Hasenstaub AR, McCormick DA. Neocortical network activity in vivo is generated through a dynamic balance of excitation and inhibition. J Neurosci. 2006;26:4535–4545. doi: 10.1523/JNEUROSCI.5297-05.2006. [DOI] [PMC free article] [PubMed] [Google Scholar]
- Hájos N, Katona I, Naiem SS, MacKie K, Ledent C, Mody I, Freund TF. Cannabinoids inhibit hippocampal GABAergic transmission and network oscillations. Eur J Neurosci. 2000;12:3239–3249. doi: 10.1046/j.1460-9568.2000.00217.x. [DOI] [PubMed] [Google Scholar]
- Halabisky B, Shen F, Huguenard JR, Prince DA. Electrophysiological classification of somatostatin-positive interneurons in mouse sensorimotor cortex. J Neurophysiol. 2006;96:834–845. doi: 10.1152/jn.01079.2005. [DOI] [PubMed] [Google Scholar]
- Hasenstaub A, Shu Y, Haider B, Kraushaar U, Duque A, McCormick DA. Inhibitory postsynaptic potentials carry synchronized frequency information in active cortical networks. Neuron. 2005;47:423–435. doi: 10.1016/j.neuron.2005.06.016. [DOI] [PubMed] [Google Scholar]
- Herrmann CS, Demiralp T. Human EEG gamma oscillations in neuropsychiatric disorders. Clin Neurophysiol. 2005;116:2719–2733. doi: 10.1016/j.clinph.2005.07.007. [DOI] [PubMed] [Google Scholar]
- Higgs MH, Slee SJ, Spain WJ. Diversity of gain modulation by noise in neocortical neurons: regulation by the slow afterhyperpolarization conductance. J Neurosci. 2006;26:8787–8799. doi: 10.1523/JNEUROSCI.1792-06.2006. [DOI] [PMC free article] [PubMed] [Google Scholar]
- Hutcheon B, Yarom Y. Resonance, oscillation and the intrinsic frequency preferences of neurons. Trends Neurosci. 2000;23:216–222. doi: 10.1016/s0166-2236(00)01547-2. [DOI] [PubMed] [Google Scholar]
- Jensen O, Kaiser J, Lachaux JP. Human gamma-frequency oscillations associated with attention and memory. Trends Neurosci. 2007;30:317–324. doi: 10.1016/j.tins.2007.05.001. [DOI] [PubMed] [Google Scholar]
- Kasper EM, Lübke J, Larkman AU, Blakemore C. Pyramidal neurons in layer 5 of the rat visual cortex. III. Differential maturation of axon targeting, dendritic morphology, and electrophysiological properties. J Comp Neurol. 1994;339:495–518. doi: 10.1002/cne.903390404. [DOI] [PubMed] [Google Scholar]
- Kawaguchi Y. Physiological, morphological, and histochemical characterization of three classes of interneurons in rat neostriatum. J Neurosci. 1993;13:4908–4923. doi: 10.1523/JNEUROSCI.13-11-04908.1993. [DOI] [PMC free article] [PubMed] [Google Scholar]
- Kawaguchi Y, Kubota Y. Neurochemical features and synaptic connections of large physiologically-identified GABAergic cells in the rat frontal cortex. Neuroscience. 1998;85:677–701. doi: 10.1016/s0306-4522(97)00685-4. [DOI] [PubMed] [Google Scholar]
- Klausberger T, Magill PJ, Marton LF, Roberts JD, Cobden PM, Buzsaki G, Somogyi P. Brain-state- and cell-type-specific firing of hippocampal interneurons in vivo. Nature. 2003;421:844–848. doi: 10.1038/nature01374. [DOI] [PubMed] [Google Scholar]
- Lakatos P, Shah AS, Knuth KH, Ulbert I, Karmos G, Schroeder CE. An oscillatory hierarchy controlling neuronal excitability and stimulus processing in the auditory cortex. J Neurophysiol. 2005;94:1904–1911. doi: 10.1152/jn.00263.2005. [DOI] [PubMed] [Google Scholar]
- Lakatos P, Karmos G, Mehta AD, Ulbert I, Schroeder CE. Entrainment of neuronal oscillations as a mechanism of attentional selection. Science. 2008;320:110–113. doi: 10.1126/science.1154735. [DOI] [PubMed] [Google Scholar]
- López-Bendito G, Sturgess K, Erdélyi F, Szabó G, Molnár Z, Paulsen O. Preferential origin and layer destination of GAD65-GFP cortical interneurons. Cereb Cortex. 2004;14:1122–1133. doi: 10.1093/cercor/bhh072. [DOI] [PubMed] [Google Scholar]
- Markram H, Toledo-Rodriguez M, Wang Y, Gupta A, Silberberg G, Wu C. Interneurons of the neocortical inhibitory system. Nat Rev Neurosci. 2004;5:793–807. doi: 10.1038/nrn1519. [DOI] [PubMed] [Google Scholar]
- McCormick DA. Neurotransmitter actions in the thalamus and cerebral cortex. J Clin Neurophysiol. 1992;9:212–223. doi: 10.1097/00004691-199204010-00004. [DOI] [PubMed] [Google Scholar]
- McCormick DA, Pape HC, Williamson A. Actions of norepinephrine in the cerebral cortex and thalamus: implications for function of the central noradrenergic system. Prog Brain Res. 1991;88:293–305. doi: 10.1016/s0079-6123(08)63817-0. [DOI] [PubMed] [Google Scholar]
- McLelland D, Paulsen O. Neuronal oscillations and the rate-to-phase transform: mechanism, model and mutual information. J Physiol. 2009;587:769–785. doi: 10.1113/jphysiol.2008.164111. [DOI] [PMC free article] [PubMed] [Google Scholar]
- Miles R, Tóth K, Gulyás AI, Hájos N, Freund TF. Differences between somatic and dendritic inhibition in the hippocampus. Neuron. 1996;16:815–823. doi: 10.1016/s0896-6273(00)80101-4. [DOI] [PubMed] [Google Scholar]
- Nicoll RA. The coupling of neurotransmitter receptors to ion channels in the brain. Science. 1988;241:545–551. doi: 10.1126/science.2456612. [DOI] [PubMed] [Google Scholar]
- Oliva AA, Jr, Jiang M, Lam T, Smith KL, Swann JW. Novel hippocampal interneuronal subtypes identified using transgenic mice that express green fluorescent protein in GABAergic interneurons. J Neurosci. 2000;20:3354–3368. doi: 10.1523/JNEUROSCI.20-09-03354.2000. [DOI] [PMC free article] [PubMed] [Google Scholar]
- Papp E, Leinekugel X, Henze DA, Lee J, Buzsáki G. The apical shaft of CA1 pyramidal cells is under GABAergic interneuronal control. Neuroscience. 2001;102:715–721. doi: 10.1016/s0306-4522(00)00584-4. [DOI] [PubMed] [Google Scholar]
- Paré D, Shink E, Gaudreau H, Destexhe A, Lang EJ. Impact of spontaneous synaptic activity on the resting properties of cat neocortical pyramidal neurons in vivo. J Neurophysiol. 1998;79:1450–1460. doi: 10.1152/jn.1998.79.3.1450. [DOI] [PubMed] [Google Scholar]
- Pedarzani P, Krause M, Haug T, Storm JF, Stuhmer W. Modulation of the Ca2+-activated K+ current sIAHP by a phosphatase-kinase balance under basal conditions in rat CA1 pyramidal neurons. J Neurophysiol. 1998;79:3252–3256. doi: 10.1152/jn.1998.79.6.3252. [DOI] [PubMed] [Google Scholar]
- Prescott SA, Sejnowski TJ. Spike-rate coding and spike-time coding are affected oppositely by different adaptation mechanisms. J Neurosci. 2008;28:13649–13661. doi: 10.1523/JNEUROSCI.1792-08.2008. [DOI] [PMC free article] [PubMed] [Google Scholar]
- Rodriguez R, Kallenbach U, Singer W, Munk MH. Short- and long-term effects of cholinergic modulation on gamma oscillations and response synchronization in the visual cortex. J Neurosci. 2004;24:10369–10378. doi: 10.1523/JNEUROSCI.1839-04.2004. [DOI] [PMC free article] [PubMed] [Google Scholar]
- Sah P, Faber ES. Channels underlying neuronal calcium-activated potassium currents. Prog Neurobiol. 2002;66:345–353. doi: 10.1016/s0301-0082(02)00004-7. [DOI] [PubMed] [Google Scholar]
- Schreiber S, Fellous JM, Tiesinga P, Sejnowski TJ. Influence of ionic conductances on spike timing reliability of cortical neurons for suprathreshold rhythmic inputs. J Neurophysiol. 2004;91:194–205. doi: 10.1152/jn.00556.2003. [DOI] [PMC free article] [PubMed] [Google Scholar]
- Shu Y, Hasenstaub A, McCormick DA. Turning on and off recurrent balanced cortical activity. Nature. 2003;423:288–293. doi: 10.1038/nature01616. [DOI] [PubMed] [Google Scholar]
- Sohal VS, Zhang F, Yizhar O, Deisseroth K. Parvalbumin neurons and gamma rhythms enhance cortical circuit performance. Nature. 2009;459:698–702. doi: 10.1038/nature07991. [DOI] [PMC free article] [PubMed] [Google Scholar]
- Steriade M, Timofeev I, Grenier F. Natural waking and sleep states: a view from inside neocortical neurons. J Neurophysiol. 2001;85:1969–1985. doi: 10.1152/jn.2001.85.5.1969. [DOI] [PubMed] [Google Scholar]
- Szabadics J, Lorincz A, Tamás G. Beta and gamma frequency synchronization by dendritic GABAergic synapses and gap junctions in a network of cortical interneurons. J Neurosci. 2001;21:5824–5831. doi: 10.1523/JNEUROSCI.21-15-05824.2001. [DOI] [PMC free article] [PubMed] [Google Scholar]
- Tamás G, Buhl EH, Lörincz A, Somogyi P. Proximally targeted GABAergic synapses and gap junctions synchronize cortical interneurons. Nat Neurosci. 2000;3:366–371. doi: 10.1038/73936. [DOI] [PubMed] [Google Scholar]
- Tamás G, Buhl EH, Lörincz A, Somogyi P. Input and frequency-specific entrainment of postsynaptic firing by IPSPs of perisomatic or dendritic origin. Eur J Neurosci. 2004;20:2681–2690. doi: 10.1111/j.1460-9568.2004.03719.x. [DOI] [PubMed] [Google Scholar]
- Tiesinga PH, Fellous JM, Salinas E, José JV, Sejnowski TJ. Inhibitory synchrony as a mechanism for attentional gain modulation. J Physiol Paris. 2004;98:296–314. doi: 10.1016/j.jphysparis.2005.09.002. [DOI] [PMC free article] [PubMed] [Google Scholar]
- Vogalis F, Harvey JR, Neylon CB, Furness JB. Regulation of K+ channels underlying the slow afterhyperpolarization in enteric afterhyperpolarization-generating myenteric neurons: role of calcium and phosphorylation. Clin Exp Pharmacol Physiol. 2002;29:935–943. doi: 10.1046/j.1440-1681.2002.03755.x. [DOI] [PubMed] [Google Scholar]
- Wang Z, McCormick DA. Control of firing mode of corticotectal and corticopontine layer V burst-generating neurons by norepinephrine, acetylcholine, and 1S,3R-ACPD. J Neurosci. 1993;13:2199–2216. doi: 10.1523/JNEUROSCI.13-05-02199.1993. [DOI] [PMC free article] [PubMed] [Google Scholar]
- Whittington MA, Traub RD, Jefferys JG. Synchronized oscillations in interneuron networks driven by metabotropic glutamate receptor activation. Nature. 1995;373:612–615. doi: 10.1038/373612a0. [DOI] [PubMed] [Google Scholar]
- Womelsdorf T, Fries P. Neuronal coherence during selective attentional processing and sensory-motor integration. J Physiol Paris. 2006;100:182–193. doi: 10.1016/j.jphysparis.2007.01.005. [DOI] [PubMed] [Google Scholar]
- Womelsdorf T, Fries P, Mitra PP, Desimone R. Gamma-band synchronization in visual cortex predicts speed of change detection. Nature. 2006;439:733–736. doi: 10.1038/nature04258. [DOI] [PubMed] [Google Scholar]
- Xu X, Callaway EM. Laminar specificity of functional input to distinct types of inhibitory cortical neurons. J Neurosci. 2009;29:70–85. doi: 10.1523/JNEUROSCI.4104-08.2009. [DOI] [PMC free article] [PubMed] [Google Scholar]
- Xu X, Roby KD, Callaway EM. Mouse cortical inhibitory neuron type that coexpresses somatostatin and calretinin. J Comp Neurol. 2006;499:144–160. doi: 10.1002/cne.21101. [DOI] [PubMed] [Google Scholar]