

Abstract
Interference Reflection microscopy is an optical technique used to study cell adhesion or cell mobility on a glass coverslip. The interference of reflected light waves generates images with high contrast and definition. IRM can be used to examine almost any cell that will rest upon a glass surface, although it is most useful in examining sites of close contact between a cell and substratum. This chapter presents methods for obtaining IRM images of cells with particular emphasis on IRM imaging with a laser scanning confocal microscope (LSCM), as most LSCM are already capable of recording these images without any modification of the instrument. Techniques are presented for imaging fixed and live cells as well as simultaneous multi-channel capture of fluorescence and reflection images.
Keywords: Reflection contrast microscopy, confocal microscopy, contrast enhancement, refractive index, cell adhesion
This unit describes a microscopic technique that uses reflected light to visualize structures at or near a glass coverslip. Interference Reflection Microscopy (IRM), also known as interference contrast, interference reflection contrast, and surface contrast microscopy, has been used to study a wide range of cellular behaviors including cell adhesion, motility, exocytosis and endocytosis. This technique relies on reflections from an incident beam of light as it passes through materials of different refractive indices. In the case of a cell on a glass coverslip, reflected beams are generated as light passes from the coverslip to aqueous medium and again as light goes from the aqueous medium to the cell membrane. These reflected beams interfere, producing either constructive or destructive interference depending on the thickness of the layer of aqueous medium between the cell membrane and the glass surface. For monochromatic light, intensity in the IRM image is a function of the distance between the cell and coverslip and can indicate the strength of adhesion to the surface.
This unit includes protocols for fixed and live cell imaging IRM as well as protocols for coating coverslips for use with this technique. A very wide variety of samples can be imaged by IRM, including embedded material. In fact, the technique was originally used to image mineral samples. However, in this unit, we are concerned with IRM of cells and in particular IRM using a laser scanning confocal microscope. Moreover, a detailed description of IRM of fixed embedded samples using epi-illumination is available (Prins et al., 2005). Specific examples are included with each protocol, but the techniques could be applied very broadly.
STRATEGIC PLANNING
Obtaining images with this technique requires using a microscope with a suitable light path for collecting reflected light, samples with a different refractive index than the embedding medium and an interface between the objective and sample made of material with yet another refractive index, usually glass. Oil immersion objectives must be used and the mounting media should have a lower refractive index than the immersion oil so that the first reflected beam is generated at the coverslip/medium or coverslip/cell interface. Polychromatic light will produce colored interference fringes while monochromatic light produces quantifiable gray scale interference images.
Laser scanning microscopes already possess a suitable light path (Fig 1A) and require only a configuration where the reflected laser light is able to reach a detector through an emission filter that allows the incident light to pass through. Since reflected light is abundant compared to the amount of light emitted by most fluorescent molecules, the laser intensity and detector gain can be reduced for IRM imaging. Simply focusing at the coverslip with a sample containing cells that have adhered to the slide should generate an IRM image. With a slightly different configuration, IRM images can also be collected simultaneously with fluorescent images in systems with multiple detectors. Most spinning disk confocal microscopes do not have a light path that is easily adapted to IRM imaging.
Figure 1.
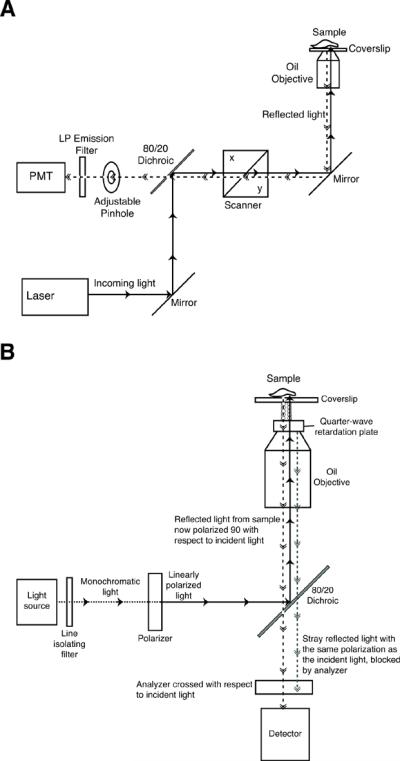
Suitable light paths for IRM imaging (A)Light path in a Laser Scanning Confocal Microscope. The laser, usually 453nm or 633nm, is reflected by the main beamsplitter into the microscope, through the objective where it reflects from the sample. The galvanometric mirrors in the scanner deflect the laser, scanning across the entire field to produce a full image. The reflected beams pass back through the neutral dichroic, 80/20 in this diagram, and are sent to the detector. The emission filter is chosen to allow the incident light to reach the detector. The pinhole can be either completely open or closed down to one Airy Unit.(B) Light path in an epi-illumination microscope. White light from a high pressure mercury or xenon lamp passes through a line isolating filter and a polarizer to produce monochromatic, linearly polarized incident light. The main beamsplitter reflects this light into the microscope, through the objective and then through a quarter-wave retardation plate. The emerging light is now circularly polarized. The reflected light is circularly polarized but with the opposite handedness from the incoming beam. After passing back through the quarter-wave plate, the reflected light is now linearly polarized with an orientation 90° with respect to the incident light. The reflected light passes through the neutral dichroic, 80/20 in this diagram, and through the analyzer, a second polarizing filter oriented 90° relative to the first polarizer, to reach the detector. Stray light from internal reflections in the microscope will be linearly polarized with the original orientation and will not pass through the analyzer to the detector.
Non-confocal epi-illumination microscopes can also be used to collect IRM images, but some modification of the light path is usually needed to enhance contrast and reduce stray reflections that might other wise overwhelm the IRM image (Fig 1B). Stray reflections are removed by insuring that the reflected light coming from the sample is polarized 90E relative to the incident light and then allowing only light reflected from the sample to pass through an appropriately oriented polarizer in front of the detector. The first optical element needed for this transition is a polarizer that converts the incoming beam to linearly polarized light. This polarized light then passes through a quarter wave retardation plate placed on the objective lens with the fast axis set at 45E relative to the axis of the polarizer. This converts the linearly polarized light into circularly polarized light. When the circularly polarized light is reflected from the sample it changes handedness, that is right handed circularly polarized light becomes left handed circularly polarized light. As it passes back through the lambda quarter plate again, the circularly polarized light is converted back to linearly polarized light now polarized at 90E relative to the incident beam. Finally, another polarizer, the analyzer, is set in front of the detector at an orientation 90E relative to the first polarizer. Thus, only the rotated beam reflected from the sample reaches the detector (Dorogi and Keller, 1993; Ploem, 1975).
Other devices can be added to further improve the image. The contrast of the image can be enhanced by adding a central stop and field diaphragm before the first polarizer. In addition, an aperture that allows variation of the illuminating NA can also be useful for some studies (Izzard and Lochner, 1976). To obtain quantifiable gray scale images, a line isolating filter is needed to produce monochromatic light. Although this sounds complicated, most microscope manufacturers can supply and install all the optical elements needed for IRM imaging on an epi-illumination microscope.
It is often necessary to add a layer of material to the coverslip for adhesion or activation of the cell being imaged. This does not usually present a problem in obtaining good IRM images. IRM images have been taken with coverslips coated with antibodies, integrin ligands or other thin layers of protein. IRM can even be performed on cells migrating on polymer films (Csaderova et al., 2002).
If long term imaging is desired, precautions must be taken to ensure the viability of the samples as is necessary for all live imaging techniques. This usually means using an incubation system on the microscope stage to control heat, humidity and CO2 to maintain the pH of the culture medium. A complete discussion of stage incubators is beyond the scope of this protocol but a page is listed under Internet resources containing links to many manufacturers of these devices.
IRM is quite sensitive to the plane of focus, so refocusing will usually be needed during longer experiments. This is particularly important if IRM imaging is being combined with acquisition of z-stacks as the z motor is unlikely to return to the same precise plane after each stack. Most confocal systems have software that either allows scripting of a timeseries to include an autofocus step or have subroutines that allow the user to assemble modules of microscope commands so that an autofocus routine can be run at discrete intervals during a timeseries. However, some autofocus routines are very slow and add considerable time between images. It is often possible to manually refocus during image acquisition although this can be quite tedious. This method is the fastest and may be required if the cells are moving quickly. Another approach is to collect a short z stack around the plane of focus and select the best plane of focus after the timeseries ends.
BASIC PROTOCOL 1
Interference Reflection Imaging with a Laser Scanning Confocal Microscope (Example: paraformaldehyde fixed NIH 3T3 cells)
The basic protocol consists simply of placing a sample with cells either resting on or attached to a glass coverslip on to a microscope equipped with a suitable light path and then focusing on the coverslip through an oil immersion objective. Either live or fixed samples can be used. In contrast to fluorescent imaging of fixed samples, the refractive index of mounting medium should different from that of the immersion oil and coverslip in order to generate reflected beams.
Materials
Laser Scanning Confocal Microscope equipped with oil immersion objective
Fixed or live cells on a glass coverslip in media with refraction index different from immersion oil
Culture flasks for maintaining cell cultures before imaging
DMEM cell culture medium or other suitable cell culture medium
Lab-Tek II Chambered Cover Glasses, two-well (Nalge Nunc International #155379) or other #1 or #1.5 coverslips
Phosphate buffered saline (PBS)
2.5% Paraformaldehyde
Obtaining images
Prepare samples, for example fixed NIH 3T3 cells. Cells are plated in DMEM culture medium directly into the Lab-Tek II Chambered Coverslip; for fibroblasts the 2 well size is usually best. After growing overnight, the cells are rinsed twice in PBS and fixed in 2.5% Paraformaldehyde for 15 minutes. The fixed cells are rinsed three times in PBS and then imaged while in PBS. For other kinds of cells, different culture media could be used, other coverslips could be used for cell adhesion and the fixation conditions could be varied to suit the experiment.
Set up a configuration. The most commonly used configuration for a laser scanning microscope uses either red (543 or 568nm) or far red (633 or 647 nm) laser line, although any laser line can be used to generate a reflection image. The main beamsplitter is usually a neutral dichroic (80/20 or 70/30). The secondary beamsplitters are chosen to direct the reflected light to an emission filter that allows the incident laser light to pass to the detector (Fig 2A). The configuration used for focusing on a slide prior to running an automated pinhole adjustment routine is usually a suitable IRM configuration. DIC images can also be obtained using a transmitted light detector, but the focal plane for IRM and DIC images is usually different. The same software that is used for obtaining z-stacks during fluorescence imaging can be used to obtain an IRM image near the coverslip followed by a DIC image at a higher focal plane.
Focus on samples. Use DIC or other transmitted light mode to find and focus on cells.
Turn on laser, adjust focus while in scanning mode to find bright reflection image. The image will only appear over a very narrow range of focal planes.
Determine if open or narrow pinhole is optimal for the desired IRM images. Adjust detector gains for high contrast image.
Readjust focus to obtain a zero order interference image and then readjust the detectors for best contrast.
Figure 2.
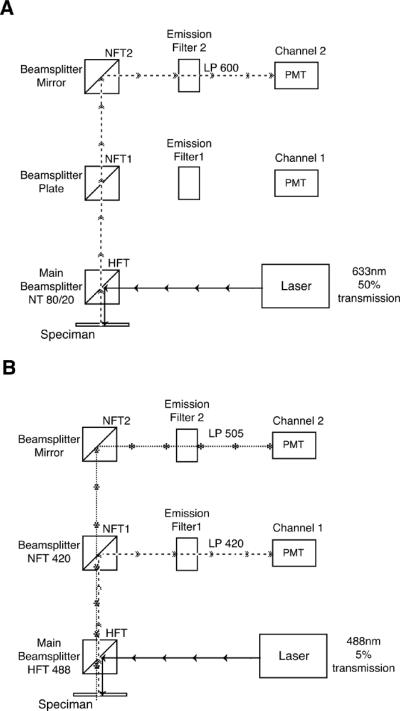
Suitable configurations for obtaining IRM images with a Laser Scanning Confocal Microscope. (A) Detection of an IRM image alone. Any laser line can be used but usually a red or far-red line is used. This example shows a configuration using a 633 nm laser. The main beamsplitter is a neutral 80/20 or 70/30 dichroic depending on which is available in the microscope. This will direct the incoming laser to the sample but will still allow the reflected light to reach the detector. The reflected light could be sent to either of the two detectors in this diagram, as long as the emission filter will allow the light to pass. Here, the LP600nm filter will pass the 633 nm reflected light, but almost any LP filter would be suitable. Therefore, any detector in the system can usually be used fro capture an IRM image. (B) Simultaneous detection of fluorescent and IRM images. In this case, the configuration settings will be based primarily on those needed to detect the emitted fluorescence and the IRM image will be captured with whatever detector is free and has a suitable emission filter. This example show simultaneous imaging of green fluorescence (505–530nm) and reflected light. The laser line, 488 nm, and the main beamsplitter, NFT 488, are chosen to fit the characteristics of the fluorophore. The IRM image will be formed with the reflected light that passes through the main dichroic because it is not a perfect optical device. If the main dichroic is so efficient that no incident light is allowed through, it will be necessary to use a neutral dichroic for the IRM image. The emission side beamsplitters are chosen to send the emitted fluorescence to one detector and the incident wavelength to another. In this diagram, all light longer than 505 nm is gathered for the fluorescence image and all shorter wavelengths including 488 nm are used for the IRM image. If the fluorescence is very weak, this beamsplitter can even be set at 470 nm, to collect as much light as possible for the fluorescent image. The remaining reflected light will be sufficient to produce an IRM image. While the emission filter for the fluorescence image should match the emitted fluorescence, almost any long pass filter will allow the reflected light to reach the detector.
BASIC PROTOCOL 2
Time-lapse IRM imaging of live cells (Example: migrating Dicytostelium discoideum amoeba)
Most confocal systems contain software that allows repeated image acquisition. Activating the appropriate imaging subroutine while using an IRM configuration allows the acquisition of IRM images over time. This allows imaging of many kinds of motile cells ranging from migrating Dicytostelium discoideum amoeba to activated T cells spreading on a stimulatory surface. If mammalian cells are being used, a microscope stage incubator may be needed. The exact kind of stage incubator will depend on the kind of microscope being used, the kind of cells being imaged and the length of the experiment. A web site is given at the end of this unit with links to numerous manufacturers of these devices. In addition, the microscope manufacturers themselves also produce stage incubators.
Materials (in addition to those from Basic Protocol 1)
PB buffer for Dicytostelium discoideum or culture medium without phenol red for other cells
Dicytostelium discoideum amoeba developed according to standard protocols (Parent, 2001) or other live cells.
Lab-Tek II one well chambers (Nalge Nunc International #155360)
Obtaining images
Plate living cells into Lab-Tek II Chambered Coverslips. For Dicytostelium discoideum either the one or two chamber size is usually best. Amoebas are allowed to adhere for 5 minutes and are then covered with PB buffer. Other cells should be plated and covered with an appropriate culture medium.
Set up an incubation system if needed and allow the system to come to equilibrium. For Dicytostelium discoideum, no environmental controls are needed. Put the chambers with cells onto the microscope stage.
Proceed according to Basic Protocol 1 to obtain an IRM image of a live cell. If desired add a transmitted light detector to the configuration and set a z-stack that will capture an IRM image in focus near the bottom of the z-stack and a transmitted light image at the top of the z-stack.
Run a test series with time-lapse acquisition software to determine if refocusing will be needed. If so, add an autofocusing subroutine. The exact nature of the autofocusing will depend on the microscope being used and the desired interval between images.
Run full time-lapse image acquisition. Select the best images from the z-stack if capturing multiple focal planes.
BASIC PROTOCOL 3
Multi-channel fluorescence and IRM imaging. (Example: Stably transfected Jurkat T cells expressing a YFP fusion protein imaged while spreading on stimulatory coverslips)
This protocol describes collecting both IRM and fluorescence images simultaneously using two photomultiplier detectors. If live cells are to be imaged over time, the same considerations for refocusing and incubation from Basic Protocol 2 will apply.
Materials (in addition to those from Basic Protocols 1 and 2)
Laser Scanning Confocal Microscope equipped with at least 2 photomultipliers. Live samples cells expressing a fluorescent marker. For example, transfected Jurkat T cells, clone E6.1 (ATCC # TIB-152) expressing a ZAP70 tagged with YFP Lab-Tek II four well chambered cover glasses (Nalge Nunc International #155382) coated with murine IgG1 to CDε clone Hit3a (BD Pharmingen) are used to activate the Jurkat T cells (See support protocol 1).
Hot air blower (Nevtek) and objective heater (Bioptechs) are used for temperature control on the microscope stage for the Jurkat T cells.
Imaging Buffer, usually a culture medium without phenol red containing HEPES to maintain the pH during imaging.
Obtaining images
Prepare cells. For Jurkat T cells, spin down the suspended cells in from an actively growing culture and resuspend them in Imaging Buffer at a density of 2×10⁶ cells/ml. Fixed cells could also be used.
Set up the stage incubation. For Jurkat T cells, turn on the objective heater and hot air blower, then place an antibody coated coverslip on the microscope stage. Remove the PBS that has been stored in the chamber and fill the chamber about half full with warm Imaging Buffer. Then allow the system to come to thermal equilibrium.
Set up configuration. This configuration will collect two channels simultaneously. The laser used is determined by the excitation of the fluorescent probe being monitored. In most cases, the main beamsplitter can be the optimal dichroic for fluorescence imaging because enough reflected light will pass through to generate an image. Since the IRM image will be collected at a shorter wavelength than the emitted fluorescence, the secondary beamsplitters must be chosen to send the reflected light through an emission filter that allows the incident light to reach the detector. As much emitted light as possible is sent to a detector through an emission filter suitable for the emitted fluorescence. Figure 2B shows a configuration suitable for collection of FITC, GFP or YFP while simultaneously collecting IRM images.
Add the samples to the equilibrated chamber on the microscope stage. Alternatively cells could be added to a chamber before placing it on the stage. For some adhesion assays, it may be necessary to add the cells several hours before imaging begins. For Jurkat T cell 3–5 μl of resuspended to cells are added to the chamber on the microscope stage.
Proceed according to Basic Protocol 1. In this case, fluorescence can also be used for the initial focusing step. For Jurkat T cells, focusing is done quickly so that cells can be visualized soon after first contact with the coverslip.
Time-lapse and live cell considerations as Basic Protocol 2
SUPPORT PROTOCOL 1
Preparing coverslips
Coverslips may be coated with a large number of different substances to promote adhesion or activation of the cells being images. This protocol gives basic instructions for cleaning and coating coverslips.
Materials
Drying oven
Coverslip cleaning solution
Polylysine coating solution
Coating material: For example, fibronectin or other adhesion molecules or antibodies for activating T cells
Coating coverslips
Clean the coverslips with cleaning solution by filling the chambered coverslip halfway and incubating at room temperature for 15 min. The cleaning solution is then completely removed by aspiration and the chambers are dried in a drying oven set at 45°C for at least 30 min.
In many cases, the desired coating will not adhere directly to a glass surface, so a preliminary coating of poly-L-lysine is applied first. A commercially available poly-L-lysine solution is diluted to 0.01% in distilled H2O, the clean chambers are filled halfway with the 0.01% poly-L-lysine and incubated at room temperature for 15 min. The solution is completely removed by aspiration and the chambers are dried at 45°C for at least 30 min. These chambers can be stored for several weeks.
The appropriate coating solution is added either to cleaned or cleaned and poly-L-lysine coated chambered coverslips. For fibronectin coating, 10–25 μg/ml fibronectin diluted in PBS is added to a cleaned coverslip so that the coverslipis barely covered (400 μl in one well of a four well chambered coverslip). The coverslips is incubated for 1–2 hr at 37°C, the solution is removed by aspiration and cells are plated on the coated coverslip. For antibody coatings, 10 μg/ml antibody diluted in PBS is added to poly-L-lysine coated coverslips so that the coverslip is barely covered (400 μl in one well of a four well chambered coverslip). The coverslip is incubated at 4°C overnight, followed by 3 rinses of PBS and is stored filled with PBS.
REAGENTS AND SOLUTIONS
DMEM culture medium (DMEM/10% FCS/Glutamine/Penicillin/Streptomycin)
50 ml Fetal Calf Serum (FCS) (Biofluids #200P-500)
5 ml Glutamine, 100× (Biofluids #P300-10)
5ml Penicillin/Streptomycin, 100× (Biofluids #P303-100)
DMEM medium (Gibco BRL #11995) to 500 ml, sterile filter
Store < 1 month at 4°C
Phosphate buffered saline (PBS)
1× Phosphate buffered saline without calcium or magnesium (BioFluids #P313-500)
Store < 6 months at room temperature
2.5% Paraformaldehyde
2.5 g Paraformaldelyde (Ted Pella #18501)
100 ml PBS
Prewarm PBS to 65°C and dissolve paraformaldehyde while heating to 80°
Store < 6 months at −20°C
PB buffer (5 mM potassium phosphate pH 6.2)
0.68 g KH2PO4 (JT Baker, #3246-01)
1.34 g Na2HPO .47H2O (Mallinckrodt Chemicals, #7914-04)
Distilled H2O to 1 L
Store < 6 months at room temperature
Imaging Buffer (RPMI without phenol red/10% FCS/25 mM HEPES pH 7.0)
5 ml Fetal Calf Serum (FCS) (Biofluids #200P-500)
1M HEPES pH 7.0 (BioFluids #P305-100)
RPMI medium, no phenol red (Gibco BRL#11835) to 50 ml, sterile filter
Store < 1 month at 4EC
Cleaning solution (70% ethanol/1M HCl)
70 ml Ethanol 100% (Sigma-Aldrich, #E7023)
20 ml distilled water
10 ml HCl 10M (Sigma-Aldrich, #H7020)
Store < 1 year at room temperature
Polylysine coating solution (0.01% Poly-L-lysine)
10 ml Poly-L-lysine 0.1% solution (Sigma-Aldrich, #P8920)
90 ml distilled water
Store < 6 months at room temperature
Antibody coating solution (10 μg/ml in PBS)
20 μl anti-human CD3ε antibody clone Hit 3a 200 μg/ml (BD Pharmingen, #P555336)
380 μl PBS
Use immediately, store coated chamber < 1 week at 4° C
Fibronectin coating solution (10–25 μg/ml in PBS)
25 μl Fibronectin 1 mg/ml solution (Sigma-Aldrich, #F1141)
975 μl PBS
Use immediately
COMMENTARY
Most of the analytical work in this field comes from epi-illumination microscopes, not from IRM performed with a confocal microscope, however the physical interactions are the same. In 1964, Curtis first applied the optical methods previously used to examine reflections from thin films to cells grown on glass coverslips (Curtis, 1964). Curtis analyzed his images in terms of reflections from the glass/medium and the medium/cell interface (Fig 3A). The first reflection, r1, is generated as light travels from the glass coverslip (η1=1.515) to the culture medium (η2~1.34) and another reflection, r2, is generated as the light crosses from the medium into the cell (η3~1.37). If the thickness of the layer of medium is about equal to the wavelength of the incoming light, the two reflected beams will interfere.
Figure 3.

Diagrams representing the reflections generated by a cell on a coverslip. (A) Cell separated from the coverslip by a thin layer of thickness d. The first reflection, r1, is generated at the glass/medium interface with incident angle θ1, followed by refraction angle θ2. The refracted beam continues through the medium and generates another reflection, r2, at the medium/cell interface. R2 will undergo a phase reversal because it occurs at a transition from lower to higher refractive index. The light that continues through the cell can be used to form a transmitted light image if an appropriate detector is available. (B) An additional reflection from the top of the cell may also contribute to the IRM image. When higher order interference fringes contribute to the image, the top of the cell will also contribute a third reflection, r3.
The strength of a reflected beam at a single interface is proportional to the difference in refractive indices. In this system, these differences are relatively small (Izzard and Lochner, 1976), so only the primary reflections contribute to the IRM image. The greatest difference in refractive indices occurs at the glass/medium interface (1.515–1.34). Thus, in the absence of interference, the brightest reflection will come from the cell free areas of the coverslip. Any areas in the IRM image that are brighter than the cell free background must be due to positive interference, while darker areas are due to negative interference.
While light is a complex quantum phenomenon that can be viewed in several different ways, to understand the generation of the interference image is it easiest to think of the reflected light as two waves, r1 and r2. The superposition of the two reflected light waves at the detector generates the interference image. These reflected waves have gone different distances through different materials, thus traversing two different optical paths. The length of an optical path, defined as the product of physical path length and refractive index of the material through which the light wave travels, determines the phase of a light wave traveling that path. Thus, the two reflected waves may reach the detector with different phases. Constructive interference occurs if the waves arrive at the detector in phase, that is aligned so the amplitudes of the peaks add together and the superimposed wave is larger than the two incoming waves. Alternatively, destructive interference occurs if the waves are aligned peak to trough, so the superimposed wave is smaller than either incoming wave. The difference between the two optical paths, OPD, will determine the alignment or phase shift between the two waves. If OPD is an integer multiple of the wavelength of the light, mλ, the waves align exactly peak to peak, generating maxima in the inference image. The integer m is called as the order of interference. If the OPD is (m+ ½)λ, the waves align exactly peak to trough, generating minima in the image. Thus it is possible to interpret the intensities of the IRM image produced by a cell on a coverslip by calculating the OPD between the reflected waves. Reflected wave r2 has traveled farther than wave r1 by going through the thin film of medium with a thickness of d twice. Considering only light that arrives at normal incidence (when θ; the refraction angle =0); this gives a physical path difference of 2d and an OPD of 2dη2. In addition, light behaves differently depending on whether the reflection occurs at a transition from a material of higher refractive index to one of lower or visa versa. At transitions from lower to higher refractive index, like the medium/cell interface, the sign of the electric field is inverted, which is accounted for in the OPD calculation as an additional length of λ/2. So the OPD between r1 and r2 is 2dη2 +λ/2 and the first maximum occurs in the image when d = λ/4η2. If the light approaches the surface obliquely with a refraction angle θ, the OPD is 2dη2cosθ +λ/2, shifting the first maximum to d = λ/4η2cosθ. As the cell gets closer to the coverslip and d gets smaller, the superimposed waves become more out of phase and the reflected intensity diminishes. As d approaches 0, the ODP approaches λ/2, where there is maximum destructive interference. So in a zero-order image, that is considering only OPD smaller than λ, the darkest areas correspond to places where the cell touches the coverslip and the brightest areas correspond to places where the distance between the cell and coverslip is about one quarter of the wavelength of the incident light (Beck and Bereiter-Hahn, 1981; Verschueren, 1985).
However it is clear that a full quantitative analysis of the interference pattern that would allow calculation of d or η from reflection images is much more complicated. In 1976, Izzard and Lochner determined that reflections from further away also contribute to the interference image, producing images with interference fringes inside the cell (Izzard and Lochner, 1976). In this case, the cell acts as a second thin film (Fig 3B) and reflections from the top membrane are seen in the IRM images. These higher order patterns can be eliminated by increasing the illuminating NA of the system, which allows light entering at more oblique angles to contribute to the image. When the illuminating NA is greater than 1, only reflections from areas where the layer of medium is less than 100 nm thick appear in the IRM image. This effect was attributed to a decrease in contrast in the interference fringes produced at greater distances from the coverslip because in the higher order fringes light reflecting at more oblique angles produce maxima in the interference pattern that overlap with minima from light entering at sharper angles. Gringell and Todd challenged this conclusion by showing that the loss of contrast could occur because increasing the illuminating NA strongly damped the maxima and minima of the higher ordered fringes (Gingell and Todd, 1979). However, they agreed that at higher illuminating NA, it is not necessary to consider the reflections from the top of the cell if thickness of the cytoplasm is greater than 1 μm and the distance between the cell and coverslip is less than 250 nm. Their calculations also showed that IRM images from areas of very thin cytoplasm, such as spreading edges, would be affected by reflections from the top of the cell even at high illuminating NA (Gingell, 1981).
Later, Thorell and his colleagues suggested that the darkest areas of IRM images were due to weak reflections from areas of direct contact between the cell and coverslip (Bereiter-Hahn et al., 1979). They demonstrated the intensities of the darkest areas were not affected by changes in the incident wavelength or the refractive index of the medium and concluded that these areas are not interference minima. However, IRM probably cannot distinguish between small gaps less than 5 nm and areas direct contact since both will be relatively insensitive to changes in wavelength and refractive index (Gingell and Vince, 1982).
Overall, there is general agreement that if the distance between the cell and coverslip is between 0 and 100 nm, the intensity in the reflected light pattern increases with distance (Abercrombie and Dunn, 1975; Verschueren, 1985: Opas, 1990). In the IRM image, whites occur where the thickness of the layer of medium is around 100 nm, grays are generated at intermediate distances, while blacks occur at distances below 15 nm and are an indication of strong adhesion (Fig 4). If the IRM image contains areas where the thickness of the cell is less than 1μm, reflections from the top of the cell will contribute significantly to the image and even semi-quantitative interpretation will be difficult unless the thickness of the cytoplasm is known.
Figure 4.

Gray level intensities observed in a zero-order IRM image. A cell adhering to the coverslip will generate black areas on an IRM image in areas of close contact where the gap between the cell and coverslip is less than 15 nm (black arrow). If the gap is between 15 and 100 nm, the IRM image will show shades of gray (double headed arrow). The brightest areas on the IRM image will come from areas where the cell is about 100 nm from the coverslip (gray double headed arrow). If the cytoplasm is less than 1 m thick (feathered arrow), reflections from the top of the cell will affect the intensity of the IRM image, so it will not be possible to approximate the distance between the cell and the coverslip unless the thickness of the layer of cytoplasm is known.
It should be clear from this discussion, that reflection interference contrast is quite different from differential interference contrast (DIC) despite the similarities in the two names. DIC employs polarized light and special Wollaston prisms to convert differences in refractive indices into gray level differences, producing pseudo 3D images contrast methods (Keller, 1997). Moreover, IRM is also different from Total Internal Reflection Fluorescence or TIRF microscopy. The latter uses a laser turned to a very oblique angle to generate an evanescent wave that is used to excite fluorophores near the coverslip (Toomre and Manstein, 2001).
CRITICAL PARAMETERS and TROUBLESHOOTING
The most critical parameter is to use a microscope with a suitable light path. It should be possible to see a very bright reflection from the coverslip when the focus is moved slightly below the focal plane of cells adhering to the coverslip. The exact z position is also critical; it is very easy for the focus to shift to a position where no image is visible. The refractive index of mounting medium is important as a larger difference in refractive index generates brighter reflections. It is best to avoid alcohol and acetone based fixatives as these will induce shrinkage in the samples that can affect contacts with the coverslip.
ANTICIPATED RESULTS
This technique should produce a gray scale image of approximately the same shape as the cell being viewed. Figure 5A shows a DIC image of a NIH 3T3 fibroblast in the left panel and an IRM image of the same cell taken with a Zeiss 510 LSCM with the pinhole completely open in the middle panel. The right panel shows another IRM image taken with a 1.0 um optical slice to reduce the field of focus. Because these are very flat cells, the DIC image has very low contrast, particularly when compared to the dramatic IRM image. As explained in the Commentary, in this zero order IRM image, the darkest areas come from the regions of closest contact, where the cell is either adhered to the coverslip or is no more than 15 nm from the coverslip. The intensity of the reflected light increases with distance from the coverslip and the brightest areas in the image come from regions that are about 100 nm from the coverslip. The information in the DIC image is quite different, showing finer details at the edge of the cell as well as showing structures inside the cell itself. The two IRM images look very similar but reducing the pinhole often produces sharper images. However, using a reduced pinhole can introduce other problems, as shown in the next set of images (Fig 5B). The first panel shows an IRM image with a 1.0 um optical slice as before, while the middle panel shows an image taken at a slightly higher focal plane. In the second image, higher order interference fringes are beginning to show up and complicate the zero order image. The right panel shows an IRM image from a still higher focal plane that is completely dominated by the higher order fringe pattern. The lower panels show equivalent images taken with the pinhole open. In these images, the higher order fringe pattern is less visible and the image is out of focus before the higher order fringes contribute significantly to the image. Information about the OPD at the different areas can be obtained from the fringe pattern; however, for most applications the zero order image is more useful. The last set of images demonstrate the effects of changing the laser wavelength (Fig 5C). The zero order images shown in the left panels are similar in images whether 633 nm light or 543 nm light is used. In particular, the dark areas of close contact are virtually unchanged, although the gray levels in areas of intermediate distance show some variation. In contrast, the right panels contain images showing the higher order interference fringes, where the pattern itself is a function of wavelength. In these images, fringe patterns change substantially as the wavelength changes.
Figure 5.
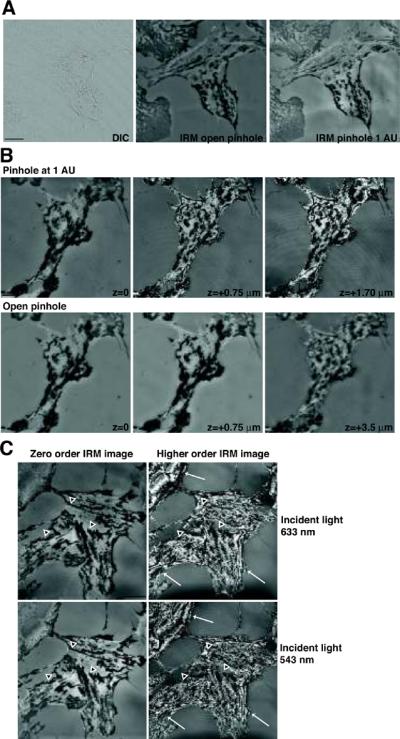
IRM images of fixed NIH 3T3 cells. Images were obtained with a Zeiss LSCM 510 using a 63X oil objective NA 1.4. The configuration shown in Figure 2A was used for A and B. A similar configuration using a 543nm laser line was used for the last part of C. (A) Comparison of DIC and IRM images of the same cell. Left panel: low contrast DIC image showing intracellular organelles, details of the cell shape but containing little information about the adherent surface. Bar=10 μm. Middle panel: High contrast IRM image taken with an open pinhole. Right panel: IRM image taken with the pinhole set a 1 Airy Unit (1 AU). This is similar to the other IRM image, but the smaller pinhole gives a sharper image. (B) Effects of focal plane in images taken with narrow or open pinhole. Top panels: Images of the same field taken at successively higher focal planes with the pinhole set to 1 AU. The higher order interference fringes are evident with little change in focus. Bottom panels: A similar series of images taken at successively higher focal planes with the pinhole completely open. These images are primarily formed from the zero order interference fringe. Bar=5 μm. (C) The zero order interference image is similar when taken with light of different wavelengths. Top panels: The zero order (left side) and higher order (right side) images taken with a 633 nm laser. Bottom panels: The zero order (left side) and higher order (right side) images taken with a 543 nm laser. Bar=20 μm. The dark areas of close contact indicated with black arrowheads outlined in white remain fairly constant through this set of images. While there is some variation in the remaining gray level intensities in the two zero-order images, the overall appearance of the images is very similar. In contrast, the higher order interference are shifted substantially by changes in incident wavelength.
Figure 6 shows a time series of IRM images from migrating Dicytostelium discoideum and DIC images captured in the same z-stack. The DIC images appear to show an amoeba gliding continuously over the coverslip, while the IRM image clearly shows a new contact site forming at a discrete distance from the current adhesion site. The IRM image also shows streaks of material left behind as the amoeba moves along. Thus, the IRM image contains information about cell adhesion during migration that cannot be obtained from the DIC image.
Figure 6.

Application of IRM to migrating Dicytostelium discoideum cells. Dicytostelium discoideum amoeba were developed according to standard protocols to produce mobile cells. The images were taken using the same settings as Figure 5 with the addition of a transmitted light detector to the track. DIC optics installed on the microscope were used for the transmitted light image. Instead of single images, z stacks were collected at each time point and different focal planes were chosen to show the DIC or IRM images. Top panels: Time series of DIC image from the top of the z stack. The cells appear to glide over the coverslip. Bottom panels: IRM images from the bottom of the z stack in the same time series. Bar=10 μm These images clearly show that the amoeba move by extending a pseudopod that is not in contact with the coverslip and then forming a new contact site some distance from the cell body.
Figure 7 shows a time series of a spreading T cell along with simultaneous fluorescent imaging of an YFP-tagged protein. The YFP-tagged protein is a proximal kinase, ZAP-70, that is required for signal transduction downstream of the T cell receptor. These images show the immediate recruitment of the kinase to areas where the cell touches a stimulatory coverslip that is coated with anti-T cell receptor antibodies.
Figure 7.

Simultaneous capture of fluorescence and interference reflection images of transfected Jurkat T cells expressing ZAP70-YFP. The configuration shown in Figure 2B was used to obtain these images. Top panels: Time series of YFP fluorescent images. The ZAP70-YFP clusters as the T cell spreads on the stimulatory coverslip. Bottom images: IRM images captured in the same track clearly show the T cell spreading across the coverslip. Bar=5 μm. A comparison of the two images shows that ZAP70 clusters at the contact sites.
The high contrast IRM images are useful for quantifying the extent and area of cell-surface contact. For example to find the areas of activated T cells, an IRM image of a field of spread T cells was taken (Fig 8; left panel). This image is easy to threshold using automated routines (middle panel). In this case, the built-in thresholding algorithm from the software package iVision (BioVision) was used to outline the individual cells and identify each outlined cell with a number. The left panel shows an image where the gray level of each cell is proportional to the area outlined in the IRM image.
Figure 8.

Quantification of an IRM image. Left panel: IRM image of fixed mouse T cells obtained using the same conditions as the cells in Figure 5. The T cells were allowed to spread on a stimulatory coverslip and were then fixed in 2.5% paraformaldehyde. Middle panel: An auto-thresholding algorithm was used to outline the T cells based on the gray level contrast and object shape. Some touching cells were improperly outlined together and were then separated by hand, for examples # 23 and #26. Right panels: The same field of cells visualized with an LUT where the gray level of each cell is proportional to its area. Lighter colors indicate cells with larger areas.
TIME CONSIDERATIONS
The time frame for completing the protocol will vary tremendously depending on the kind of experiments to be performed and the samples being imaged. At one end of the spectrum, T cells could be resuspended in sample buffer, followed by live imaging of less than 3 minutes so the entire protocol could be completed in less than 15 minutes. Alternatively, if the experiments require precoating coverslips, culturing cells for days before beginning imaging and conclude with days of imaging, the entire protocol may encompass an entire week.
LITERATURE CITED
- Abercrombie M, Dunn GA. Adhesions of fibroblasts to substratum during contact inhibition observed by interference reflection microscopy. Exp Cell Res. 1975;92:57–62. doi: 10.1016/0014-4827(75)90636-9. [DOI] [PubMed] [Google Scholar]
- Beck K, Bereiter-Hahn J. Evaluation of reflection interference contrast microscope images of living cells. Microsc Acta. 1981;84:153–78. [PubMed] [Google Scholar]
- Bereiter-Hahn J, Fox CH, Thorell B. Quantitative reflection contrast microscopy of living cells. J Cell Biol. 1979;82:767–79. doi: 10.1083/jcb.82.3.767. [DOI] [PMC free article] [PubMed] [Google Scholar]
- Csaderova L, Riehle M, Curtis A. Detection of cell forces by measuring defromation of polymer films using interference reflection microscopy. European Cells and Materials. 2002;4(Suppl. 2):64–65. [Google Scholar]
- Curtis AS. The Mechanism of Adhesion of Cells to Glass. A Study by Interference Reflection Microscopy. J Cell Biol. 1964;20:199–215. doi: 10.1083/jcb.20.2.199. [DOI] [PMC free article] [PubMed] [Google Scholar]
- Dorogi PL, Keller HE. Antiflex microscopy of cell adhesion. THe Journal of NIH Research. 1993;5:79. [Google Scholar]
- Gingell D. The interpretation of interference-reflection images of spread cells: significant contributions from thin peripheral cytoplasm. J Cell Sci. 1981;49:237–47. doi: 10.1242/jcs.49.1.237. [DOI] [PubMed] [Google Scholar]
- Gingell D, Todd I. Interference reflection microscopy. A quantitative theory for image interpretation and its application to cell-substratum separation measurement. Biophys J. 1979;26:507–26. doi: 10.1016/S0006-3495(79)85268-6. [DOI] [PMC free article] [PubMed] [Google Scholar]
- Gingell D, Vince S. Cell-glass separation depends on salt concentration and valency: Measurements on Dictyostelium amoeba by finite apertrue interferometry. J Cell Sci. 1982;54:299–310. [Google Scholar]
- Izzard CS, Lochner LR. Cell-to-substrate contacts in living fibroblasts: an interference reflexion study with an evaluation of the technique. J Cell Sci. 1976;21:129–59. doi: 10.1242/jcs.21.1.129. [DOI] [PubMed] [Google Scholar]
- Keller HE. Contrast Enhancement in Light Microscopy. Current Protocols in Cytometry. 1997;Chapter 2:Unit 2.1. doi: 10.1002/0471142956.cy0201s00. [DOI] [PubMed] [Google Scholar]
- Opas M. Biomedical applications of interference reflection microscopy. Proceedings SPIE. 1990;1121:351–356. [Google Scholar]
- Parent CA. Dictyostelium cell dynamics. Curr Protoc Cell Biol. 2001;Chapter 12:Unit 12 5. doi: 10.1002/0471143030.cb1205s09. [DOI] [PubMed] [Google Scholar]
- Ploem JS. Reflection-contrast microscopy as a tool fro investigation of the attachment of living cells to a glass surface. In: von Furth R, editor. Mononuclear Phagocytes in Immunity, Infection and Pathology. Blackwell Scientific Publications; Melbourne, London: 1975. pp. 405–421. [Google Scholar]
- Prins FA, Velde I. Cornelese-ten, Heer E. Reflection Contrast Microscopy; The bridge between light and electron microscopy. In: Mossman D.J.T.a.B.T., editor. Cell Imaging Techniques: Methods and Protocols. Vol. 319. Humana Press; 2005. pp. 363–401. [DOI] [PubMed] [Google Scholar]
- Toomre D, Manstein DJ. Lighting up the cell surface with evanescent wave microscopy. Trends Cell Biol. 2001;11:298–303. doi: 10.1016/s0962-8924(01)02027-x. [DOI] [PubMed] [Google Scholar]
- Verschueren H. Interference reflection microscopy in cell biology: methodology and applications. J Cell Sci. 1985;75:279–301. doi: 10.1242/jcs.75.1.279. [DOI] [PubMed] [Google Scholar]
KEY REFERENCES
- Beck K, Bereiter-Hahn J. Evaluation of reflection interference contrast microscope images of living cells. Microsc Acta. 1981;84:153–7. [PubMed] [Google Scholar]; Very though analysis of IRM images and the quantitative aspects of thin film optics
- Cornelese-ten Velde I, Bonnet J, Tanke HJ, Ploem JS. Reflection contrast microscopy performed on epi-illumination microscope stands: comparison of reflection contrast- and epi-polarization microscopy. Journal of Microscopy. 1990;159:1–13. [Google Scholar]; Descriptions of epi-illumination microscopes configured for IRM imaging.
- Curtis AS. The Mechanism of Adhesion of Cells to Glass. A Study by Interference Reflection Microscopy. J Cell Biol. 1964;20:199–215. doi: 10.1083/jcb.20.2.199. [DOI] [PMC free article] [PubMed] [Google Scholar]; First application of IRM to biological samples and quantitative analysis of the images.
- Gingell D. The interpretation of interference-reflection images of spread cells: significant contributions from thin peripheral cytoplasm. J Cell Sci. 1981;49:237–47. doi: 10.1242/jcs.49.1.237. [DOI] [PubMed] [Google Scholar]; Analysis showing it is necessary to consider the thickness of the cell cytoplasm when analyzing an IRM image.
- Izzard CS, Lochner LR. Cell-to-substrate contacts in living fibroblasts: an interference reflexion study with an evaluation of the technique. J Cell Sci. 1976;21:129–59. doi: 10.1242/jcs.21.1.129. [DOI] [PubMed] [Google Scholar]; Description of the role of higher order interference fringes in IRM images.
- Ploem JS. Reflection-contrast microscopy as a tool for investigation of the attachment of living cells to a glass surface. In: von Furth R, editor. Mononuclear Phagocytes in Immunity, Infection and Pathology. Blackwell Scientific Publications; Melbourne, London: 1975. pp. 405–421. [Google Scholar]; Classic work on applying IRM imaging to biological samples using epi-illumination.
- Verschueren H. Interference reflection microscopy in cell biology: methodology and applications. J Cell Sci. 1985;75:279–301. doi: 10.1242/jcs.75.1.279. [DOI] [PubMed] [Google Scholar]; Very clear review of IRM imaging in biology that discusses many of the seminal papers.
INTERNET AND VENDOR RESOURCES
- http://www.microscopyu.com/articles/confocal/reflectedconfocalintro.html.; Brief description of confocal reflection imaging:
- http://www.olympusfluoview.com/resources/specimenchambers.html.; Vendors of incubation systems for microscopes:
- Leica Microsystems; Bannockburn IL: http://www.leica-microsystems.com/ [Google Scholar]; Carl Zeiss MicroImaging Inc.; Thornwood, NY: http://www.zeiss.com/ [Google Scholar]; Nikon Inc; Melville NY: http://www.nikon.com/index.htm. [Google Scholar]; Olympus America Inc; Center Valley, PA: http://www.olympusamerica.com. [Google Scholar]; Laser scanning confocal microscope manufacturers
- Carl Zeiss MicroImaging Inc.; Thornwood, NY: http://www.zeiss.com/ [Google Scholar]; Leica Microsystems; Bannockburn IL: http://www.leica-microsystems.com/ [Google Scholar]; Nikon Inc; Melville NY: http://www.nikon.com/index.htm. [Google Scholar]; Olympus America Inc; Center Valley, PA: http://www.olympusamerica.com. [Google Scholar]; Microscope manufacturers with IRM modules for epifluorescence microscopes
- BioVision Technologies, Inc; Exton PA: http://www.biovis.com/ [Google Scholar]; iVision software