

Abstract
Endosomal sorting mechanisms mediated by AP-3 and BLOC-1 are perturbed in Hermansky-Pudlak Syndrome, a human genetic condition characterized by albinism and prolonged bleeding (OMIM #203300). Additionally, mouse models defective in either one of these complexes possess defective synaptic vesicle biogenesis (Newell-Litwa et al., 2009). These synaptic vesicle phenotypes were presumed uniform throughout the brain. However, here we report that AP-3 and BLOC-1 differentially regulate the composition of presynaptic terminals in the striatum and dentate gyrus of the hippocampus. Quantitative immunoelectron microscopy demonstrated that the majority of AP-3 immunoreactivity in both wild-type striatum and hippocampus localizes to presynaptic axonal compartments, where it regulates synaptic vesicle size. In the striatum, loss of AP-3 (Ap3dmh/mh) resulted in decreased synaptic vesicle size. In contrast, loss of AP-3 in the dentate gyrus increased synaptic vesicle size, thus suggesting anatomically specific AP-3-regulatory mechanisms. Loss-of-function alleles of BLOC-1, Pldnpa/pa, and Mutedmu/mu revealed that this complex acts as a brain-region-specific regulator of AP-3. In fact, BLOC-1 deficiencies selectively reduced AP-3 and AP-3 cargo immunoreactivity in presynaptic compartments within the dentate gyrus both at the light and/or electron microscopy level. However, the striatum did not exhibit these BLOC-1-null phenotypes. Our results demonstrate that distinct brain regions differentially regulate AP-3-dependent synaptic vesicle biogenesis. We propose that anatomically restricted mechanisms within the brain diversify the biogenesis and composition of synaptic vesicles.
Introduction
Defective synaptic vesicle biogenesis triggers organelle depletion to changes in the composition and size of synaptic vesicles (Kosaka and Ikeda, 1983; González-Gaitán and Jäckle, 1997; Zhang et al., 1998; Nonet et al., 1999; Karunanithi et al., 2002; Shimizu et al., 2003; Koh et al., 2004; Heerssen et al., 2008; Kasprowicz et al., 2008; Sato et al., 2009). It is assumed that the biogenesis of synaptic vesicles is a homogenous process throughout the nervous system. However, recent genetic evidence challenged this conception (Karunanithi et al., 2002; Kantheti et al., 2003; Hayashi et al., 2008). Here, we focus on endosomal sorting mediated by the adaptor protein complex-3 (AP-3) and the biogenesis of lysosome-related organelle complex-1 (BLOC-1), which regulate the targeting of synaptic vesicle membrane proteins (Voglmaier et al., 2006; Danglot and Galli, 2007; Chen et al., 2008; Newell-Litwa et al., 2009). We report that contrary to the notion that synaptic vesicle biogenesis is anatomically and mechanistically homogenous, AP-3 distinctly regulates synaptic vesicle composition and morphology in diverse brain regions. Moreover, BLOC-1 is a factor whose effects on AP-3 mechanisms are brain-region specific.
Disruption of AP-3 or BLOC-1 results in Hermansky-Pudlak syndrome (OMIM #203300) (Li et al., 2004; Di Pietro and Dell'Angelica, 2005). This syndrome is characterized by albinism, bleeding, and pulmonary fibrosis. These manifestations result from defective sorting of membrane proteins from endosomes to lysosomes and lysosome-related organelles (Li et al., 2004; Di Pietro and Dell'Angelica, 2005; Raposo and Marks, 2007; Setty et al., 2007, 2008).
AP-3 is encoded by four subunits (δ, β3, μ3, and σ3). While there are two AP-3 isoforms, these share in common the δ and σ3 subunits (Newell-Litwa et al., 2007). On the other hand, BLOC-1 is an octamer made up of BLOS1-3, cappuccino, dysbindin, muted, pallidin, and snapin subunits. Mouse mutants in AP-3 δ (mocha, Ap3dmh/mh) lack both AP-3 isoforms and result in phenotypes that recapitulate the Hermansky-Pudlak syndrome. In addition, mocha displays neurological phenotypes related to synaptic vesicle biogenesis defects (Kantheti et al., 1998; Di Pietro and Dell'Angelica, 2005; Danglot and Galli, 2007; Newell-Litwa et al., 2007).
Here, we analyzed the contributions of AP-3 and BLOC-1 to the composition of synaptic terminals in diverse brain regions. We performed light and quantitative immunoelectron microscopy studies in mouse brains lacking either the AP-3 δ subunit (Ap3dmh/mh) or either one of the following BLOC-1 subunits: pallidin (Pldnpa/pa) and muted (Mutedmu/mu). We found that while AP-3 is expressed throughout the brain, it is abundant in the striatum and hippocampus where it primarily localized to presynaptic axonal compartments. AP-3 selectively regulated the molecular composition of nerve terminals in the dentate gyrus. Loss of AP-3 minimally affected presynaptic compartments in either the striatum or CA3 pyramidal cell region of the hippocampus. These differential effects of AP-3 deficiency correlated with divergent changes in the morphology of synaptic vesicles. Loss of AP-3 in the dentate gyrus increased synaptic vesicle size, while in the striatum, it resulted in decreased organelle size in asymmetric excitatory synaptic terminals. Interestingly, deficiencies in BLOC-1 revealed that this complex contributes to region-specific effects of AP-3. These results are consistent with the hypothesis that AP-3-BLOC-1 mechanisms distinctly regulate synaptic terminal composition and organelle size across diverse brain regions.
Materials and Methods
Animals and tissue preparation
Sprague Dawley rats used in the synaptosome preparation were obtained from Harlan Laboratories. Mocha (STOCK gr +/+ Ap3d1mh/J, here referred to as Ap3dmh/mh) and its control grizzled (STOCK gr +/+ Ap3d1+/J, here referred to as Ap3d+/+) and pallid (B6.Cg-Pldnpa/J, here referred to as Pldnpa/pa) breeding mouse pairs were obtained from Jackson Labs and bred in house following Institutional Animal Care and Use Committee approved protocols. Muted mice and their controls (B6C3 Aw−J/A-Mutedmu/J, Mutedmu/mu and CHMU+/mu) (Zhang et al., 2002) were obtained from Dr. Richard Swank (Roswell Park Cancer Institute, Buffalo, NY) and bred in-house, while BLOC-1-deficient reduced pigmentation (C57BL-Bloc1s3rp/J, here referred to as Bloc1s3rp/rp), and cappuccino (B6.C3-Cnocno/Llp, here referred as Cnocno/cno) mice were bred at Roswell Park Cancer Institute, Buffalo, NY. All mice used in this study were between 2 and 10 months of age, with the exception of one mutedmu/mu and its corresponding CHMU+/mu control, which were both 2 years old. Following deep anesthesia with either ketamine or Nembutal, mice were transcardially perfused with Ringer's solution followed by a fixative mixture of 4% paraformaldehyde and 0.1% glutaraldehyde in phosphate buffer (0.1 m, pH 7.4). The brains were also postfixed overnight in 4% paraformaldehyde at 4°C. The fixative was replaced by PBS (0.01 m, pH 7.4) on the following day. The brains were cut into 60 μm thick sections with a vibrating microtome. Sections were stored in an antifreeze solution at −20°C until immunohistochemical processing.
Antibodies and peptides
The following antibodies were used in this study: a monoclonal antibody against AP3-δ (SA4) from Developmental Studies Hybridoma Bank at the University of Iowa; a monoclonal antibody against Synaptophysin (SY38) from Millipore Bioscience Research Reagents; a monoclonal antibody against Transferrin Receptor (H68.4) from Zymed Laboratories/Invitrogen. The generation and specificity tests for the monoclonal antibody against VAMP7-TI have been described by Advani et al. (1999). Further characterization of the VAMP7-TI monoclonal antibody showed that it specifically recognizes GST construct with the VAMP7-TI epitope but not VAMP2. Moreover, immunoreactivity with this antibody is abolished by siRNA downregulation of VAMP7-TI (Newell-Litwa et al., 2009). The amino acid sequence for the AP-3δ peptide was reported in (Craige et al., 2008).
Immunoperoxidase labeling for light and electron microscopy
Vibrotome sections were first incubated in 1% sodium borohydride for 20 min at room temperature (RT), followed by extensive repeated washings with PBS. Sections were then placed in cryoprotectant (PB 0.05 m, pH 7.4, 25% sucrose, 10% glycerol) for 20 min, frozen at −80°C for 20 min, and returned to decreasing amounts of cryoprotectant. Following cryoprotection, sections were rinsed in PBS. Sections were preincubated for 1 h at room temperature (RT) in PBS + 1% normal horse serum (NHS) + 1% bovine serum albumin (BSA), followed by primary antibody incubation for 48 h at 4°C in PBS + 1% NHS + 1% BSA and one of the following primary antibody dilutions: 1:5000 anti-AP-3δ (SA4), 1:5000 anti-VAMP7-TI, or 1:10,000 anti-SY38. After PBS washes, the sections were incubated in a secondary antibody dilution of 1:200 biotinylated horse anti-mouse IgG (Vector Laboratories) for 90 min at RT. Sections were rinsed with PBS, and then incubated in a 1:100 dilution of the avidin-biotin peroxidase complex (ABC; Vector Laboratories). Sections were rinsed in PBS followed with a final wash in Tris buffer (50 mm, pH 7.6) before a 10 min RT incubation in 0.025% 3,3′-diaminobenzidine (DAB; Sigma Aldrich), 1 mm imidazole (Fischer Scientific), and 0.005% hydrogen peroxide in Tris buffer. For light microscopy analysis, sections were rinsed in PBS, mounted on gelatin-coated slides, dehydrated, and coverslipped with Permount. For electron microscopy analysis, sections were further processed as follows: After rinsing in PB (0.1 m, pH 7.4), sections were incubated in 1% OsO4 for 10 min, and then returned to PB before being dehydrated with increasing concentrations of ethanol. In the 70% ethanol solution, 1% uranyl acetate was added, and sections were incubated in the dark for 35 min to enhance the contrast of the tissue on the electron microscope. After dehydration, sections were treated with propylene oxide, and embedded in epoxy resin overnight (Durcupan ACM; Fluka). On the next day, sections were mounted onto slides and baked in a 60°C oven for 48 h. Blocks of these tissues from sections of the striatum, CA3, and dentate gyrus were mounted on resin blocks, and cut into 60 nm sections with an ultramicrotome (Leica Ultracut T2). Sections were collected on Pioloform-coated copper grids and stained with lead citrate for 5 min to enhance contrast on the electron microscope. AP-3-positive labeling was detected as a diffuse DAB electron-dense signal. In wild-type axons, we quantified whether this labeling either partially or wholly (“all”) filled the observed structure in the plane of the analyzed section. Thus, the same axon could exhibit both partial and all labeling depending upon the analyzed plane. Across brain regions (striatum, CA3 pyramidal cells, and dentate gyrus), ∼70% of all electron micrographs exhibited both partially labeled and wholly labeled axons, suggesting that partial labeling is not an artifact of antibody penetrance.
Immunofluorescence labeling for confocal microscopy
Sections containing the hippocampus were first rinsed with PBS, and then incubated in 1% sodium borohydride in PBS for 20 min at RT, followed by extensive washing with PBS. Samples were preincubated in a solution of PBS + 5% NHS + 1% BSA + 0.3% Triton X-100 for 60 min at RT. Samples were incubated overnight at 4°C in primary antibody solutions of PBS + 1% NHS + 1% BSA and either a mixture of anti-AP-3δ (SA4) and anti-VAMP7-TI (both at 1:5000), or anti-SY38 and anti-VAMP7-TI (at dilutions of 1:10,000 and 1:5000, respectively). After rinsing in PBS, sections were incubated for 60 min in a secondary antibody solution of PBS + 1% NHS + 1% BSA and 1:500 dilutions of the following Alexa-conjugated isotype-specific secondary antibodies: anti-IgG1 (for anti-AP-3δ and anti-Synaptophysin) and anti-IgG2B (for VAMP7-TI) (Invitrogen). Following PBS rinses, sections were incubated in a cupric sulfate solution (3.854 w/v ammonium acetate, 1.596 w/v cupric sulfate in distilled water, pH 5) for 30 min. Sections were washed with PBS and mounted on slides with Vectashield (Vector Laboratories).
Microscopy analysis
Confocal microscopy.
The confocal microscopic analysis of immunofluorescent samples was performed with an Anxiovert 100M (Carl Zeiss) coupled to an Argon laser. Images were acquired with LSM 510 sp1 software (Carl Zeiss) using Plan Apochromat 10×/0.5 dry and 40×/1.3, 63×/1.4, and 100×/1.4 oil DiC objectives. The emission filters used for fluorescence imaging were BP 505–530 and LP 560.
Deconvolution microscopy.
Immunofluorescence of mouse primary neurons has been previously described (Salazar et al., 2004a; Craige et al., 2008; Newell-Litwa et al., 2009). Images were acquired with a scientific-grade cooled charge-coupled device (Cool-Snap HQ with ORCA-ERchip) on a multiwavelength, wide-field, three-dimensional microscopy system (Intelligent Imaging Innovations), based on a 200M inverted microscope using a 63× numerical aperture 1.4 lens (Carl Zeiss). Immunofluorescent samples were imaged at room temperature using a Sedat filter set (Chroma Technology), in successive 0.20 μm focal planes. Out-of-focus light was removed with a constrained iterative deconvolution algorithm (Swedlow et al., 1997).
Electron microscopy.
Electron microscopy was performed with a Zeiss EM-10C electron microscope with a CCD camera (DualView 300W; Gatan). Images were acquired with Digital Micrograph Software (v. 3.10.1; Gatan) Brightness and contrast of digital images were adjusted with Adobe Photoshop CS3 (v. 10.0.1).
Light microscopy.
Light microscopy was performed with a Leica DMRB microscope (Lieca Microsystems) and images were captured with a CCD camera (Leica DC500). Images were acquired with Leica IM50 software. Images were converted to inverted grayscale images with Adobe Photoshop CS2 (v. 9.0.2), and image intensity measurements and heat map generation was performed with ImageJ software.
Blinded analysis of synaptic vesicle size
To avoid any bias in the analysis of synaptic vesicles size between control and mutant mice, the data collection and vesicle size measurements were preformed by an investigator blind to the source of tissue examined in the electron microscope. In brief, the procedure was as follows: Following electron microscopy processing and resin embedding of unstained sections of the striatum or dentate gyrus from three mocha and three wild-type (WT) grizzled mice, blocks of tissue were collected, cut in 60-nm-thick sections with an ultramicrotome, and mounted on single slot copper grids by person A. Person B then rearranged these grids into a different grid box and provided a code to mask the original identity of each grid. Person A acquired electron micrographs as previously described, at both 25,000× and 50,000×. To maintain a certain degree of homogeneity across populations of terminals examined, boutons forming asymmetric axo-spinous synapses were analyzed separately from those involved in asymmetric axo-dendritic synapses. All selected synapses displayed a well defined postsynaptic density. We excluded mossy fiber terminals from selection. Within high-magnification images (50,000×) of selected presynaptic terminals, the area of each identifiable synaptic vesicle that was within the plane of the electron micrograph was determined with ImageJ software by drawing a circle around the inner circumference of each vesicle. We followed Fox's (1988) guidelines to measure synaptic vesicle areas. All synaptic area measurements were performed by the same person to minimize observer variability. After data collection, person B revealed the original identity of each grid. Quantitative and statistical analysis of data was performed by Person C without knowledge of the genotype of the samples.
Cell culture and DSP crosslinking of AP-3 immunocomplexes
PC12 cells were cultured in DMEM containing 10% horse serum, 5% fetal bovine serum, and 100U/ml penicillin and 100 μg/ml streptomycin at 10%CO2 and 37°C. Preparation of mouse neocortical neurons has been described by Newell-Litwa et al. (2009). DSP crosslinking of AP-3 immunocomplexes and their isolation have been described by Craige et al. (2008).
Preparation of synaptosomes
Synaptosomes were prepared from adult female rats (Harland Laboratories) following the procedure of Nagy and Delgado-Escueta (1984), except that Percoll sedimentation was omitted. Briefly, rats were anesthetized by CO2 narcosis and brains quickly removed, and washed in ice-cold PBS. Tissue was homogenized in 0.32 m sucrose, 5 mm HEPES, and 0.5 mm EDTA supplemented with Complete antiprotease mixture (Roche Diagnostics) by 16 strokes of a Potter-Elvehjem homogenizer at 800 rpm. Homogenates were spun at 1000 × g in a Sorvall SS-34 rotor for 10 min and S1 supernatants were recovered. S1 fractions were further sedimented at 12,000 × g for 20 min. This P2 pellet corresponds to a crude synaptosome fraction. These synaptosomes were resuspended in ice-cold PBS and resedimented at 12,000 × g for 20 min before the addition of the DSP crosslinker. Crosslinking was performed in ice-cold PBS as described previously (Craige et al., 2008; Salazar et al., 2009).
Behavioral analysis
We performed neurological analysis of mice, aged 7–12 weeks, according to (Krízková and Vozeh, 2004; Chintala et al., 2009). For rotorod analysis, all genotypes were tested at 1 rpm.
Statistical analysis
Experimental conditions were compared with the Mann–Whitney U test using Synergy KaleidaGraph v4.03. For behavioral tests Fisher exact test was performed using the engine: http://faculty.vassar.edu/lowry/VassarStats.html. For synaptic vesicle areas Kolmogorov–Smirnoff test was performed with StatPlus Mac Built5.6.0pre/Universal (AnalystSoft).
Results
AP-3 is found throughout the brain with prominent expression in the hippocampus and striatum
To assess brain region expression of AP-3, we used a monoclonal antibody against the δ subunit of AP-3 (Peden et al., 2004). Using this antibody, we performed immunoperoxidase reactions on Vibratome brain sections from control (WT) and AP-3-deficient Ap3dmh/mh (mocha) mouse brains. We chose representative sections from the striatum, hippocampus, cortex, and amygdala for imaging. Control and mocha brain sections were processed and imaged in parallel using identical parameters so that we could compare immunoperoxidase reaction intensity. We determined immunoperoxidase reaction specificity of this antibody in brain sections from Ap3dmh/mh (mocha) brains, which are null for δ adaptin. The AP-3 δ monoclonal antibody (SA4) generated immunoperoxidase-positive reaction products in control, but not Ap3dmh/mh, brain tissue (Fig. 1 A, compare with 1A, 1A1). Furthermore, the immunoperoxidase signal observed in control can be outcompeted by incubation with an antigenic δ peptide corresponding to the amino acids 680–710 of human δ adaptin (AAD03777; GI:1923266) and common with the murine δ adaptin ortholog (Craige et al., 2008) (Fig. 1 A, compare with 1A, 1A4).
Figure 1.

AP-3 is found throughout the brain with prominent expression in the hippocampus and striatum. A, Immunoperoxidase labeling of control (+/+; A, A2, A4) and AP-3-deficient mocha (mh/mh; A1, A3, A5) striatum in the presence or absence of the monoclonal primary antibody against the δ subunit of AP-3 (Anti AP-3 δ). Binding of the anti-AP-3 δ antibody to the endogenous antigen is outcompeted by incubation with the antigenic δ peptide corresponding to the amino acids 680–710 of human δ adaptin (AAD03777; GI:1923266); see A4. B–C1, Immunoperoxidase labeling of AP-3 in the hippocampus (B), the CA3 region of the hippocampus (B1), the dentate gyrus of the hippocampus (DG; B2), and the striatum (Str; C, C1) of control mouse brain. Scale bars, 1 mm.
By light microscopy, AP-3-positive immunostaining was localized throughout the brain, including the amygdala, cortex, hippocampus and striatum (Fig. 1 B–C1; data not shown). However, AP-3 expression was more prominent within the hippocampus and striatum (Fig. 1 B–C1). Because of their strong AP-3 expression, the following light and electron microscopy analyses will focus on the striatum and hippocampus.
AP-3 localizes to presynaptic axons and terminals
To discern the subcellular compartments where AP-3 is present in neurons, we performed immunofluorescence colocalization of AP-3 in primary cultured neurons from wild-type brain and Vibratome sections of mouse hippocampal dentate gyrus. Synaptic elements were identified with antibodies against the synaptic vesicle proteins VAMP2 and synaptophysin in cultured neurons and brain sections, respectively. As a representative membrane protein sorted to synaptic vesicles by AP-3-dependent mechanisms, we focused on VAMP7-TI. VAMP7-TI is a v-(R)-SNARE whose targeting to synaptic vesicles is altered in all AP-3 deficiencies including Ap3dmh/mh (Salazar et al., 2006; Scheuber et al., 2006; Newell-Litwa et al., 2009). Deconvolution immunofluorescence microscopy of triple-immunolabeled mouse neocortical primary neurons [embryonic day 18.5 (E18.5); days in vitro (DIV) 14] demonstrated that AP-3, the AP-3 cargo VAMP7-TI, and the synaptic vesicle protein, synaptobrevin/VAMP2, colocalize in discrete punctae along neuronal processes (Fig. 2 A). Confocal microscopy of mouse hippocampal sections showed that AP-3 and VAMP7-TI significantly colocalize in synaptic terminals of the dentate gyrus (Fig. 2 C). Unlike VAMP7-TI, AP-3 also exhibits strong expression in cell bodies of the dentate gyrus (Fig. 2 C, inset). Because VAMP7-TI and AP-3 possess overlapping expression in synaptic terminals of the dentate gyrus, we used VAMP7-TI to indicate AP-3-expressing synaptic terminals. Both VAMP7-TI staining and Synaptophysin (Sphysin) colocalized is discrete elements of the dentate gyrus neuropil (Fig. 2 B). These results suggest in vitro and in vivo expression of AP-3 alongside its membrane protein cargo VAMP7-TI in nerve terminals.
Figure 2.
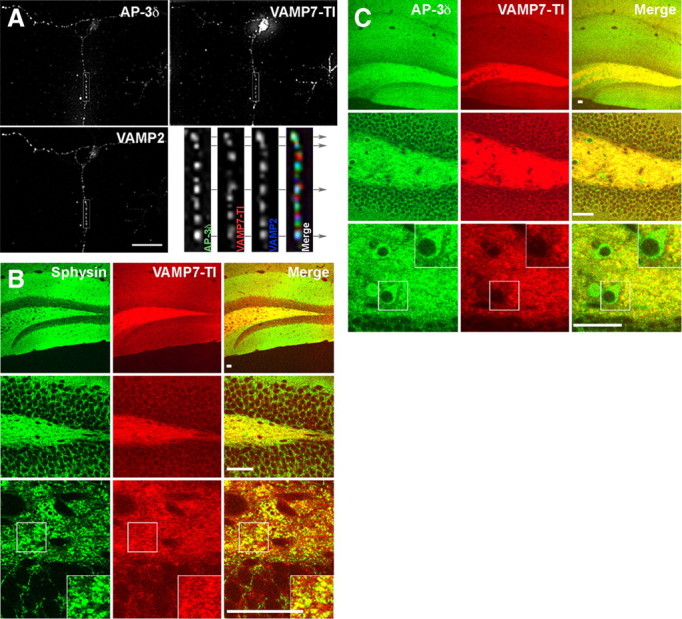
AP-3 localizes to synaptic terminals of the dentate gyrus. A, Fixed E18.5 wild-type C57 mouse primary neuron (DIV 14) immunostained for AP-3, the AP-3 cargo VAMP7-TI, and the synaptic vesicle protein VAMP2/synaptobrevin. Arrows indicate discrete punctae within the neuronal process where all three proteins colocalize. B, Confocal images of control grizzled dentate gyrus immunostained for AP-3 cargo VAMP7-TI and the synaptic vesicle protein, synaptophysin. C, Confocal images of control grizzled dentate gyrus immunostained for AP-3 and the AP-3 cargo VAMP7-TI. Note that AP-3 immunoreactivity is coexpressed with VAMP7-TI in synaptic terminals, but is also found in neuronal cell bodies (bottom rows). The bottom panels in B and C are higher magnifications of the dentate gyrus images shown in the top rows. Scale bar, 25 μm.
We further defined the ultrastructural and subsynaptic localization of AP-3 by quantitative immunoelectron microscopy. We used the monoclonal antibody against the δ subunit of AP-3 due to the signal specificity using immunoperoxidase detection of antigen-antibody complexes (Fig. 1). AP-3-immunoreactive material was detected at the ultrastructural level with biotinylated anti-mouse antibodies and avidin-biotin peroxidase complex. We documented AP-3 expression in the following elements according to their characteristic ultrastructural features (Peters et al., 1991): dendrites, spines, unmyelinated axons, axon terminals, myelinated axons, glia, and “other” for elements that lack a clear ultrastructure. As suggested by the immunofluorescence microscopy, AP-3 prominently localized to axons and nerve terminals in the striatum as well as in the CA3 region and dentate gyrus of the hippocampus. In contrast, AP-3 was minimally detected in either dendritic or glial structures in both the striatum and hippocampus (see Fig. 4 A). AP-3-immunoreactive axonal structures include unmyelinated axons (Figs. 3 C,G, 4), axon terminals (Figs. 3 A–F, 4), and on rare occasions, myelinated axons (data not shown). Thus, while immunofluorescence microscopy (Fig. 2) indicated the presence of AP-3 in axonal structures, electron microscopy further characterized the AP-3 localization showing that it is predominantly expressed in both axon terminals and preterminal unmyelinated axonal segments (Figs. 3, 4).
Figure 4.

The majority of AP-3 partially labels axons in the striatum and hippocampus. Quantification of the number and type of elements immunoreactive for AP-3 per field in electron micrographs of control mouse brain (control grizzled and heterozygous Muted +/mu). We classified the labeled neural structures into the following categories according to ultrastructural criteria defined in Peters et al. (1991): spines, dendrites, axons [axon terminals (AT), myelinated axons (MA), unmyelinated axons (UA), and “other” (glia and unidentifiable structures)]. A, In both the striatum and hippocampus (CA3 and dentate gyrus), AP-3 labels axons (∼5–6 AP-3-positive axons/field), dendrites (∼0.5–1 AP-3-positive dendrite/field), and other elements (∼0.1–0.15 AP-3-positive other/field). B, AP-3 localizes to both unmyelinated axons (∼1.3–2.4 small UA/field; ∼2–3 UA/field; negligible AP-3 immunoreactivity in MA) and axon terminals (∼1 AT/field). C, The majority of AP-3-positive axons exhibit partial labeling (∼3–5 partially labeled axons/field) rather than immunoperoxidase labeling throughout the terminal (all) (∼1.4–1.9 all/field; *p < 0.0001). (n = 4; 147 for striatum; n = 4; 76 for CA3; n = 4; 102 for dentate gyrus; n = number of animals; number of analyzed fields). A field is defined as the area covered by an electron micrograph that corresponds to 11.14 μm2. Fifty percent of the population is contained in the rectangle, which is bisected by the median of the population. One hundred percent of the population is contained in between the brackets.
Figure 3.

Ultrastructural localization of AP-3 by immunoelectron microscopy. AP-3 was detected with the monoclonal antibody against the AP-3 δ subunit and revealed by biotinylated anti-mouse antibodies and the avidin-biotin peroxidase complex. A–F, AP-3 partially labels axon terminals of the striatum (C, E, and F), the CA3 region of the hippocampus (A), and the dentate gyrus (B, D). AP-3 partially labels a preterminal axon in the striatum (C). C, G, AP-3 either partially (white arrows) or wholly (black arrows) labels unmyelinated axons of the striatum (C) and the dentate gyrus (G). AP-3 also labels a dendritic spine in the striatum (F). The frequency of labeling in specific elements is quantified in Figure 4. Scale bar, 0.5 μm. Te, Terminals; Ua, unmyelinated axons; Sp, spines.
Interestingly, AP-3 immunoreactivity in preterminal axons and nerve terminals was frequently confined to a small sector of these structures rather than entirely filling the axon. This is especially unusual for the DAB immunoperoxidase reaction product, which is generally diffuse and fills the entire structure (Hsu et al., 1981). Quantification of AP-3 coverage in axons reveals that AP-3 shows partial labeling in ∼3–5 axons per field (defined here as 11.14 μm2), while the number of axons with total AP-3 coverage is on average less than half of this amount (∼1.5 axons per field) (Fig. 4 C; in Fig. 3, A and G, white arrows indicate axons with partial labeling, while black arrows label unmyelinated with complete coverage). AP-3 in axon terminals closely associates with the membrane of synaptic vesicle profiles (Fig. 3 A–F), prompting us to examine whether the absence of AP-3 alters synaptic vesicle membrane protein composition and/or size in mouse brain synaptic terminals.
Ap3dmh/mh alters synaptic vesicle size in terminals forming asymmetric synapses of adult mouse brain in toto
The presence of AP-3 in axons and nerve terminals suggests that deficiencies in AP-3 could alter the ultrastructural features of presynaptic terminals because deficiencies in either a single synaptic vesicle protein or a vesicle biogenesis mechanism can alter the size/morphology of synaptic vesicles (Zhang et al., 1998; Nonet et al., 1999; Deak et al., 2004; Fremeau et al., 2004). Therefore, we hypothesized that the changes in synaptic vesicle composition triggered by AP-3 deficiencies could lead to modifications in presynaptic ultrastructural architecture (Salazar et al., 2004a,b, 2005a; Seong et al., 2005; Newell-Litwa et al., 2009). To address this issue, we performed a blinded quantitative ultrastructural morphometric analysis of the vesicular content of axon terminals. To maintain a certain level of homogeneity in the population of terminals to be examined, only terminals forming asymmetric axo-spinous synapses in the striatum and dentate gyrus of control and Ap3dmh/mh mocha brains were chosen for analysis. We selected these brain regions because of their high levels of AP-3 immunoreactivity (Fig. 1). We focused on terminals forming asymmetric axo-spinous synapses because these boutons are characteristically excitatory, use glutamate as neurotransmitter, are readily identified by their electron-dense postsynaptic density, and mainly originate from the cerebral cortex (Conti et al., 1989; Baude et al., 1995; Garner and Kindler, 1996). Moreover, the presence of the postsynaptic density offers an ultrastructural landmark to unequivocally identify organelles in close apposition to synaptic contacts. Importantly, AP-3 interacts with a presynaptic marker of excitatory glutamatergic synapses, the vesicular glutamate transporter-1 (VGlut1), both in neuronal cell lines and fractions enriched in nerve terminals (see Fig. 7).
Figure 7.

AP-3 and BLOC-1 form a complex in PC12 cells and synaptosome-enriched rat brain fractions. A, Immunoprecipitation of AP-3 complexes from synaptosome-enriched rat brain fractions. Immunoprecipitation with the monoclonal antibody against AP-3 δ (lanes 5 and 6) isolates AP-3 and the following interacting proteins: VGlut1 and the BLOC-1 subunits, dysbindin and pallidin in the presence of DSP selective crosslinking (lane 6). AP-3 does not interact with TrfR (lanes 3 and 4). Immunoprecipitation with antibodies against TrfR, while capable of isolating TrfR, do not bring down AP-3, VGlut1, or BLOC-1 subunits, dysbindin, and pallidin (lanes 3 and 4). None of these proteins were precipitated with beads alone (lanes 1–2). Lanes 7–8 = 5% input. B, Immunoprecipitation of AP-3 complexes from PC12 cells. Immunoprecipitation with the monoclonal antibody against AP-3 δ (lanes 3 and 4) isolates AP-3 and the following interacting proteins: VGlut1, phosphatidylinositol-4-kinase type II α (PI4KIIα), the BLOC-1 subunits, dysbindin, muted, and pallidin in the presence of DSP (lane 4). AP-3 does not interact with either TrfR or Sphysin (lane 5). Immunoprecipitation with antibodies against TrfR, while capable of isolating TrfR, do not bring down AP-3, VGlut1, PI4KIIα, or BLOC-1 subunits, dysbindin, muted, and pallidin (lanes 1 and 2). Lane 5 = 5% input.
Synaptic vesicle luminal cross-sectional areas scored in the striatum distributed into two populations that resemble those described by Fox (1988). One of these populations (500–550 nm2) predicts an inner vesicle diameter of ∼25 nm similar to that reported in CA1 excitatory synapses in the rodent hippocampus in toto (Schikorski and Stevens, 1997). Notably, the bimodal distribution of synaptic vesicle area was not observed in control dentate gyrus. In fact, dentate gyrus vesicles exhibited a significantly reduced area in comparison with synaptic vesicles from control striatum (see Fig. 6 A). These differences in synaptic vesicle area were observed regardless of whether each brain was analyzed independently or whether data from either the three control or the three mocha brains were pooled and analyzed together.
Figure 6.

Quantification of synaptic vesicle size in terminals forming asymmetric axo-spinous synapses in the striatum and dentate gyrus of Ap3d +/+ and Ap3dmh/mh mouse brain. The distribution in the area of individual synaptic vesicles is represented as both a frequency histogram (top panel) and probability plot (bottom panel). A, Synaptic vesicles from terminal boutons forming asymmetric synapses in wild-type dentate gyrus are statistically smaller than those in wild-type striatum (p < 0.0001 Kolmogorov–Smirnoff test). B, Loss of AP-3 (Ap3dmh/mh) significantly reduces synaptic vesicle size in terminals forming asymmetric synapses in the striatum (p < 0.0001 Kolmogorov–Smirnoff test). C, Loss of AP-3 (Ap3dmh/mh) significantly increases synaptic vesicle size in terminals forming axo-spinous asymmetric synapses of the dentate gyrus (p < 0.0001 Kolmogorov–Smirnoff test). n = 3; 75; 9456 for Ap3d +/+ striatum; n = 3; 32; 5472 for Ap3dmh/mh striatum; n = 3; 19; 3402 for Ap3d +/+ dentate gyrus; n = 3; 18; 3376 for Ap3dmh/mh dentate gyrus; n = number of animals; number of analyzed synaptic terminals; total number of analyzed synaptic vesicles. Graphs represent the pooled data from 3 control or 3 mocha mice.
When we compared mocha and control synaptic vesicles from terminals forming asymmetric axo-spinous synapses from the striatum, we observed a shift to smaller-sized vesicles in mocha as reflected in both area histograms as well as probability plots. (Figs. 5 A–G, 6 B). Although most glutamatergic terminals in the striatum originate from the cerebral cortex and form axo-spinous synapses, a smaller contingent of glutamatergic boutons forming predominantly axo-dendritic asymmetric synapses is provided by axonal projections from the thalamic caudal intralaminar nuclear group, namely the parafascicular nucleus, in rats (Raju et al., 2006). Thus, to compare morphometric vesicular changes between glutamatergic terminals involved in axo-spinous versus axo-dendritic synapses, the synaptic vesicle sizes in terminals forming axo-dendritic asymmetric synapses were also examined, and found not to be significantly different between mocha and control brains. Therefore, these data suggest that the reduced size of synaptic vesicles in striatal glutamatergic terminals is specific to those forming asymmetric axo-spinous synapses, thereby suggesting that they are mainly provided by corticostriatal afferents (supplemental Fig. 1, available at www.jneurosci.org as supplemental material) (Raju et al., 2006). In contrast to these changes in striatal synaptic vesicle size, loss of AP-3 oppositely impacted synaptic vesicle area in the dentate gyrus, with mocha exhibiting larger vesicles than controls (Figs. 5 H–K, 6 C). These results show that AP-3 deficiencies, in addition to determining synaptic vesicle composition (Seong et al., 2005; Newell-Litwa et al., 2009), also affect the ultrastructure of axon terminals in adult mouse brain in toto. Moreover, they unveil region-specific differences in control and AP-3-null synaptic vesicles that were also previously unrecognized.
Figure 5.

AP-3 differentially regulates synaptic vesicle size in asymmetric excitatory synapses of the striatum and dentate gyrus. A–D, Representative electron micrographs of asymmetric excitatory synapses from (A, B) control (Ap3d +/+) and (C, D) AP-deficient (Ap3dmh/mh) striatum. Sp denotes spines apposed to presynaptic terminals. E–G, Synaptic vesicles in terminals forming asymmetric synapses in the striatum of Ap3dmh/mh mice (F–G) are smaller than those in Ap3d +/+ animals (E). H, I, Representative electron micrographs of asymmetric excitatory synapses from (H) control (Ap3d +/+) and (I) AP-deficient (Ap3dmh/mh) dentate gyrus. J, K, Synaptic vesicles from terminals forming asymmetric synapses of the dentate gyrus in Ap3dmh/mh (K) exhibit a larger size than those in Ap3d +/+ mice (J). Statistical analyses of synaptic vesicle sizes in the striatum and the dentate gyrus between mutant and wild-type mice are shown in Figure 6. Scale bars: A–D and H, I, 0.2 μm; G (valid for E–G) 0.066 μm; K (valid for K, J) 0.066 μm.
BLOC-1 deficiencies selectively affect synapses in the dentate gyrus
Region-specific differences in the morphometry of control and AP-3-null synaptic vesicles suggest two nonexclusive hypotheses. First, region-specific differences in synaptic vesicle composition, in both control and AP-3-null brains, may determine differences in synaptic vesicle morphometry. Second, AP-3 interacting factors that modulate AP-3 sorting function may mediate region-specific effects, which could be reflected either as changes in nerve terminal architecture or composition. We tested this last hypothesis using mouse models deficient in subunits of the BLOC-1 complex. BLOC-1 is an octameric complex that interacts with AP-3 (Di Pietro et al., 2006; Salazar et al., 2006; Newell-Litwa et al., 2009). We analyzed mice carrying null alleles in two BLOC-1 subunits, either pallidin (Pldnpa/pa) or muted (Mutedmu/mu). We selected these particular BLOC-1 deficiencies because of their documented role in AP-3-mediated membrane protein sorting (Di Pietro et al., 2006; Salazar et al., 2006, 2009; Newell-Litwa et al., 2009). Both deficiencies lead to a destabilization of the other BLOC-1 subunits (Falcón-Pérez et al., 2002; Li et al., 2003). Furthermore, these BLOC-1 null-alleles are in different genetic backgrounds (Huang et al., 1999; Zhang et al., 2002). Thus, phenotypes observed in Pldnpa/pa and Mutedmu/mu exclude background-specific effects. Finally, Pldnpa/pa and Mutedmu/mu possessed neurological phenotypes shared with AP-3 deficient mice (see supplemental Fig. 2, available at www.jneurosci.org as supplemental material) (Kantheti et al., 1998).
We first confirmed biochemically that BLOC-1 and AP-3 form a complex in fractions enriched in brain nerve terminals (synaptosomes). As controls, we used neuroendocrine PC12 cells expressing vGlut1 (Salazar et al., 2005a). We previously performed crosslinking with the cell-permeable crosslinker DSP followed by complex immunoprecipitation in naive PC12 cells (Craige et al., 2008; Newell-Litwa et al., 2009; Salazar et al., 2009). DSP crosslinking stabilizes adaptor-protein interactions allowing us to selectively isolate AP-3 immunocomplexes under stringent biochemical conditions (Salazar et al., 2009). We isolated AP-3-immunocomplexes using the AP-3 δ monoclonal antibody (SA4), and resolved bead bound material by SDS-PAGE. The composition of the cross-linked AP-3 complexes was assessed by immunoblot. Both in synaptosomes as well as PC12 cells expressing vGlut1, the interaction of AP-3 with BLOC-1 was revealed by the presence of the following BLOC-1 subunits: pallidin, dysbindin, and/or muted (Fig. 7 A, lanes 5 and 6; B, lane 4). We used as positive controls two membrane proteins targeted to synaptic vesicles by AP-3-dependent mechanism, the excitatory neurotransmitter transporter, vGlut1, and/or phosphatidylinositol-4-kinase type II α (PI4KIIa) (Salazar et al., 2005a,b; Craige et al., 2008) (Fig. 7 A, lanes 5 and 6; B, lane 4). In contrast, AP-3 complexes isolated from either synaptosomes or PC12 cells expressing vGlut1 were free of membrane proteins not sorted by AP-3, such as transferrin receptor (TrfR) and/or synaptophysin (Fig. 7 A, lanes 5 and 6; B, lane 4). Conversely, neither BLOC-1 subunits nor synaptic vesicle proteins sorted by AP-3 (vGlut1 and PI4KIIa) were detected in control beads either lacking antibodies or decorated with transferrin receptor antibodies (Fig. 7 A, lanes 1–4; Fig. 7 B, lanes 1 and 2). These results indicate AP-3 and BLOC-1 complexes interact in brain fractions enriched in nerve terminals.
We determined whether Pldnpa/pa and Mutedmu/mu affect synaptic terminals in a region-selective manner by assessing the immunoreactivity levels and distribution of membrane proteins targeted to the synapse. We used monoclonal antibodies to detect either the AP-3 cargo, VAMP7-TI, or the AP-3-independent synaptic vesicle protein, synaptophysin (Newell-Litwa et al., 2009). We performed similar analyses in AP-3 deficient mocha brains as controls since this mouse mutant has more pronounced neurological phenotypes than BLOC-1 deficiencies (Kantheti et al., 1998, 2003; Salazar et al., 2004a; Newell-Litwa et al., 2007). To assess the reliability of phenotypes across multiple experiments and animals as well as data dispersion, we measured immunoreactivity by developing a gross semiquantitative method that measures the intensity of antigen-specific immunoreactivity by ImageJ. To consider changes in immunoreactivity as a positive finding, we set as border conditions that: (1) the averaged immunoreactivity difference between control and mutant mouse brains was statistically significant. (2) Moreover, when more than one mutant allele was analyzed (see below, BLOC-1-deficient Pldnpa/pa, Mutedmu/mu), we considered a positive finding only if a statistical significant difference in immunoreactivity was found between control animals and both mutant alleles.
Using immunoperoxidase light microscopy, we detected a significant and preferential reduction in VAMP7-TI immunoreactivity within AP-3-deficient mocha dentate gyrus (Fig. 8, compare C2,D2, C3,D3). This result is similar to that reported by Scheuber et al. (2006), which provides a validation of our semiquantitative approach. Similarly, BLOC-1 deficiencies also significantly and selectively reduced VAMP7-TI immunoreactivity in the hippocampus, more specifically within the dentate gyrus (Fig. 8, compare E2,F2, E3,F3). VAMP7-TI immunoreactivity remained unaffected or minimally affected in either the striatum or the CA3 pyramidal cell layer in both BLOC-1 deficiencies (Fig. 8 G) as well as Ap3dmh/mh mocha brains. Notably, despite the fact that AP-3 is absent from all mocha brain regions, loss of AP-3 mirrored BLOC-1 deficiencies by preferentially reducing VAMP7-TI within the dentate gyrus (Fig. 8, compare A2–D2, A3–D3, quantification of VAMP7-TI expression, G). Neither AP-3 nor BLOC-1 deficiencies altered the immunoreactivity levels of synaptophysin in any of the analyzed brain regions (Fig. 8, compare A–F, A1–F1, quantification of Sphysin, G). This result therefore excludes the possibility that reductions in VAMP7-TI immunoreactivity may result from a selective loss of synaptic terminals in the dentate gyrus.
Figure 8.

Deficiencies of AP-3 and BLOC-1 selectively reduce VAMP7-TI, but not synaptophysin, expression in the dentate gyrus. A–F1, Immunoperoxidase labeling with a monoclonal antibody against synaptophysin in (A–F) control (Ap3d +/+ and Muted+/mu) and (A1–F1) AP-3- and BLOC-1-deficient mouse brain (Ap3dmh/mh and Mutedmu/mu) in the striatum (A, A1), CA3 region of the hippocampus (B, B1), and the dentate gyrus of the hippocampus (C–F1). Heat maps of the dentate gyrus are represented in D and D1 and F and F1. A2–F3, Immunoperoxidase labeling with a monoclonal antibody against VAMP7-TI in control (Ap3d +/+ and Muted+/mu) (A2–F2) and AP-3- and BLOC-1-deficient mouse brain (Ap3dmh/mh and Mutedmu/mu) (A3–F3) in the striatum (A2, A3), CA3 region of the hippocampus (B2, B3), and the dentate gyrus of the hippocampus (C2–F3). Heat maps of the dentate gyrus are represented in D2–D3 and F2–F3. G, Quantification of Sphysin and VAMP7-TI expression in the dentate gyrus, CA3 pyramidal cell layer of the hippocampus, and the striatum in control (Pldn +/+, Muted +/mu, and Ap3d +/+). Quantification of Sphysin and VAMP7-TI expression in the dentate gyrus, CA3 pyramidal cell layer of the hippocampus, and the striatum in control (Pldn +/+, Muted +/mu, and Ap3d +/+) Synaptophysin is unaffected by either AP-3 or BLOC-1 deficiencies in all brain regions. VAMP7-TI is preferentially reduced in the dentate gyrus of the hippocampus in all AP-3 and BLOC-1 deficiencies (*p = 0.05, Mutedmu/mu; *p < 0.03, Pldnpa/pa; *p < 0.0007, Ap3dmh/mh). For Sphysin in the dentate gyrus and CA3 region of the hippocampus, n = (2,4); (2,4); (2,4); (2,4); (3,6); (3,8). For VAMP7-TI in the dentate gyrus and CA3 region of the hippocampus, n = (2,4); (2,4); (2,4); (2,5); (3,6); (3,8). For Sphysin and VAMP7-TI in the striatum, n = (2,4); (2,8); (2,4); (1,2); (3,6); (3,8). All intensity readings were normalized to background intensity of AP-3 immunoreactivity in AP-deficient (Ap3dmh/mh) or unstained mouse brain sections. Asterisks mark anatomical location used for quantifications. NS, Nonsignificant.
BLOC-1 deficiency reduces AP-3 expression in the dentate gyrus
Based on the association of BLOC-1 with AP-3 and the similarity between the VAMP-7-TI region-specific phenotypes in BLOC-1 and AP-3-null dentate gyrus, we examined whether the absence of BLOC-1 could alter AP-3 content in a region-selective manner. We used immunoperoxidase light and immunoelectron microscopy to detect the δ subunit of AP-3. We examined AP-3 expression in the striatum and hippocampus of two BLOC-1 deficiencies, pallid (Pldnpa/pa) and muted (Mutedmu/mu). In both of these BLOC-1 deficiencies, AP-3 immunoreactivity was significantly reduced throughout the hippocampus in particular in the hilus of the dentate gyrus (DGh) (Fig. 9, compare B,D,E, B1,D1,E1). When measured, AP-3 immunoreactivity levels were consistently and significantly reduced in the dentate gyrus of both Pldnpa/pa and Mutedmu/mu when compared with control brain sections (Fig. 9 F). AP-3 immunoreactivity levels were also reduced in the striatum of Pldnpa/pa, but not in Mutedmu/mu mice, suggesting a mouse background effect in this brain region (Fig. 9 F). In contrast, AP-3 was not appreciably reduced in the CA3 pyramidal cell layer of the hippocampus of either Pldnpa/pa or Mutedmu/mu (Fig. 9, compare A–C, A1–C1; quantification of AP-3 expression, F). We used quantitative immunoelectron microscopy to determine the subcellular neuronal compartments where this AP-3 reduction occurred. Similar to light microscopic observations, electron microscopy analysis of both the striatum and the CA3 pyramidal cell layer of the hippocampus revealed similar amounts of AP-3-labeled elements per field area between control Muted +/mu and BLOC-1-deficient Mutedmu/mu mouse brain (Fig. 10 A). However, immunoelectron microscopy of AP-3 within the dentate gyrus of BLOC-1-null mouse brain (Mutedmu/mu) showed that the number of AP-3-positive elements were reduced by a third in these animals (Fig. 10 A). The absence of BLOC-1 most dramatically affected the labeling of axonal structures, decreasing AP-3 axonal expression to ∼60% of control levels (Fig. 10 B). This reduction significantly affected unmyelinated axons (Fig. 10 C). These data indicate that BLOC-1 selectively regulates AP-3 subcellular distribution and content in the dentate gyrus of the hippocampus. Collectively, our findings support the hypothesis that factors that interact with the AP-3 complex, such as BLOC-1, modulate AP-3-dependent synaptic vesicle biogenesis in a region-specific manner.
Figure 9.

BLOC-1 deficiencies reduce AP-3 expression in the dentate gyrus. A–E1, Immunoperoxidase labeling of control (Muted +/mu) and BLOC-1-deficient (Mutedmu/mu) mouse brain with the monoclonal antibody against the δ subunit of AP-3 in striatum (A, A1), hippocampus (B, B1), CA3 region of the hippocampus (C, C1), and the dentate gyrus (D, D1) of the hippocampus. Heat maps of the dentate gyrus are represented in E and E1. F, Quantification of AP-3 expression in the dentate gyrus, CA3 pyramidal cell layer of the hippocampus, and the striatum in control (Pldn +/+, Muted +/mu, and Ap3d +/+) and BLOC-1-deficient (Pldnpa/pa, Mutedmu/mu) and AP-3-deficient (Ap3dmh/mh) mouse brain. The relative intensity of AP-3 is significantly decreased in the dentate gyrus (*p < 0.004 for Mutedmu/mu and p < 0.0002 for Pldnpa/pa) as well as in the striatum of Pldnpa/pa mice (*p < 0.004). n = (number of animals, number of Vibratome brain sections), listed in the following order Pldnpa/pa; Pldn +/+; Mutedmu/mu; Muted +/mu; Ap3dmh/mh; Ap3d +/+. For AP-3 in the dentate gyrus, n = (2,4); (2,8); (4,8); (2,8); (1,2); (1,3). For AP-3 in the CA3 region of the hippocampus, n = (2,4); (2,8); (4,8); (2,8); (1,2); (1,2). For AP-3 in the striatum, n = (2,4); (2,8); (4,8); (2,6); (1,4); (1,4). All intensity readings were normalized to background intensity of AP-3 immunoreactivity in AP-deficient (Ap3dmh/mh) or unstained mouse brain sections. Asterisks mark anatomical location used for quantifications. NS, Nonsignificant.
Figure 10.

BLOC-1 deficiency reduces axonal AP-3 in the dentate gyrus. Quantification of the number and type of elements immunoreactive for AP-3 per field in electron micrographs of control (Muted +/mu) and BLOC-1-deficient (Mutedmu/mu) mouse brain. A, Total number of AP-3-labeled elements in the striatum, CA3 region of the hippocampus, and the dentate gyrus in Muted +/mu and Mutedmu/mu electron micrographs. AP-3 labeling is significantly reduced in the dentate gyrus of Mutedmu/mu mice compared with Muted +/mu animals (p < 0.0003). B, Comparison of axonal AP-3 labeling with labeling in ‘other’ (glia and unidentifiable) elements in the dentate gyrus of Muted +/mu and Mutedmu/mu. BLOC-1 deficiency significantly reduces AP-3 labeling in axons (p < 0.0001). C, AP-3 labeling of dendrites, unmyelinated axons (UA), and axon terminals (AT) in the dentate gyrus of Muted +/mu and Mutedmu/mu. BLOC-1 deficiency significantly reduces the number of AP-3-labeled UAs (p < 0.0001). (n = 2; 52 for Muted +/mu striatum; n = 3; 82 for Muted mu/mu striatum; n = 2; 37 for Muted +/mu CA3; n = 3; 80 for Mutedmu/mu CA3; n = 2; 47 for Muted +/mu dentate gyrus; n = 3, 97 for Mutedmu/mu dentate gyrus; n = number of animals; number of analyzed fields). A field is defined as the area covered by an electron micrograph which correspond to 11.14 μm2. Graphs represent the pooled data from either all control (Muted +/mu) or all BLOC-1 deficient (Muted mu/mu) mice. Fifty percent of the population is contained in the rectangle, which is bisected by the median of the population. One-hundred percent of the population is contained in between the brackets.
Discussion
Synaptic vesicle biogenesis mechanisms determine quantal neurotransmission. Defects of synaptic vesicle biogenesis pathways result in phenotypes ranging from altered synaptic vesicle composition and morphology to the complete absence of synaptic vesicles from nerve terminals (Kosaka and Ikeda, 1983; González-Gaitán and Jäckle, 1997; Zhang et al., 1998; Nonet et al., 1999; Karunanithi et al., 2002; Shimizu et al., 2003; Koh et al., 2004; Heerssen et al., 2008; Kasprowicz et al., 2008; Sato et al., 2009). The Hermansky-Pudlak complex, AP-3, participates in synaptic vesicle biogenesis from endosomes, with AP-3 deficiencies altering the synaptic vesicle content of mouse brain in toto (Kantheti et al., 1998, 2003; Faundez and Kelly, 2000; Blumstein et al., 2001; Nakatsu et al., 2004; Salazar et al., 2004b, 2005a,b; Seong et al., 2005; Newell-Litwa et al., 2009). Here, we demonstrated that AP-3-dependent synaptic vesicle biogenesis mechanisms differentially affected the composition of synaptic terminals in a brain region-specific manner. In addition to regulating the molecular composition of the synapse, AP-3 likewise uniquely controlled synaptic vesicle size in asymmetric axo-spinous terminals between the striatum and the dentate gyrus of the hippocampus. How do different brain regions modify AP-3-dependent synaptic vesicle biogenesis mechanisms to produce diverse synaptic vesicle phenotypes? Anatomically restricted AP-3-deficient phenotypes are not related to a restricted pattern of AP-3 expression in wild-type brain. In fact, AP-3 is present throughout the brain, although more prominently expressed in both the striatum and hippocampus (Fig. 1). Furthermore, quantitative immunoelectron microscopy indicated that the ultrastructural localization of AP-3 is similar between the striatum and hippocampus (Fig. 3). Therefore, we proposed two alternative mechanisms that could account for anatomically restricted AP-3-dependent phenotypes. One possibility was that the repertoire of synaptic vesicle membrane proteins present in these vesicles differs across brain regions both in their type and stoichiometry. We did not further evaluate this hypothesis in our current research. However, to limit variability in synaptic vesicles due to the type of neurotransmitter stored in them, we focused our analysis of synaptic vesicles on terminals forming asymmetric synapses, which tend to be excitatory in nature (Uchizono, 1965; Hámori et al., 1990; Rollenhagen and Lübke, 2006). At a minimum, the striatum and dentate gyrus shared in common the AP-3 cargo, VAMP7-TI, as well as the AP-3-independent synaptic vesicle protein, synaptophysin (Fig. 8). Alternatively, a nonexclusive mechanism was that AP-3 interacting proteins or protein complexes are either selectively expressed or they specifically modulate AP-3-dependent vesicle biogenesis in a brain region-selective manner. We tested this hypothesis by examining AP-3 and AP-3 cargo expression in BLOC-1 complex deficiencies. We chose to examine how BLOC-1 might distinctively regulate AP-3-dependent synaptic composition for the following reasons. First, AP-3 and BLOC-1 physically interacted in multiple cell types, including primary culture neurons (Fig. 7) (Di Pietro et al., 2006; Salazar et al., 2006; Newell-Litwa et al., 2009; Salazar et al., 2009). Importantly, this AP-3/BLOC-1 supramolecular complex localized to brain fractions enriched for nerve terminals (synaptosomes), as determined by crosslinking and immunoprecipitation assays (Fig. 7). Second, BLOC-1 deficiencies altered the sorting of AP-3-dependent cargo, including the targeting of particular AP-3 cargo to synaptic vesicle fractions among them VAMP7-TI (Di Pietro et al., 2006; Salazar et al., 2006, 2009; Newell-Litwa et al., 2009). Moreover, BLOC-1 subunits are expressed throughout the brain (Talbot et al., 2006; Feng et al., 2008). Intriguingly, we observed that two BLOC-1-null alleles consistently and preferentially reduced the AP-3 cargo, VAMP7-TI in the dentate gyrus. This observation is similar to the VAMP7-TI phenotype reported here (Fig. 8) and by Scheuber et al. (2006) in AP-3-null mocha brain. Furthermore, this BLOC-1-dependent effect upon VAMP-TI levels preferentially within the dentate gyrus correlated with the finding that BLOC-1 deficiencies also specifically reduced AP-3 expression within presynaptic axons of the dentate gyrus (Figs. 9, 10).
Ultimately, these findings suggest the novel concept that anatomical heterogeneity in synaptic vesicle biogenesis mechanisms across brain regions results in synaptic vesicles that differ in size and composition. Our findings that anatomical determinants influenced synaptic vesicle size, both in control as well as AP-3-null brain, are not without precedent. It is well recognized that excitatory and inhibitory synapses in general differ in the morphology of their synaptic vesicles (Uchizono, 1965; Hámori et al., 1990; Rollenhagen and Lübke, 2006). However, synaptic vesicle size and morphology is modulated by the functional state of the synapse or its anatomical location, even among synapses that secrete the same type of neurotransmitter (Zimmermann and Whittaker, 1974; Zimmermann and Denston, 1977; Tokuno et al., 1988; Hámori et al., 1990; Karunanithi et al., 2002; French and Totterdell, 2004; Rollenhagen and Lübke, 2006; Akbergenova and Bykhovskaia, 2009). Here, we demonstrated that synaptic vesicle size is on average smaller in asymmetric excitatory synapses of the dentate gyrus than the striatum (Figs. 5, 6). These inherent differences in synaptic vesicle size among striatum and dentate gyrus suggested the presence of anatomically unique presynaptic mechanisms. One such mechanism could be AP-3-BLOC-1-dependent endosomal sorting of membrane proteins to synaptic vesicles, an idea supported by (1) the differential effects of AP-3 deficiencies in synaptic vesicle size in striatum and dentate gyrus (Figs. 5, 6) and (2) the preferential effects of BLOC-1 deficiencies on AP-3 levels within the dentate gyrus both at the light and electron microscopy level.
Thus, contrary to the current view that synaptic vesicle biogenesis mechanisms are uniform throughout the brain, our research indicates that diverse brain regions exhibit unique synaptic composition and morphology as a consequence of brain region-specific endosomal sorting mechanisms that regulate synaptic vesicle biogenesis. Global loss of AP-3, while expressed throughout the brain, differentially regulated synaptic composition and morphology in the striatum versus the dentate gyrus. Specifically, AP-3 reduced select synaptic vesicle cargo expression in the dentate gyrus, without appreciably affecting the striatum. These cargo differences correlated with either increased synaptic vesicle size in the dentate gyrus or decreased synaptic vesicle size in the striatum. These results suggest that different brain regions distinctively influence AP-3-dependent sorting to synaptic vesicles to result in the observed synaptic alterations.
Footnotes
This work was supported by grants from the National Institutes of Health (NIH) to V.F. (NS42599 and GM077569), K.N.-L. (F31NS058163), and Y.S. (RR00165–Yerkes Primate Center NIH Base Grant). K.N.-L. was supported by a Grant-In-Aid of Research from the National Academy of Sciences, administered by Sigma Xi, The Scientific Research Society. We are indebted to the Faundez laboratory members for their comments.
References
- Advani RJ, Yang B, Prekeris R, Lee KC, Klumperman J, Scheller RH. VAMP-7 mediates vesicular transport from endosomes to lysosomes. J Cell Biol. 1999;146:765–776. doi: 10.1083/jcb.146.4.765. [DOI] [PMC free article] [PubMed] [Google Scholar]
- Akbergenova Y, Bykhovskaia M. Enhancement of the endosomal endocytic pathway increases quantal size. Mol Cell Neurosci. 2009;40:199–206. doi: 10.1016/j.mcn.2008.10.005. [DOI] [PMC free article] [PubMed] [Google Scholar]
- Baude A, Nusser Z, Molnár E, McIlhinney RA, Somogyi P. High-resolution immunogold localization of AMPA type glutamate receptor subunits at synaptic and non-synaptic sites in rat hippocampus. Neuroscience. 1995;69:1031–1055. doi: 10.1016/0306-4522(95)00350-r. [DOI] [PubMed] [Google Scholar]
- Blumstein J, Faundez V, Nakatsu F, Saito T, Ohno H, Kelly RB. The neuronal form of adaptor protein-3 is required for synaptic vesicle formation from endosomes. J Neurosci. 2001;21:8034–8042. doi: 10.1523/JNEUROSCI.21-20-08034.2001. [DOI] [PMC free article] [PubMed] [Google Scholar]
- Chen XW, Feng YQ, Hao CJ, Guo XL, He X, Zhou ZY, Guo N, Huang HP, Xiong W, Zheng H, Zuo PL, Zhang CX, Li W, Zhou Z. DTNBP1, a schizophrenia susceptibility gene, affects kinetics of transmitter release. J Cell Biol. 2008;181:791–801. doi: 10.1083/jcb.200711021. [DOI] [PMC free article] [PubMed] [Google Scholar]
- Chintala S, Novak EK, Spernyak JA, Mazurchuk R, Torres G, Patel S, Busch K, Meeder BA, Horowitz JM, Vaughan MM, Swank RT. The Vps33a gene regulates behavior and cerebellar Purkinje cell number. Brain Res. 2009;1266:18–28. doi: 10.1016/j.brainres.2009.02.035. [DOI] [PMC free article] [PubMed] [Google Scholar]
- Conti F, DeFelipe J, Farinas I, Manzoni T. Glutamate-positive neurons and axon terminals in cat sensory cortex: a correlative light and electron microscopic study. J Comp Neurol. 1989;290:141–153. doi: 10.1002/cne.902900109. [DOI] [PubMed] [Google Scholar]
- Craige B, Salazar G, Faundez V. Phosphatidylinositol-4-kinase type II alpha contains an AP-3-sorting motif and a kinase domain that are both required for endosome traffic. Mol Biol Cell. 2008;19:1415–1426. doi: 10.1091/mbc.E07-12-1239. [DOI] [PMC free article] [PubMed] [Google Scholar]
- Danglot L, Galli T. What is the function of neuronal AP-3? Biol Cell. 2007;99:349–361. doi: 10.1042/BC20070029. [DOI] [PubMed] [Google Scholar]
- Deak F, Schoch S, Liu X, Südhof TC, Kavalali ET. Synaptobrevin is essential for fast synaptic-vesicle endocytosis. Nat Cell Biol. 2004;6:1102–1108. doi: 10.1038/ncb1185. [DOI] [PubMed] [Google Scholar]
- Di Pietro SM, Dell'Angelica EC. The cell biology of Hermansky-Pudlak syndrome: recent advances. Traffic. 2005;6:525–533. doi: 10.1111/j.1600-0854.2005.00299.x. [DOI] [PubMed] [Google Scholar]
- Di Pietro SM, Falcón-Pérez JM, Tenza D, Setty SR, Marks MS, Raposo G, Dell'Angelica EC. BLOC-1 interacts with BLOC-2 and the AP-3 complex to facilitate protein trafficking on endosomes. Mol Biol Cell. 2006;17:4027–4038. doi: 10.1091/mbc.E06-05-0379. [DOI] [PMC free article] [PubMed] [Google Scholar]
- Falcón-Pérez JM, Starcevic M, Gautam R, Dell'Angelica EC. BLOC-1, a novel complex containing the pallidin and muted proteins involved in the biogenesis of melanosomes and platelet-dense granules. J Biol Chem. 2002;277:28191–28199. doi: 10.1074/jbc.M204011200. [DOI] [PubMed] [Google Scholar]
- Faundez VV, Kelly RB. The AP-3 complex required for endosomal synaptic vesicle biogenesis is associated with a casein kinase Ialpha-like isoform. Mol Biol Cell. 2000;11:2591–2604. doi: 10.1091/mbc.11.8.2591. [DOI] [PMC free article] [PubMed] [Google Scholar]
- Feng YQ, Zhou ZY, He X, Wang H, Guo XL, Hao CJ, Guo Y, Zhen XC, Li W. Dysbindin deficiency in sandy mice causes reduction of snapin and displays behaviors related to schizophrenia. Schizophr Res. 2008;106:218–228. doi: 10.1016/j.schres.2008.07.018. [DOI] [PubMed] [Google Scholar]
- Fox GQ. A morphometric analysis of synaptic vesicle distributions. Brain Res. 1988;475:103–117. doi: 10.1016/0006-8993(88)90203-x. [DOI] [PubMed] [Google Scholar]
- Fremeau RT, Jr, Kam K, Qureshi T, Johnson J, Copenhagen DR, Storm-Mathisen J, Chaudhry FA, Nicoll RA, Edwards RH. Vesicular glutamate transporters 1 and 2 target to functionally distinct synaptic release sites. Science. 2004;304:1815–1819. doi: 10.1126/science.1097468. [DOI] [PubMed] [Google Scholar]
- French SJ, Totterdell S. Quantification of morphological differences in boutons from different afferent populations to the nucleus accumbens. Brain Res. 2004;1007:167–177. doi: 10.1016/j.brainres.2004.02.018. [DOI] [PubMed] [Google Scholar]
- Garner CC, Kindler S. Synaptic proteins and the assembly of synaptic junctions. Trends Cell Biol. 1996;6:429–433. doi: 10.1016/s0962-8924(96)10036-2. [DOI] [PubMed] [Google Scholar]
- González-Gaitán M, Jäckle H. Role of Drosophila alpha-adaptin in presynaptic vesicle recycling. Cell. 1997;88:767–776. doi: 10.1016/s0092-8674(00)81923-6. [DOI] [PubMed] [Google Scholar]
- Hámori J, Takács J, Petrusz P. Immunogold electron microscopic demonstration of glutamate and GABA in normal and deafferented cerebellar cortex: correlation between transmitter content and synaptic vesicle size. J Histochem Cytochem. 1990;38:1767–1777. doi: 10.1177/38.12.1979341. [DOI] [PubMed] [Google Scholar]
- Hayashi M, Raimondi A, O'Toole E, Paradise S, Collesi C, Cremona O, Ferguson SM, De Camilli P. Cell- and stimulus-dependent heterogeneity of synaptic vesicle endocytic recycling mechanisms revealed by studies of dynamin 1-null neurons. Proc Natl Acad Sci U S A. 2008;105:2175–2180. doi: 10.1073/pnas.0712171105. [DOI] [PMC free article] [PubMed] [Google Scholar]
- Heerssen H, Fetter RD, Davis GW. Clathrin dependence of synaptic-vesicle formation at the Drosophila neuromuscular junction. Curr Biol. 2008;18:401–409. doi: 10.1016/j.cub.2008.02.055. [DOI] [PMC free article] [PubMed] [Google Scholar]
- Hsu SM, Raine L, Fanger H. Use of avidin-biotin-peroxidase complex (ABC) in immunoperoxidase techniques: a comparison between ABC and unlabeled antibody (PAP) procedures. J Histochem Cytochem. 1981;29:577–580. doi: 10.1177/29.4.6166661. [DOI] [PubMed] [Google Scholar]
- Huang L, Kuo YM, Gitschier J. The pallid gene encodes a novel, syntaxin 13-interacting protein involved in platelet storage pool deficiency. Nat Genet. 1999;23:329–332. doi: 10.1038/15507. [DOI] [PubMed] [Google Scholar]
- Kantheti P, Qiao X, Diaz ME, Peden AA, Meyer GE, Carskadon SL, Kapfhamer D, Sufalko D, Robinson MS, Noebels JL, Burmeister M. Mutation in AP-3 delta in the mocha mouse links endosomal transport to storage deficiency in platelets, melanosomes, and synaptic vesicles. Neuron. 1998;21:111–122. doi: 10.1016/s0896-6273(00)80519-x. [DOI] [PubMed] [Google Scholar]
- Kantheti P, Diaz ME, Peden AE, Seong EE, Dolan DF, Robinson MS, Noebels JL, Burmeister ML. Genetic and phenotypic analysis of the mouse mutant mh2J, an Ap3d allele caused by IAP element insertion. Mamm Genome. 2003;14:157–167. doi: 10.1007/s00335-002-2238-8. [DOI] [PubMed] [Google Scholar]
- Karunanithi S, Marin L, Wong K, Atwood HL. Quantal size and variation determined by vesicle size in normal and mutant Drosophila glutamatergic synapses. J Neurosci. 2002;22:10267–10276. doi: 10.1523/JNEUROSCI.22-23-10267.2002. [DOI] [PMC free article] [PubMed] [Google Scholar]
- Kasprowicz J, Kuenen S, Miskiewicz K, Habets RL, Smitz L, Verstreken P. Inactivation of clathrin heavy chain inhibits synaptic recycling but allows bulk membrane uptake. J Cell Biol. 2008;182:1007–1016. doi: 10.1083/jcb.200804162. [DOI] [PMC free article] [PubMed] [Google Scholar]
- Koh TW, Verstreken P, Bellen HJ. Dap160/intersectin acts as a stabilizing scaffold required for synaptic development and vesicle endocytosis. Neuron. 2004;43:193–205. doi: 10.1016/j.neuron.2004.06.029. [DOI] [PubMed] [Google Scholar]
- Kosaka T, Ikeda K. Possible temperature-dependent blockage of synaptic vesicle recycling induced by a single gene mutation in Drosophila . J Neurobiol. 1983;14:207–225. doi: 10.1002/neu.480140305. [DOI] [PubMed] [Google Scholar]
- Krízková A, Vozeh F. Development of early motor learning and topical motor skills in a model of cerebellar degeneration. Behav Brain Res. 2004;150:65–72. doi: 10.1016/S0166-4328(03)00247-X. [DOI] [PubMed] [Google Scholar]
- Li W, Zhang Q, Oiso N, Novak EK, Gautam R, O'Brien EP, Tinsley CL, Blake DJ, Spritz RA, Copeland NG, Jenkins NA, Amato D, Roe BA, Starcevic M, Dell'Angelica EC, Elliott RW, Mishra V, Kingsmore SF, Paylor RE, Swank RT. Hermansky-Pudlak syndrome type 7 (HPS-7) results from mutant dysbindin, a member of the biogenesis of lysosome-related organelles complex 1 (BLOC-1) Nat Genet. 2003;35:84–89. doi: 10.1038/ng1229. [DOI] [PMC free article] [PubMed] [Google Scholar]
- Li W, Rusiniak ME, Chintala S, Gautam R, Novak EK, Swank RT. Murine Hermansky-Pudlak syndrome genes: regulators of lysosome-related organelles. BioEssays. 2004;26:616–628. doi: 10.1002/bies.20042. [DOI] [PubMed] [Google Scholar]
- Nagy A, Delgado-Escueta AV. Rapid preparation of synaptosomes from mammalian brain using nontoxic isoosmotic gradient material (Percoll) J Neurochem. 1984;43:1114–1123. doi: 10.1111/j.1471-4159.1984.tb12851.x. [DOI] [PubMed] [Google Scholar]
- Nakatsu F, Okada M, Mori F, Kumazawa N, Iwasa H, Zhu G, Kasagi Y, Kamiya H, Harada A, Nishimura K, Takeuchi A, Miyazaki T, Watanabe M, Yuasa S, Manabe T, Wakabayashi K, Kaneko S, Saito T, Ohno H. Defective function of GABA-containing synaptic vesicles in mice lacking the AP-3B clathrin adaptor. J Cell Biol. 2004;167:293–302. doi: 10.1083/jcb.200405032. [DOI] [PMC free article] [PubMed] [Google Scholar]
- Newell-Litwa K, Seong E, Burmeister M, Faundez V. Neuronal and non-neuronal functions of the AP-3 sorting machinery. J Cell Sci. 2007;120:531–541. doi: 10.1242/jcs.03365. [DOI] [PubMed] [Google Scholar]
- Newell-Litwa K, Salazar G, Smith Y, Faundez V. Roles of BLOC-1 and adaptor protein-3 complexes in cargo sorting to synaptic vesicles. Mol Biol Cell. 2009;20:1441–1453. doi: 10.1091/mbc.E08-05-0456. [DOI] [PMC free article] [PubMed] [Google Scholar]
- Nonet ML, Holgado AM, Brewer F, Serpe CJ, Norbeck BA, Holleran J, Wei L, Hartwieg E, Jorgensen EM, Alfonso A. UNC-11, a Caenorhabditis elegans AP180 homologue, regulates the size and protein composition of synaptic vesicles. Mol Biol Cell. 1999;10:2343–2360. doi: 10.1091/mbc.10.7.2343. [DOI] [PMC free article] [PubMed] [Google Scholar]
- Peden AA, Oorschot V, Hesser BA, Austin CD, Scheller RH, Klumperman J. Localization of the AP-3 adaptor complex defines a novel endosomal exit site for lysosomal membrane proteins. J Cell Biol. 2004;164:1065–1076. doi: 10.1083/jcb.200311064. [DOI] [PMC free article] [PubMed] [Google Scholar]
- Peters A, Palay SL, Webster Hd. Ed 3. New York: Oxford UP; 1991. The fine structure of the nervous system: neurons and their supporting cells. [Google Scholar]
- Raju DV, Shah DJ, Wright TM, Hall RA, Smith Y. Differential synaptology of vGluT2-containing thalamostriatal afferents between the patch and matrix compartments in rats. J Comp Neurol. 2006;499:231–243. doi: 10.1002/cne.21099. [DOI] [PMC free article] [PubMed] [Google Scholar]
- Raposo G, Marks MS. Melanosomes–dark organelles enlighten endosomal membrane transport. Nat Rev Mol Cell Biol. 2007;8:786–797. doi: 10.1038/nrm2258. [DOI] [PMC free article] [PubMed] [Google Scholar]
- Rollenhagen A, Lübke JH. The morphology of excitatory central synapses: from structure to function. Cell Tissue Res. 2006;326:221–237. doi: 10.1007/s00441-006-0288-z. [DOI] [PubMed] [Google Scholar]
- Salazar G, Love R, Werner E, Doucette MM, Cheng S, Levey A, Faundez V. The zinc transporter ZnT3 interacts with AP-3 and it is preferentially targeted to a distinct synaptic vesicle subpopulation. Mol Biol Cell. 2004a;15:575–587. doi: 10.1091/mbc.E03-06-0401. [DOI] [PMC free article] [PubMed] [Google Scholar]
- Salazar G, Love R, Styers ML, Werner E, Peden A, Rodriguez S, Gearing M, Wainer BH, Faundez V. AP-3-dependent mechanisms control the targeting of a chloride channel (ClC-3) in neuronal and non-neuronal cells. J Biol Chem. 2004b;279:25430–25439. doi: 10.1074/jbc.M402331200. [DOI] [PubMed] [Google Scholar]
- Salazar G, Craige B, Love R, Kalman D, Faundez V. Vglut1 and ZnT3 co-targeting mechanisms regulate vesicular zinc stores in PC12 cells. J Cell Sci. 2005a;118:1911–1921. doi: 10.1242/jcs.02319. [DOI] [PubMed] [Google Scholar]
- Salazar G, Craige B, Wainer BH, Guo J, De Camilli P, Faundez V. Phosphatidylinositol-4-kinase type II alpha is a component of adaptor protein-3-derived vesicles. Mol Biol Cell. 2005b;16:3692–3704. doi: 10.1091/mbc.E05-01-0020. [DOI] [PMC free article] [PubMed] [Google Scholar]
- Salazar G, Craige B, Styers ML, Newell-Litwa KA, Doucette MM, Wainer BH, Falcon-Perez JM, Dell'Angelica EC, Peden AA, Werner E, Faundez V. BLOC-1 complex deficiency alters the targeting of adaptor protein complex-3 cargoes. Mol Biol Cell. 2006;17:4014–4026. doi: 10.1091/mbc.E06-02-0103. [DOI] [PMC free article] [PubMed] [Google Scholar]
- Salazar G, Zlatic S, Craige B, Peden AA, Pohl J, Faundez V. Hermansky-Pudlak syndrome protein complexes associate with phosphatidylinositol 4-kinase type II alpha in neuronal and non-neuronal cells. J Biol Chem. 2009;284:1790–1802. doi: 10.1074/jbc.M805991200. [DOI] [PMC free article] [PubMed] [Google Scholar]
- Sato K, Ernstrom GG, Watanabe S, Weimer RM, Chen CH, Sato M, Siddiqui A, Jorgensen EM, Grant BD. Differential requirements for clathrin in receptor-mediated endocytosis and maintenance of synaptic vesicle pools. Proc Natl Acad Sci U S A. 2009;106:1139–1144. doi: 10.1073/pnas.0809541106. [DOI] [PMC free article] [PubMed] [Google Scholar]
- Scheuber A, Rudge R, Danglot L, Raposo G, Binz T, Poncer JC, Galli T. Loss of AP-3 function affects spontaneous and evoked release at hippocampal mossy fiber synapses. Proc Natl Acad Sci U S A. 2006;103:16562–16567. doi: 10.1073/pnas.0603511103. [DOI] [PMC free article] [PubMed] [Google Scholar]
- Schikorski T, Stevens CF. Quantitative ultrastructural analysis of hippocampal excitatory synapses. J Neurosci. 1997;17:5858–5867. doi: 10.1523/JNEUROSCI.17-15-05858.1997. [DOI] [PMC free article] [PubMed] [Google Scholar]
- Seong E, Wainer BH, Hughes ED, Saunders TL, Burmeister M, Faundez V. Genetic analysis of the neuronal and ubiquitous AP-3 adaptor complexes reveals divergent functions in brain. Mol Biol Cell. 2005;16:128–140. doi: 10.1091/mbc.E04-10-0892. [DOI] [PMC free article] [PubMed] [Google Scholar]
- Setty SR, Tenza D, Truschel ST, Chou E, Sviderskaya EV, Theos AC, Lamoreux ML, Di Pietro SM, Starcevic M, Bennett DC, Dell'Angelica EC, Raposo G, Marks MS. BLOC-1 is required for cargo-specific sorting from vacuolar early endosomes toward lysosome-related organelles. Mol Biol Cell. 2007;18:768–780. doi: 10.1091/mbc.E06-12-1066. [DOI] [PMC free article] [PubMed] [Google Scholar]
- Setty SR, Tenza D, Sviderskaya EV, Bennett DC, Raposo G, Marks MS. Cell-specific ATP7A transport sustains copper-dependent tyrosinase activity in melanosomes. Nature. 2008;454:1142–1146. doi: 10.1038/nature07163. [DOI] [PMC free article] [PubMed] [Google Scholar]
- Shimizu H, Kawamura S, Ozaki K. An essential role of Rab5 in uniformity of synaptic vesicle size. J Cell Sci. 2003;116:3583–3590. doi: 10.1242/jcs.00676. [DOI] [PubMed] [Google Scholar]
- Swedlow JR, Sedat JW, Agard DA, editors. San Diego: Academic; 1997. Deconvolution in optical microscopy. [Google Scholar]
- Talbot K, Cho DS, Ong WY, Benson MA, Han LY, Kazi HA, Kamins J, Hahn CG, Blake DJ, Arnold SE. Dysbindin-1 is a synaptic and microtubular protein that binds brain snapin. Hum Mol Genet. 2006;15:3041–3054. doi: 10.1093/hmg/ddl246. [DOI] [PubMed] [Google Scholar]
- Tokuno H, Moriizumi T, Kudo M, Kitao Y, Nakamura Y. Ultrastructural differences between pallidohabenular terminals and pallidothalamic terminals. Brain Res. 1988;474:390–393. doi: 10.1016/0006-8993(88)90457-x. [DOI] [PubMed] [Google Scholar]
- Uchizono K. Characteristics of excitatory and inhibitory synapses in the central nervous system of the cat. Nature. 1965;207:642–643. doi: 10.1038/207642a0. [DOI] [PubMed] [Google Scholar]
- Voglmaier SM, Kam K, Yang H, Fortin DL, Hua Z, Nicoll RA, Edwards RH. Distinct endocytic pathways control the rate and extent of synaptic vesicle protein recycling. Neuron. 2006;51:71–84. doi: 10.1016/j.neuron.2006.05.027. [DOI] [PubMed] [Google Scholar]
- Zhang B, Koh YH, Beckstead RB, Budnik V, Ganetzky B, Bellen HJ. Synaptic vesicle size and number are regulated by a clathrin adaptor protein required for endocytosis. Neuron. 1998;21:1465–1475. doi: 10.1016/s0896-6273(00)80664-9. [DOI] [PubMed] [Google Scholar]
- Zhang Q, Li W, Novak EK, Karim A, Mishra VS, Kingsmore SF, Roe BA, Suzuki T, Swank RT. The gene for the muted (mu) mouse, a model for Hermansky-Pudlak syndrome, defines a novel protein which regulates vesicle trafficking. Hum Mol Genet. 2002;11:697–706. doi: 10.1093/hmg/11.6.697. [DOI] [PMC free article] [PubMed] [Google Scholar]
- Zimmermann H, Denston CR. Recycling of synaptic vesicles in the cholinergic synapses of the Torpedo electric organ during induced transmitter release. Neuroscience. 1977;2:695–714. doi: 10.1016/0306-4522(77)90024-0. [DOI] [PubMed] [Google Scholar]
- Zimmermann H, Whittaker VP. Effect of electrical stimulation on the yield and composition of synaptic vesicles from the cholinergic synapses of the electric organ of Torpedo: a combined biochemical, electrophysiological and morphological study. J Neurochem. 1974;22:435–450. doi: 10.1111/j.1471-4159.1974.tb07610.x. [DOI] [PubMed] [Google Scholar]