

Summary
Large-conductance Ca2+- and voltage-gated Slo1 BK channels are allosterically activated by depolarization and intracellular ligands such as Ca2+. Of the two high-affinity Ca2+ sensors present in the channel, the RCK1 sensor also mediates H+-dependent activation of the channel. In this study, we examined the comparative mechanisms of the channel activation by Ca2+ and H+. Steady-state macroscopic conductance-voltage measurements as well as single-channel openings at negative voltages where voltage-sensor activation is negligible showed that at respective saturating concentrations Ca2+ is more effective in relative stabilization of the open conformation than H+. Calculations using the Debye-Hückel formulation suggest that small structural changes in the RCK1 sensor, on the order of few angstroms, may accompany the H+-mediated opening of the channel. While the efficacy of H+ in activation of the channel is less than that of Ca2+, H+ more effectively accelerates the activation kinetics when examined at the concentrations equipotent on macroscopic voltage-dependent activation. The RCK1 sensor therefore is capable of transducing the nature of the ligand bound and transmits qualitatively different information to the channel’s permeation gate.
Keywords: BK channel, Slo1 channel, Ca2+-dependent K+ channel, voltage-gated channel, calcium, potassium, proton
Introduction
Slo1 K+ (BK, KCa1.1, maxiK) channels are well known for their voltage- and Ca2+-dependent activation.1, 2 While neither depolarization nor Ca2+ is required for opening, increases in intracellular Ca2+ concentration ([Ca2+]i) shift the voltage dependence of activation to the negative direction so that more channels open at a given voltage, typically following a faster time course.1, 3 This allosteric gating mechanism, encompassing the channel’s gate, voltage sensors and intracellular Ca2+ sensors4–6, allows the channels to participate in numerous physiological processes, such as vascular tone control, neuronal firing and neurotransmitter release7, 8, providing an important functional link between the membrane excitability and the signaling cascade. Dysfunction of Slo1 BK channel complexes is associated with multiple human diseases including epilepsy.9–11
One BK channel complex contains four Slo1 pore-forming subunits12, each of which possesses a transmembrane voltage-sensor domain (VSD)13 and a large cytoplasmic portion with two recognizable domains, RCK1 (regulator of conductance for K+) and RCK2.14, 15 Four sets of RCK1-RCK2 pairs are thought to form an octameric structure termed a “gating ring” immediately cytoplasmic to the four VSDs and the ion conduction-gate module.16 Opening of the gate to allow K+ flux is commonly visualized to be accompanied by expansion of the cytoplasmic gating ring16 facilitated by binding of intracellular ligands, such as Ca2+ and Mg2+, to their respective sensor sites. 1, 15, 16 The physical characteristics of the ligand sensor sites, including the high-resolution structures and true binding affinities, are not yet known but the results from mutational studies have identified multiple putative ligand sensors in the RCK1 and RCK2 domains.1 The RCK1 domain harbors a high-affinity sensor for Ca2+ (hereafter referred to as the RCK1 sensor) and a distinct lower-affinity divalent cation sensor, which mediates the Mg2+ sensitivity of the channel.17–19 The RCK2 domain, comprised of the aminoacid residues closer to the distal C-terminus, includes another high-affinity Ca2+ sensor termed the Ca2+ bowl (hereafter referred to as the Ca2+ bowl sensor).15, 20 While both the RCK1 and Ca2+ bowl sensors contribute to Ca2+-dependent activation of Slo1 BK channels, some functional differences between the two sensors have been noted. For example, the two sensors differ in their adequate stimulus/ion selectivity and also in their abilities to regulate the kinetics of gate opening.19, 21 The RCK1 sensor plays a major role in determining deactivation kinetics at all [Ca2+]i and activation kinetics at ≥10 μM [Ca2+]i.19 The Ca2+ bowl sensor is particularly important in regulation of activation kinetics at ≤10 μM [Ca2+]i.19
Another important difference between the RCK1 sensor and the Ca2+ bowl sensor lies in their functional responsiveness to H+.22 Lowering intracellular pH (pHi), as it may occur following ischemia23, 24, enhances Slo1 currents by shifting the channel’s voltage dependence of macroscopic activation to the negative direction with an EC50 of 0.35 μM (pHi = 6.6) and a Hill coefficient of ~2 or greater depending on membrane potential25, and this pHi sensitivity requires two His residues, His365 and His394, near or in the RCK1 sensor.22 The two His residues, His365 and His394, have been postulated to represent the primary H+ sensors of the Slo1 channel.26
The H+ sensors His365 and His394 may be in a close proximity of Asp367, a critical component in the RCK1 Ca2+ sensor18, suggesting that H+ may facilitate opening of the channel’s gate in a manner similar to that by Ca2+.26 Consistent with this idea, the Ca2+ sensitivity is impaired by double mutations that disrupt the pHi sensitivity of the Slo1 channel, H365R:H394R and H365A:H394A and the mutation D367A, which interferes with full Ca2+ sensitivity18, also disrupts pHi sensitivity.26 The results of these mutagenesis studies therefore suggest that the RCK1 sensor transduces changes in concentrations of both H+ and Ca2+.26 However, the mechanism by which binding of H+ to its sensors in the RCK1 domain facilitates opening of the gate is not clear. The study here addresses the mechanism of activation of the Slo1 channel by H+ in comparison with that by Ca2+ and illustrates the differential consequences of channel activation promoted by Ca2+ and H+ mediated by the RCK1 domain.
Results
GV shift by intracellular H+
Gating of the Slo1 channel is described by a multi-tier allosteric mechanism in which the VSDs and the intracellular ligand sensors regulate the conformation of the ion permeation gate in a highly inter-dependent manner.1, 5 Studies of Slo1 channel gating are often facilitated by examining channel function under those conditions in which contributions from one or more of the allosteric regulators are absent.5 Following this approach, we compared the effects of H+ and Ca2+ on gating properties of the human Slo1 channel expressed in HEK cells.
Our previous study showed that the pHi dependence of macroscopic Slo1 current activation covers the pHi range from ~7.5 to 6.0; the effect of H+ on the voltage dependence is absent for pHi ≥7.5 and saturated at pHi = 5.7 or lower.25 The use of pHi < 6 severely compromised the stability of the inside-out recording configuration at extreme voltages, and the results presented here utilized pHi = 6.2. The current enhancing effect of H+ at pHi = 6.2 (Fig. 1A, B) is associated with a shift in V0.5 of the GV curve to the negative direction (Fig. 1C) by 58.5 ± 3.2 mV (8) without markedly affecting Qapp (increased by 9.9 ± 4.0% (8)). The effect of H+ on the GV was absent when His365 and His394 in the RCK1 domain were concurrently mutated to Arg or Ala (Fig. 1D), indicating that the V0.5 shift is mediated by the aforementioned His residues in the RCK1 sensor. The results are consistent with the idea that the RCK sensor encompassing His365 and His394 bound with H+ without divalent cations produces a shift in V0.5 of ~−60 mV. The difference in V0.5 between the Arg and Ala double mutants illustrate the importance of the electrostatic interaction involving the residues at positions 365 and 394.26
Figure 1.

H+ enhances Slo1 currents in the absence of divalent cations in a His365- and His394-dependent manner. A. Representative macroscopic currents recorded at pHi = 7.5 (left) and pHi = 6.2 (right) without Ca2+. B. Voltage dependence of the fractional increase in the peak outward current size by pHi = 6.2. Current sizes recorded at pHi = 6.2 without Ca2+ were divided by those at pHi = 7.5 without Ca2+. C. Macroscopic GV curves at pHi = 7.5 (open circles) and pHi = 6.2 (filled circles) without Ca2+. The V0.5 values for the two conditions were 161.1 ± 2.6 mV (8) and 102.6 ± 3.8 mV (8). The Qapp values were 1.22 ± 0.041 e0 (8) and 1.33 ± 0.055 e0 (8). D. The double mutants H365R:H394R and H365A:H394A are largely insensitive to changes in pHi. GV curves with pHi = 7.5 (open circles) and 6.2 (filled circles) in H365R:H394R (left) and in H365A:H394A (right). n=6 and 9 for the H365R:H394R and H365A:H394A, respectively. The V0.5 values for the pHi =7.5 and 6.2 data for the H365R:H394R channel were 109.6 ± 4.9 mV and 102.1 ± 3.3 mV and the Qapp values were 1.31 ± 0.07 e0 and 1.30 ± 0.05 e0. The respective values for the H365A:H394A channel were 177.7 ± 1.4 mV and 171.3 ± 1.7 mV, and 1.31 ± 0.03 e0 and 1.30 ± 0.04 e0. n = 6 and 9 for H365R:H394R and H365A:H394A, respectively.
H+ action on the Ca2+ bowl-defective Slo1 channel
Like H+, Ca2+ also shifts V0.5 to the negative direction and the high-affinity Ca2+ sensitivity of the Slo1 channel saturates at ≥ 100 μM.27 Increasing [Ca2+]i to 200 μM, a saturating concentration, produced a shift in V0.5 of −202.5 ± 7.9 mV (5), more than 3 times greater than produced by H+ at pHi = 6.2 (Fig. 2A, B left). Molecularly, the −200 mV shift in V0.5 by 200 μM Ca2+ includes contributions from the channel’s RCK1 sensor and also the Ca2+ bowl sensor.18, 27 Consistent with earlier results 18, 19, contemporaneous mutations in the two sensors (D362A:D367A:E399A:Δ894-895) essentially abolished the effect of Ca2+ up to 600 μM (data not shown; but see Piskorowski & Aldrich 28). Of the two sensors, the RCK1 sensor responds to H+ and Ca2+ but the Ca2+ bowl sensor is not required for the H+ sensitivity of the channel (Fig. 1D).26 To examine the contribution from the RCK1 sensor in isolation, the pHi dependence of the Ca2+ bowl-defective mutant (Slo1 Δ854-856) having the RCK1 sensor as the sole high-affinity Ca2+ sensor was examined. Consistent with the idea that this mutant channel has the Ca2+ bowl sensor disrupted, Ca2+ at 200 μM produced a shift in V0.5 of −121.0 ± 4.3 mV (9), only ~60% of that observed in the wild-type channel (Fig. 2B right). However, the pHi sensitivity of the mutant channel was similar to that of the wild-type channel; lowering pHi from 7.5 to 6.2 produced a shift in V0.5 of −50.6 ± 2.3 mV (9) (Fig. 2A, B right). Comparison of the changes in V0.5 induced by high concentrations of H+ and Ca2+ in the Ca2+ bowl-defective Slo1 Δ854-856 channel suggests that the RCK1 sensor with Ca2+ bound is more effective in promoting opening of the channel gate than the sensor bound with H+.
Figure 2.

Comparison of GV curves at high concentrations of Ca2+ and H+. A. GV curves for the wild-type (left) and the Ca2+ bowl-defective (Δ854-846; right) Slo1 channels at pHi = 7.5 without Ca2+ (open circles), at pHi = 6.2 without Ca2+ (filled circles), and at pHi = 7.2 with 200 μM Ca2+ (open triangles). B. Changes in V0.5 by pHi = 6.2 (designated as “H+”) and 200 μM Ca2+ (“Ca2+”) for the wild-type (left) and Δ854-846 (right) channels. n=5 and 9 for the wild-type and Δ854-846 channels, respectively.
Comparative effects of Ca2+ and H+ on single-channel Po
The effectiveness of the Ca2+ sensors of the Slo1 channel in stabilizing the open conformation of the gate is described by the allosteric coupling factor C in the gating model of Horrigan and Aldrich (HA model).5 In this model, the equilibrium between the closed and the open conformations of the channel’s permeation gate is described by the equilibrium constant L, which can be experimentally estimated by open probability (Po) measurements in the absence of any ligand at negative voltages where the VSDs are at rest (Fig. 3C top left).5 Furthermore, the HA model postulates that binding of Ca2+ to each of the four subunits in the channel increases the equilibrium constant L by C fold so that at a saturating concentration of Ca2+, the equilibrium between the closed and open conformations of the gate is given by C4*L (Fig. 3C bottom left). Accordingly, the ratio of Po with a saturating concentration of Ca2+ to that without Ca2+ at negative voltages should correspond to C4. The value of C has been estimated to be ~8 for the wild-type Slo1 channel with both the RCK1 and Ca2+ bowl sensors.5 In the Ca2+ bowl-defective Slo1 Δ854-856 channel, increasing [Ca2+]i to 200 μM at pHi = 7.5 caused a ~50-fold increase in Po at −160 mV (48.7 ± 16.6 (3)) and −120 mV (51.3 ± 8.3 (9)) (Fig. 3A, B), giving an estimate of 2.63 ± 0.092 (9) for C based on the results at −120 mV (Fig. 3C). In contrast, H+ at pHi = 6.2 effected only a 3-fold increase in Po at −120 mV (3.14 ± 089 (11)). These results demonstrate that like Ca2+, H+ acts to stabilize the channel’s permeation gate, but suggest H+ may be less efficacious than Ca2+, in line with the finding that the shift in V0.5 is greater for Ca2+ than pH (Fig. 2).
Figure 3.

Relative effects of Ca2+ and H+ in enhancing Po at negative voltages. A. Representative openings at −120 mV at pHi = 7.5 without Ca2+ (top), pHi = 7.5 with 200 μM Ca2+ (middle) and pHi = 6.2 without Ca2+ (bottom) in the Ca2+ bowl-defective Slo1 mutant channel (Δ854-846). The patch contained ~85 channels. Sixty 1-s data segments are shown superimposed. The closed level is indicated by “c”. B. Relative Po with 200 μM Ca2+ at pHi =7.5 (left) and pHi = 6.2 without Ca2+ (right) compared with Po at pHi =7.5 without Ca2+ in the Slo1 Δ854-846 channel. Po in each condition was normalized to that measured at pHi = 7.5 without Ca2+ in each patch. C. Estimated value of the HA model parameter C for Ca2+ (200 μM) and H+ (pHi = 6.2) using the results obtained at −120 mV in the Slo1 Δ854-846 channel. The Po ratio values were raised to the ¼th power to estimate C. The top diagram shows a subset of the HA model at negative voltages without any ligand and the bottom diagram shows the same subset with saturating Ca2+ or H+. D. Relative Po at pHi = 6.2 without Ca2+ compared with Po at pHi =7.5 without Ca2+ in the H365R:H394R channel (open circles) and the H365A:H394A channel (filled triangles).
It is clear from Figs. 3A and 3B that H+ at pH 6.2 is less effective than 200 μM Ca2+ in stabilizing the open conformation; however, these results may underestimate the effect of protons on the RCK1 sensor for the following two reasons. First, it was necessary to use a sub-saturating concentration of H+ (pHi = 6.2) to maintain patch stability. Therefore, the data in Fig. 3B place only a lower limit on the value of C of 1.26 ± 0.072 (11) (Fig. 3C) because the observed increase in Po at −120 mV should be less than C4. Additional evidence suggests that the activating effect of H+ at RCK1 may be partially masked by an inhibitory effect at an unidentified site. In the presence of the double mutation H365R:H394R or H365A:H394A, which removes the sensitivity of macroscopic V0.5 to pHi, lowering pHi from 7.5 to 6.2 did not increase Po at negative voltages (Fig. 3D), affirming that the Po increase observed in the Ca2+ bowl-defective mutant (Fig. 3B) is mediated by the RCK1 sensor. In fact, H+ at pHi = 6.2 actually decreased Po at negative voltages for the double mutants H365R:H394R and H365A:H394A to 44.7 ± 6.3% (7) and 43.4 ± 11.1% of the control values (P < 0.035; Fig. 3D), respectively. The decrease in Po in the His double mutants to ~44% of the control level suggests that the stimulatory effect of H+ on Po mediated specifically by His365 and His394 may be in fact greater than that estimated from the Ca2+ bowl-defective mutant and accordingly the value of C mediate by His365 and His394 may be greater than ~1.63.
Differences in the coupling factor C may be sufficient to explain macroscopic GV shifts by Ca2+ and H+
Because H+ and Ca2+ appear to act by similar mechanisms, we evaluated whether the differences in the value of the HA model parameter C, which describes the strength of coupling between the ligand sensor and the channel’s gate (Fig. 3C), are sufficient to account for the shifts in macroscopic V0.5 caused by Ca2+ and H+. In the case of Ca2+, simulations using the value of C = 2.6 estimated from the effect of Ca2+ on the single-channel Po for the Ca2+ bowl-defective mutant produced a shift in V0.5 by 200 μM Ca2+ of ~−95 mV (Fig. 4A), which is similar, albeit not identical, to the measured shift in V0.5 of −120 mV (see Fig. 2B). In the case of H+, we fit G-V relations at different pHi from pH 7.5 to 6.2 with the HA model (Fig. 4B) yielding parameter values for H+-dependent activation of C = 2.14 ± 0.08 and KD = 1.31 ± 0.18 μM. The predicted relationship between V0.5 and pHi (Fig. 4C) suggests that protonation of the RCK1 site may not saturate until pH ~5, and the estimated value of C = 2.14 is therefore considerably larger than the lower-limit (C > 1.26) estimated from the 3.14-fold increase in Po at −120 mV at pH 6.2. Importantly, however, the model parameters for H+ are consistent with the data at pH 6.2 since they not only reproduce the approximate −50 mV G-V shift from pH 7.5 to 6.2 but also a 3.97-fold increase in Po at −120 mV. Thus, we conclude that differences in the values of C for H+ and Ca2+ together with sub-saturating levels of protons at pH 6.2 are sufficient to account for the different effects of these ligands on steady-state activation.
Figure 4.

GV curves simulated by the HA model with changes in the value of the coupling factor C for the Ca2+ bowl-defective Slo1 channel. A. Simulated GV curves for the conditions with no Ca2+ (thin curve) and with 200 μM Ca2+ (thick curve). The value of C, 2.6 ± 0.09, was estimated based on the Po measurements at −120 mV. The line width of the GV curves represents SEM. B. GV results at different pHi fit with the HA model (smooth curves) with C = 2.14 and KD = 1.31 μM. The measured results are from Avdonin et al.25 C. The V0.5-pHi relation from B is compared with the prediction of the model. The model accounts for an approximate − 50 mV GV shift from pH 7.5 to 6.2 while also predicting a 3.97-fold increase in Po at −120 mV, similar to the observed 3.14-fold increase. Most of the other parameters in the model were fixed to values previously determined by Horrigan et al (zJ = 0.55 e0, zL = 0.38 e0, D =11.6, E = 2.4), while L0 = 7.1 × 10⁻⁶ and Vh(J) = 94 mV were allowed to vary freely.
The HA model contains an additional coupling factor E, representing a weak allosteric interaction between ligand-binding and voltage-sensor activation. For simplicity, the value of E in all simulations was fixed to the value (2.4) determined previously for Ca2+.5 However, there was also some evidence that the E factor is required to account for the effect of H+. While the pH dependence of V0.5 could be fit by eliminating this interaction (E = 1) and increasing C to 3.23 (data not shown), these parameters greatly overestimate the change in Po at −120 mV at pH 6.2, by 2.7-fold. Thus, H+ may also act like Ca2+ to increase voltage-sensor activation.
Ca2+ and H+ have a greater impact on the opening rate constant
The increase in Po by Ca2+ or H+, as the result of an increase in the coupling factor C, could involve an increase in the overall opening rate and/or a decrease in the closing rate. At the negative voltages utilized in our experiments, gating of the Slo1 channel is well described by a simple two-state model, a subset of the HA model, with the effective opening rate constant δ0 and the closing rate constant γ0 (Fig. 5C left). Consistent with the two-state kinetics, the measured open durations were indeed adequately described by a single exponential (Fig. 5A). The two-state kinetics allowed us to estimate the values of the two rate constants using the changes in Po and the mean open time. Both Ca2+ at 200 μM and H+ at pHi = 6.2 increased the mean open duration (P < 0.035; Fig. 5A) but the fractional increase by 200 μM Ca2+ was significantly greater (P < 0.0008). The changes in mean open duration (Fig. 5B) corresponded to 33% and 11% decrease in the value of the closing rate constant γ0 by Ca2+ and H+ (Fig. 5C). Additionally, using the γ0 and Po values, we estimated that Ca2+ increased the value of the opening rate constant δ0 by 34.4 ± 6.0 (9) fold whereas H+ increased the rate constant value by only 2.7 ± 0.7 (10) fold, less than 10% of the increase by Ca2+ (Fig. 5C). Both Ca2+ and H+ have a greater influence on the opening rate constant δ0 than on the closing rate constant γ0 and the changes by Ca2+ are greater than those by H+.
Figure 5.

Changes in the single-channel kinetics of the Ca2+ bowl-defective Slo1 Δ854-846 channel at −120 mV by Ca2+ and H+. A. Representative open duration distributions at pHi = 7.5 without Ca2+ (thin curve), at pHi = 6.2 without Ca2+ (thick curve), and pHi = 7.5 with 200 μM Ca2+(dashed curve). Each curve shows the probability that the open dwell time is greater than the value indicated on the abscissa. B. Fractional changes in the mean open time by 200 μM Ca2+ or with H+ at pHi = 6.2 normalized with the control value at pHi = 7.5 without Ca2+. The mean open durations at pHi = 7.5 without Ca2+, pHi = 6.2 without Ca2+, and at pHi = 7.5 with 200 μM Ca2+ were 0.77 ± 0.005 (13), 0.85 ± 0.003 (10), and 1.2 ± 0.01 (9) ms, respectively. C. Changes in the opening and closing rate constants γ and δ in the HA model. The diagram depicts the two states in the HA model operative at negative voltages where VSD activation is negligible. The value of γ0 was estimated as the reciprocal of the mean open time and that of δ0 was derived from Po and γ0 using the expression Po = δ0/(δ0 + γ0). The rate constant values are normalized to the respective values recorded at pHi = 7.5 without Ca2+ in each patch. The values of γ (s−1) for the results obtained at pHi = 7.5 without Ca2+, pHi = 6.2 without Ca2+ and at pHi = 7.5 with 200 μM Ca2+ were 13, 342 ± 642 (13), 11, 858 ± 395 (10) and 9, 028 ± 586 (9), respectively. For δ, the values (s−1) were 0.013 ± 0.002 (13), 0.025 ± 0.004 (10), and 0.35 ± 0.09 (9), respectively.
Macroscopic activation and deactivation kinetics
The results of the single-channel analysis that Ca2+ is more effective than H+ in decreasing the closing rate constant γ0 and also in increasing the opening rate constant δ0 suggest that the two RCK1 sensor ligands may differentially regulate the channel’s macroscopic kinetics. Specifically, 200 μM Ca2+ should slow the macroscopic deactivation kinetics and accelerate the activation kinetics more effectively than pH 6.2 if the single-channel results obtained at negative voltages can be extrapolated to positive voltages. We therefore compared the changes in macroscopic kinetics caused by pHi = 6.2 and 200 μM Ca2+ in the Ca2+ bowl-defective Slo1 Δ854-856 channel (Fig. 6). Both Ca2+ at 200 μM and H+ at pHi = 6.2 slowed the deactivation kinetics (Fig. 6A left) and accelerated the activation kinetics (Fig. 6A right). Comparison of the fractional changes in the activation and deactivation time constant values (Fig. 6B) showed that Ca2+ at 200 μM was more effective than H+ in regulating the channel kinetics. At negative voltages (≤−120 mV), Ca2+ increased the deactivation time constant by ~100% in a relatively voltage-independent manner whereas H+ at pHi = 6.2 increased the time constant by only ~50% (Fig. 6C). Similarly, at positive voltages (≥120 mV), Ca2+ had a noticeably greater effect than H+ in decreasing the mean activation time constant; Ca2+ decreased the time constant down to ~10% and H+ decreased it to ~30% of the value without Ca2+ at pHi = 7.5 in a voltage-independent manner (≥120 mV). The steepness of the voltage dependence of the time constant at negative (≤−120 mV) and positive (≥180 mV) was not markedly altered by Ca2+ at 200 μM or H+ at pHi = 6.2 compared with that at pHi = 7.5 without Ca2+. However, a simple shift of the voltage dependence of the time constant observed at pHi = 7.5 without Ca2+ to the negative direction by −50.6 mV (Fig. 6B dashed curve), the V0.5 change caused by H+ at pHi = 6.2 (Fig. 2), did not match the voltage dependence of the time constant at pHi = 6.2 especially at positive voltages (>150 mV); the acceleration of the activation kinetics by H+ at pHi = 6.2 was more pronounced than that predicted by the simple shift along the voltage axis, as is the case for Ca2+ (Fig. 6B)5, H+ at pHi = 6.2 did not alter macroscopic current kinetics in the H365R:H394R and H365A:H394A channels in the voltage range of −220 to 270 mV (Fig. 6D), confirming that the changes in the macroscopic current kinetics are mediated by His365 and His394 in the RCK1 sensor.
Figure 6.
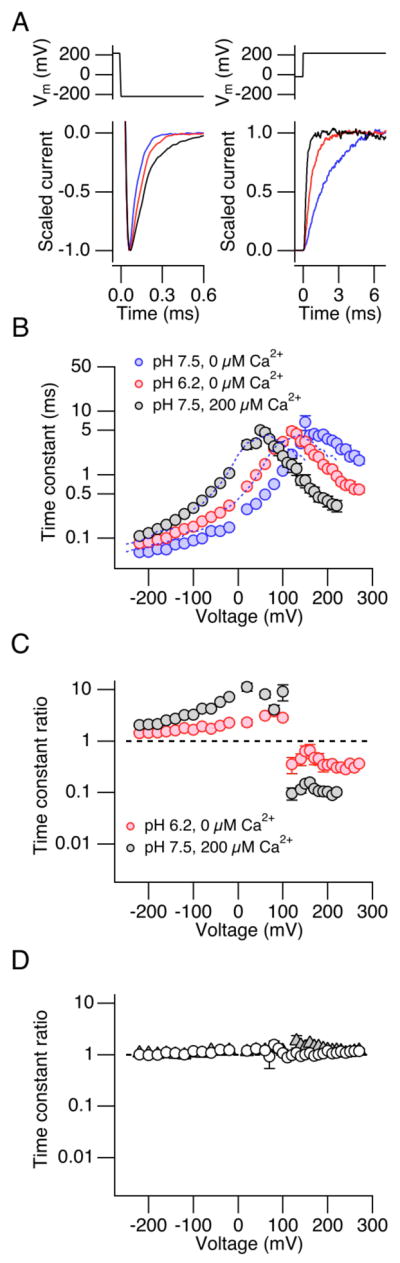
Differential effects of high concentrations of H+ and Ca2+ on the macroscopic kinetics of the Ca2+ bowl-defective mutant Slo1 Δ854-855. A. Representative scaled currents at −200 mV (left panel) and 220 mV (right panel) at pHi = 7.5 (blue) or pHi = 6.2 without Ca2+ (red), and pHi =7.5 with 200 μM Ca2+ (black). B. Voltage dependence of the activation and deactivation time constant at pHi = 7.5 (blue) or pHi = 6.2 without Ca2+ (red) and pHi =7.5 with 200 μM Ca2+ (black) in the Slo1 Δ894-895 channel. n=10. C. Fractional changes in the activation and deactivation time constant on decreasing pHi from 7.5 to 6.2 without Ca2+ (red) or increasing [Ca2+]i to 200 μM at pHi = 7.5 (black). The time constant values were normalized to those measured at pHi = 7.5 without Ca2+ in each patch. n=10. D. Fractional changes in the activation and deactivation time constant by low pHi = 6.2 in the H365R:H394R (open circles) and H365A:H394A channels (filled triangles). At ≤100 mV, the values for the two mutants are very similar and the triangles are not discernible. n ≥ 6.
Titration of the voltage dependence of activation by Ca2+ and H+
To better characterize how H+ and Ca2+ regulate the channel kinetics, we titrated the macroscopic V0.5 of the Ca2+ bowl-defective Slo1 channel by manipulating pHi and [Ca2+]i so that the current kinetics could be compared when their V0.5 values are equal. We found that the V0.5 and Qapp values with 10 μM Ca2+ at pHi =7.5 were indistinguishable from those at pHi = 6.2 without Ca2+ (P ≥ 0.44; Fig. 7A). While H+ at pHi = 6.2 and Ca2+ at 10 μM produced statistically indistinguishable shifts in V0.5, the effects on the kinetics of the channel were clearly different. H+ at pHi = 6.2 accelerated the activation kinetics to a greater extent than Ca2+ at 10 μM (Fig. 7B, C, D). For example, at 270 mV (Fig. 7B right), H+ at pHi = 6.2 decreased the time constant of activation to ~30% of the control value (Fig. 7C, D red) while Ca2+ at 10 μM at pHi = 7.5 decreased the activation time constant to ~60% (Fig. 7C, D; black). At ≥200 mV, both H+ and Ca2+ decreased the activation time constant without markedly altering its voltage dependence. Both H+ and Ca2+ slowed the deactivation kinetics at ≤ 0 mV in the Ca2+ bowl-defective mutant. However, in contrast with the results at positive voltages, H+ and Ca2+ were equally potent in slowing the deactivation kinetics (Fig. 7B–D). These observations about the changes in kinetics in the Ca2+ bowl-defective Slo1 channel with Ca2+ at 10 μM are consistent with the results of Zeng et al.19 Similar titration procedures using the wild-type channel with both the RCK1 and Ca2+ bowl sensors (Fig. 7E–H) showed that H+ at pHi = 6.2 and Ca2+ at 1 μM produced indistinguishable shifts in V0.5 and that the comparative effects of H+ and Ca2+ on the wild-channel were similar to those observed in the Ca2+ bowl mutant channel with 10 μM Ca2+.
Figure 7.

Titration of the steady-state activation of the Ca2+ bowl-defective Slo1 mutant (Δ854-855; A–D) and of the wild-type channel (E–F) with Ca2+ and H+. A, E. Macroscopic GV curves at pHi = 7.5 without Ca2+ (blue), pHi = 6.2 without Ca2+ (red) and pHi = 7.5 with 10 μM Ca2+ (black) in the Ca2+ bowl-mutant channel (A) and with 1 μM Ca2+ (black) in the wild-type channel (E). The V0.5 values for the three conditions in the Ca2+ bowl mutant were 188.8 ± 3.6 mV (6), 132.2 ± 2.1 mV (6) and 139.5 ± 7.3 mV (6), respectively, and those for the wild-type channel were 161.1 ± 2.6 mV (8), 102.6 ± 3.8 mV (8) and 99.5 ± 3.0 mV (8), respectively. The Qapp values were for the Ca2+ bowl mutant were 1.23 ± 0.067 e0 (6), 1.34 ± 0.072 e0 (6) and 1.27 ± 0.073 e0 (6), and those for the wild-type channel were 1.22 ± 0.041 e0 (8), 1.33 ± 0.055 e0 (8) and 1.28 ± 0.042 e0 (8). B, F. Representative scaled currents at −220 mV (left) and 270 mV (right) in response to the voltage pulses shown (top in each panel) in the Ca2+ bowl mutant (B) and the wild-type channel (F). C, G. Voltage dependence of the activation and deactivation time constant in the Ca2+ bowl mutant (C) and the wild-type channel (G). The dashed blue curve shows the results at pHi = 7.5 without Ca2+ shifted by −58 mV in C and −60 mV in G. n= 6 and 8. D, H. Fractional changes in the activation and deactivation time constant by pHi = 6.2 without Ca2+ (red) and pHi = 7.5 with 10 μM Ca2+ (black) in the Ca2+ bowl-mutant channel (D) and 1 μM Ca2+ (black) in the wild-type channel (H). The dashed blue curve shows the results expected from shifting the time constants measured at pHi = 7.5 without Ca2+ by −50 mV in (D) and −60 mV in (G).
Titration of the voltage dependence of activation by Mg2+ and H+
As performed using Ca2+, we titrated the macroscopic V0.5 of the wild-type channel using Mg2+, another intracellular ligand of the Slo1 channel. 17, 18 The Mg2+-sensitivity is mediated by a mechanism distinct from that underlying the activation by Ca2+. 17, 18, 29, 30 We found that Mg2+ at 6 mM induces the same shift in V0.5 as that by lowering pHi to 6.2 without Ca2+ (Supplementary Figure 1A). However, H+ at pHi = 6.2 more effectively accelerated that activation kinetics than Mg2+ at 6 mM (Supplementary Figure 1B, C).
Discussion
Open probability and the kinetics of the Slo1 BK channel are finely regulated by binding of ion ligands such as Ca2+, Mg2+ and H+, to their respective sensors in the cytoplasmic RCK1 and RCK2 domains.1, 19, 22 We showed previously that H+, acting via the high-affinity RCK1 Ca2+ sensor, dramatically increases Slo1 macroscopic currents.22, 25 In this study, we examined the mechanism of the channel activation by H+ mediated through the RCK1 sensor in comparison with that by Ca2+.
Steady-state activation properties
Gating of the Slo1 channel is well described by a multi-tier allosteric mechanism in which activation of voltage and ligand sensors stabilizes the open conformation of the channel’s ion permeation gate. The gate can also influence the sensors in a reciprocal manner. For example, according to the HA model5, the equilibrium constant L describes the closed-open equilibrium of the channel’s gate in the absence of allosteric influences from the voltage and ligand sensors, and the open state occupancy becomes more probable by C4 folds when all Ca2+ sensors in the four subunits are saturated with Ca2+. Mutagenesis studies suggest that each Slo1 subunit most probably harbors two high-affinity Ca2+ sensors, the RCK1 sensor and the Ca2+ bowl sensor.15, 18–20 Using the Ca2+ bowl-defective Slo1 mutant with the RCK1 sensor intact, our measurements of the single-channel activity at negative voltages where VSD activation should be negligible show that the value of C for Ca2+ acting through the RCK1 sensor is ~2.6, representing about 50% of the energetic effect of Ca2+ on the wild-type channel.5 Thus, when one RCK sensor contains Ca2+, the open state occupancy is stabilized by 0.57 kcal/mole (ΔG = kT ln(C)) and H+ at pH 6.2 is about 25 to 50% as effective in stabilizing the open state based on the effect on Po at-120 mV (C = 1.26–1.63). However, full occupancy by H+ may be almost 80% as effective as Ca2+ or ΔG = 0.46 kcal/mol, based on a value of C = 2.14 estimated from the pH dependence of V0.5 (Fig. 4B).
Simulations based on the HA model suggest differences in the value of C for Ca2+ (2.6) and H+ (2.14) are sufficient to account for both the observed shifts in macroscopic GV curves as well as change in single-channel Po at negative voltages by 200 μM Ca2+ or pHi 6.2. Therefore, the different actions of these ligands can be primarily attributed to their ability to stabilize the open conformation. However, we cannot rule out minor contributions from two additional mechanisms. First, an unanticipated inhibitory effect of H+ may mask the stimulatory effect of H+. In the absence of His365 and His394, H+ at pHi = 6.2 decreases Po by ~56%. The molecular mechanism and locus responsible for this inhibitory effect are not clear but the overall consequence is underestimation of the value of C. Second, our study did not address whether H+ changes the strength of allosteric coupling between the RCK1 sensor and the VSDs. Multiple lines of evidence, including gating current measurements, suggest that VSD activation is facilitated when Ca2+ is bound to the ligand sensors.5 The strength of the coupling conferred by Ca2+ is described by the parameter E in the HA model and estimated to be 2.4 for the wild-type channel. It is conceivable that H+ also alters the value of the parameter E. However, the data suggest a value of E similar to that for Ca2+ is necessary to account for both the changes in V0.5 and PO at −120 mV at pH 6.2.
Structural rearrangements within the RCK1 sensor
Protonation of His365 and His394 has been proposed to drive Slo1 channel activation through electrostatic interaction with nearby charged residues including Asp367 in the RCK1 site because the effect of pHi is reduced by mutation of Asp367 or increased ionic strength.26 Given that H+ alters the C-O equilibrium, this electrostatic mechanism suggests that the distance between the two His residues and Asp367 may decrease during opening of the ion permeation gate. To determine if such a mechanism is compatible with our results, we first calculated how large a movement would be required to account for the full energetic effect of H+ on channel opening, ΔG = 0.46 kcal/mol. The change in free energy involved in moving 2 positive charges (His365 and His394) from a distance RC to RO relative to Asp367 is:
where V(r), the electrostatic potential of Asp367, can be approximated by the Debye-Hückel expression:
where ε0 = 8.85×10⁻¹² C2/Jm, εr = 80, R = 8.31 J/mol.K, T = 293 K, F = 9.65×10⁴ C/mol, and I = ionic strength. If we assume an initial distance RC = 7 Å in the closed state (the approximate Debye length in our standard recording solutions with I = 0.18 M), then a distance change of only 2.2 Å (RO = 4.8 Å) would be sufficient to account for C = 2.1. This estimate assumes an aqueous dielectric constant, consistent with the interaction of surface-exposed charged groups on proteins.31
A similar result was obtained when we fit the dependence of ΔV0.5 in response a change in pHi to 6.2 on ionic strength using the Debye-Hückel expression (Fig. 8). In this case, the relationship between the magnitude of ΔV0.5 and ΔG cannot be determined exactly because ΔV0.5 reflects energetic effects of H+ on both the C-O transition (allosteric coupling factor C) and VSD activation (coupling factor E). Therefore, we fit the data with the HA model using two different assumptions about the effect on ionic strength on C and E. In the first case (Fig. 8, solid curve), we assumed that the E factor is constant whereas the C factor (ΔG) varies with ionic strength according to the Debye-Hückel expression, yielding values of RC = 8.8 ± 0.7 Å and RO = 5.4 ± 0.5 Å. In the second case (Fig. 8, dotted curve), we assumed that C and E are both sensitive to ionic strength, reflecting electrostatic interaction of His365 and His394 with two equidistant point charges in the RCK1 site and VSD respectively, yielding values of RC = 5.7 ± 0.3 Å and RO = 4.2 ± 0.2 Å. Although there is some ambiguity in these fits because of assumptions about interaction with the VSD, the apparent insensitivity of ΔV0.5 to I ≤ 0.18 M requires that the distances involved are similar to the 7 Å Debye length at I = 0.18 M. Therefore, consistent with the earlier suggestion26, it is reasonable that His365 and His394 are in close proximity to other charged groups in or near the RCK1 site. Thus, two different methods suggest that subtle movements of these groups relative to each other during channel opening would be sufficient to account for the observed energetic effect of H+ on channel opening. A critical test of this idea awaits availability of experimentally-derived structural information on the RCK1 sensor.
Figure 8.
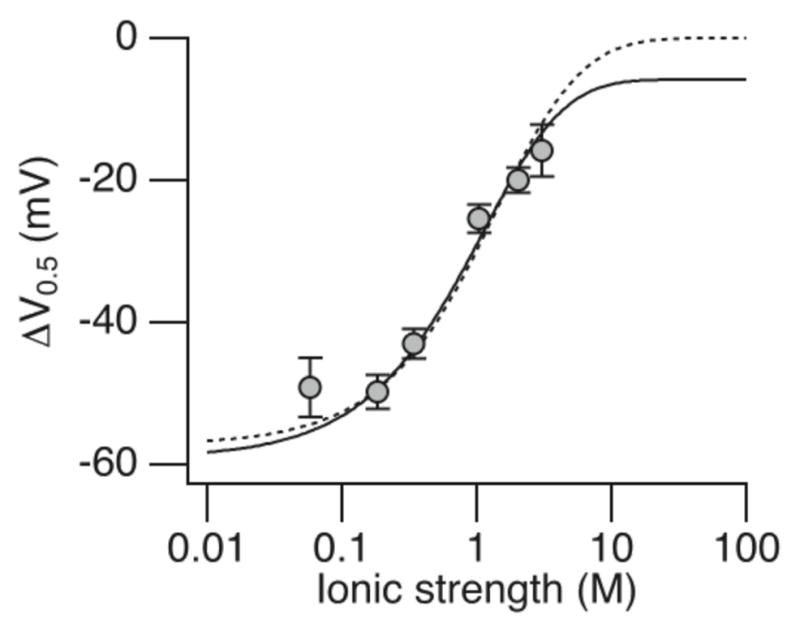
Fit of the dependence of V0.5 on ionic strength using the Debye-Hückel formulation together with the HA model. ΔV0.5 was measure from pHi 7.2 to 6.2 for the wild-type channel in different concentrations of KCl (from Hou et al. 22). Model parameters at ionic strength 0.18 M were determined from Fig. 4 (zJ = 0.55 e0, Vh(J) = 94 mV, L0 = 7.1 × 10⁻⁶, zL = 0.38 e0, KD = 1.31 μM, C = 2.14, D = 11.6, E = 2.4). The solid fit was obtained with the assumption that C varies with ionic strength according to the Debye-Hückel formulation (see text for details), while E remains constant (RC = 8.8 ± 0.7 Å and RO = 5.4 ± 0.5 Å). The dashed fit assumed that both C and E vary with ionic strength (RC = 5.7 ± 0.3 Å and RO = 4.2 ± 0.2 Å). For simplicity, the two His residues in the RCK1 sensor were assumed to interact with a negative charge in the resting VSD at a distance (RR), which was set equal to RC. The dashed fit predicts a decrease in this distance with voltage-sensor activation of 1.6 Å.
Comparative effects of Ca2+ and H+
The notion that subtle conformational changes occur within the RCK1 sensor during channel opening promoted by H+ is implicit in allosteric models like the HA model, which assumes that the ligands can bind to both open and closed channels but do so with higher affinity to the open conformation. In the HA model, opening of the channel’s gate increases the effective affinity of each sensor by C folds. Therefore, the smaller value of C estimated for H+ than that for Ca2+ implies a smaller difference in ligand binding affinity between the closed and open conformations of the channel with H+ than Ca2+. This energetic difference may be related to how the two ligands are coordinated by the RCK1 sensor. Binding of Ca2+ to the RCK1 sensor most probably requires multiple structural elements such that any change in the binding site during opening could geometrically perturb the coordination. In contrast, changes in H+ affinity imply a change in pKa of the binding sites (His365 and His394), which is expected to be more readily influenced by electrostatic interactions than geometric considerations. The contrasting requirements for binding of Ca2+ and H+ may contribute to the differential sensitivity of the RCK1 sensor to the channel’s gate status and underlie the markedly different efficacies of the two ligands as measured by V0.5 changes.
A decrease in pHi by one unit, which may occur following brain ischemia32, is as effective as 1 μM Ca2+ in the wild-type channel and 10 μM Ca2+ in the Ca2+ bowl deletion mutant channel in shifting V0.5 to the negative direction. At these concentrations, despite their equipotency in shifting V0.5, H+ and Ca2+ have very distinct effects on the channel kinetics. H+ is noticeably more effective than Ca2+ in accelerating the activation kinetics in response to depolarization; comparison of the activation time constant shows that the channel gate opens nearly twice as fast with H+. The kinetics of the channel opening promoted by H+ is also faster than that by Mg2+. It is not, however, possible to pinpoint the biophysical basis of the greater acceleration by H+ because multiple allosteric interactions are at play. For example, the effect could be mediated directly through the RCK1 sensor’s coupling to the gate or indirectly via the channel’s VSDs. Regardless of the underlying mechanism, the RCK1 sensor has a capability to encode the nature of the bound ligand and transmits qualitatively different information to the channel’s gate.
Possible physiological and pathophysiological implications
The multiplex nature of the coupling between the RCK1 sensor and the channel gate, controlling the kinetics and steady-state activation properties differentially, most probably contributes to the well-known functional diversity of the Slo1 BK channel.8 Such an arrangement allows the Slo1 BK channel to participate in numerous physiological and pathophysiological phenomena occurring over different time scales and in different tissues, from determination of action potential duration33 to regulation of vascular smooth muscle tone.34 For example, in hippocampal neurons, transient activation of Slo1 BK channel complexes plays a role in frequency-dependent broadening of action potentials such that BK channel inhibitors increase the spike duration and abate further frequency-dependent broadening.35 The spike broadening is enhanced by high intracellular concentrations of exogenous pH buffers36, suggesting that the H+-mediated activation of the RCK1 sensor normally acts to minimize spike broadening. The multi-ligand characteristic of the RCK1 sensor may also come into play during ischemia, which is accompanied by changes in intracellular concentrations of many ions with distinct time courses. 23, 24 Typically, intracellular acidosis, up to one pH unit32, an increase in [Na+] and a decrease in [ATP], are first observed, followed by a delayed increase in [Ca2+]i.23, 24 Intracellular [Mg2+] also increases.24 The rapid acidosis during ischemia suggests that activation of Slo1 BK channel complexes by H+ mediated by the RCK1 sensor may represent a first line of defense during an early phase of ischemic injury. With prolonged ischemia, [Ca2+] increases and Ca2+-dependent activation of the channel may become dominant, leading to greater activation of the channels. It is interesting to note that the increases in [H+], [Ca2+] and [Mg2+] known to be associated with ischemia24 all promote opening of the Slo1 BK channel, further reinforcing the notion that the Slo1 BK channel plays a protective role during ischemic insults. Differential consequences of activation of Slo1 BK channels by these intracellular ligands may allow the channels to respond appropriately to different phases of ischemia. The kinetics of the Slo1 BK channel complex plays important functional roles in the nervous system where fast signaling is often required. The importance of the channel kinetics is well illustrated in a study examining the mechanism of the epilepsy-causing mutation D369G (using the numbering in AAB65837 used in this study) in the RCK1 sensor.11 Thus, the pHi sensitivity of the Slo1 channel may be particularly important in the neuronal function.
Methods
Channel expression
Wild-type and mutant human Slo1 channels (U11058/AAB65837) were transiently expressed in HEK tsA cells using plasmid DNAs. Electrophysiological measurements were performed 24 to 48 hrs later as described previously.22
Electrophysiology
Macroscopic and single-channel currents were measured in the inside-out configuration using an Axopatch 200B (Molecular Devices, Sunnyvale, CA) amplifier as described.37 For macroscopic current measurements, recording electrodes had a typical initial resistance of 1 MΩ when used with the solutions described below, and 50 to 60% of the initial input resistance was electronically compensated. Macroscopic leak and capacitative currents were subtracted with a P/6 protocol using the leaking holding voltage of −50 mV. Both macroscopic and single-channel currents were filtered at 10 kHz through the built-in filter of the amplifier and digitized at 100 kHz. Voltage pulses were applied every 3 s or greater.
Data analysis
Macroscopic currents were analyzed using custom routines implemented in IgorPro (Wavemetrics, Lake Oswego, OR) running on Mac OS as described.37, 38 Typically, voltage dependence of macroscopic conductance (GV) was estimated from the extrapolated sizes of the instantaneous tail currents at −40 mV following pulses to different voltages and fitted with a Boltzmann function as a data descriptor function. Each GV was characterized by its half-activation voltage (V0.5) and apparent charge movement (Qapp). Activation and deactivation kinetics were characterized by fitting the currents with a single exponential excluding the initial 250 μs and 160 μs, respectively. The voltage dependence of the time constant was in turn fitted with the equation τ(V)= τ0*exp(qV/kBT) where τ(V) is the time constant at voltage V, τ0 is the time constant value at 0 mV, q is the partial charge value, and kB and T have their usual meanings. Single-channel open probability was estimated using all-point amplitude histograms and corrected for the number of channels present in each patch. The number of channels present was determined using the macroscopic peak current size at ≥220 mV and the single-channel current-voltage relation estimated using voltage ramps as described.37 Single-channel open probability values obtained at low pHi, with Ca2+ and Mg2+, were normalized to the control values obtained at pHi = 7.5 without any Ca2+ and referred to as Po ratios. This normalization was necessary as the variability in the estimated absolute open probability values at negative voltages was high, often ranging from 1 × 10⁻⁷ to 2 × 10⁻⁶ at −120 mV on a given day of experiments. Single-channel dwell times were measured as described previously39 and were not corrected for the left-censor time of the recording system.
The parameter C in the allosteric gating model of Horrigan and Aldrich (HA model)5 was estimated from single-channel open probability measurements at negative voltages where VSD activation is negligible, typically −160 or −120 mV. These voltages were deemed sufficiently negative as the mean V0.5 value with 200 μM Ca2+ is ≥ 50 mV even in the Ca2+ bowl-defective channel studied (Δ854-855). At these voltages, intracellular Mg2+, whose stimulatory effect requires VSD activation30, does not increase open probability (Supplementary Figure 2). The values of the remaining HA model parameters were taken from Horrigan et al37 developed for the wild-type Slo1 channel. The simulated GV curves were shifted by along the voltage axis by 35 mV to match the V0.5 value of the Ca2+ bowl-mutant channel. Because detailed information about the KD value for H+ of the RCK1 sensor is unavailable, the ligand sensor KD value for H+ in the HA model was set to 0.35 μM25. Simulations using the HA model were performed with IgorPro.
The results are presented as mean ± SEM (n), where n is the number of independent measurements. Means of two groups were compared using Student’s t-test or paired Student’s t-test. When appropriate, the results of multi-mean comparisons were corrected using the Bonferroni method. The differences were considered significant when P values were < 0.05. Statistical tests were performed using IgorPro or DataDesk (DataDescription, Ithaca, NY). The equation fit parameter values are presented as mean ± 95% confidence interval as implemented in IgorPro.
Solutions
The external solution contained (in mM): 140 KCl, 2 MgCl2, 10 HEPES, pH 7.2 with N-methyl-D-glucamine (NMDG). The internal solution with pHi = 7.5 and 0 μM Ca2+ contained (in mM): 140 KCl, 11 EDTA, 0.02 crown-ether(+)-18-crown-6-tetra-carboxylic acid (18C6TCA)40, 10 HEPES, pH = 7.5 with NMDG. The internal solution with pHi = 6.2 and 0 μM Ca2+ was made by substituting 10 mM HEPES with 10 mM MES. The internal solution with pHi = 7.5 and 1 μM Ca2+ contained (in mM): 140 KCl, 3.7 HEDTA, 3.7 CaCl2, 10 HEPES, pH 7.5 with NMDG. The internal solution with pHi = 7.7 and 10 μM Ca2+ was made with 9 mM CaCl2. The internal solution with pHi = 7.5 and 6 mM Mg2+ contained (in mM): 140 KCl, 11 EGTA, 6 MgCl2, 0.02 18C6TCA, 10 HEPES, pH = 7.5 with NMDG. The solution with 200 μM Ca2+ did not contain any EGTA or EDTA.
Supplementary Material
Acknowledgments
The study was supported in part by NIH, TMWFK (PE114-1) and DFG (HE 2993/8).
Abbreviations
- VSD
voltage-sensor domain
- RCK
regulator of conductance for K+
- GV
conductance-voltage
- IV
current-voltage
- Po
open probability
Footnotes
Conflicts of interest: The authors declare no conflict of interest.
References
- 1.Magleby KL. Gating mechanism of BK (Slo1) channels: so near, yet so far. J Gen Physiol. 2003;121:81–96. doi: 10.1085/jgp.20028721. [DOI] [PMC free article] [PubMed] [Google Scholar]
- 2.Rothberg BS. Allosteric modulation of ion channels: the case of maxi-K. Sci STKE 2004. 2004:pe16. doi: 10.1126/stke.2272004pe16. [DOI] [PubMed] [Google Scholar]
- 3.Jan LY, Jan YN. Ways and means for left shifts in the MaxiK channel. Proc Natl Acad Sci U S A. 1997;94:13383–5. doi: 10.1073/pnas.94.25.13383. [DOI] [PMC free article] [PubMed] [Google Scholar]
- 4.Horrigan FT, Aldrich RW. Allosteric voltage gating of potassium channels II. mslo channel gating charge movement in the absence of Ca2+ J Gen Physiol. 1999;114:305–36. doi: 10.1085/jgp.114.2.305. [DOI] [PMC free article] [PubMed] [Google Scholar]
- 5.Horrigan FT, Aldrich RW. Coupling between voltage sensor activation, Ca2+ binding and channel opening in large conductance (BK) potassium channels. J Gen Physiol. 2002;120:267–305. doi: 10.1085/jgp.20028605. [DOI] [PMC free article] [PubMed] [Google Scholar]
- 6.Rothberg BS, Magleby KL. Gating kinetics of single large-conductance Ca2+-activated K+ channels in high Ca2+ suggest a two-tiered allosteric gating mechanism. J Gen Physiol. 1999;114:93–124. doi: 10.1085/jgp.114.1.93. [DOI] [PMC free article] [PubMed] [Google Scholar]
- 7.Kaczorowski GJ, Knaus HG, Leonard RJ, McManus OB, Garcia ML. High-conductance calcium-activated potassium channels; structure, pharmacology, and function. J Bioenerg Biomembr. 1996;28:255–67. doi: 10.1007/BF02110699. [DOI] [PubMed] [Google Scholar]
- 8.Salkoff L, Butler A, Ferreira G, Santi C, Wei A. High-conductance potassium channels of the SLO family. Nat Rev Neurosci. 2006;7:921–31. doi: 10.1038/nrn1992. [DOI] [PubMed] [Google Scholar]
- 9.Du W, Bautista JF, Yang H, Diez-Sampedro A, You SA, Wang L, et al. Calcium-sensitive potassium channelopathy in human epilepsy and paroxysmal movement disorder. Nat Genet. 2005;37:733–8. doi: 10.1038/ng1585. [DOI] [PubMed] [Google Scholar]
- 10.Seibold MA, Wang B, Eng C, Kumar G, Beckman KB, Sen S, et al. An African-specific functional polymorphism in KCNMB1 shows sex-specific association with asthma severity. Hum Mol Genet. 2008 doi: 10.1093/hmg/ddn168. [DOI] [PMC free article] [PubMed] [Google Scholar]
- 11.Wang B, Rothberg BS, Brenner R. Mechanism of increased BK channel activation from a channel mutation that causes epilepsy. J Gen Physiol. 2009;133:283–94. doi: 10.1085/jgp.200810141. [DOI] [PMC free article] [PubMed] [Google Scholar]
- 12.Shen KZ, Lagrutta A, Davies NW, Standen NB, Adelman JP, North RA. Tetraethylammonium block of Slowpoke calcium-activated potassium channels expressed in Xenopus oocytes: evidence for tetrameric channel formation. Pflügers Archiv. 1994;426:440–5. doi: 10.1007/BF00388308. [DOI] [PubMed] [Google Scholar]
- 13.Ma Z, Lou XJ, Horrigan FT. Role of charged residues in the S1-S4 voltage sensor of BK channels. J Gen Physiol. 2006;127:309–28. doi: 10.1085/jgp.200509421. [DOI] [PMC free article] [PubMed] [Google Scholar]
- 14.Jiang Y, Pico A, Cadene M, Chait BT, MacKinnon R. Structure of the RCK domain from the E. coli K+ channel and demonstration of its presence in the human BK channel. Neuron. 2001;29:593–601. doi: 10.1016/s0896-6273(01)00236-7. [DOI] [PubMed] [Google Scholar]
- 15.Yusifov T, Savalli N, Gandhi CS, Ottolia M, Olcese R. The RCK2 domain of the human BKCa channel is a calcium sensor. Proc Natl Acad Sci U S A. 2008;105:376–81. doi: 10.1073/pnas.0705261105. [DOI] [PMC free article] [PubMed] [Google Scholar]
- 16.Jiang Y, Lee A, Chen J, Cadene M, Chait BT, MacKinnon R. Crystal structure and mechanism of a calcium-gated potassium channel. Nature. 2002;417:515–22. doi: 10.1038/417515a. [DOI] [PubMed] [Google Scholar]
- 17.Shi J, Krishnamoorthy G, Yang Y, Hu L, Chaturvedi N, Harilal D, et al. Mechanism of magnesium activation of calcium-activated potassium channels. Nature. 2002;418:876–80. doi: 10.1038/nature00941. [DOI] [PubMed] [Google Scholar]
- 18.Xia XM, Zeng X, Lingle CJ. Multiple regulatory sites in large-conductance calcium-activated potassium channels. Nature. 2002;418:880–4. doi: 10.1038/nature00956. [DOI] [PubMed] [Google Scholar]
- 19.Zeng XH, Xia XM, Lingle CJ. Divalent cation sensitivity of BK channel activation supports the existence of three distinct binding sites. J Gen Physiol. 2005;125:273–86. doi: 10.1085/jgp.200409239. [DOI] [PMC free article] [PubMed] [Google Scholar]
- 20.Schreiber M, Salkoff L. A novel calcium-sensing domain in the BK channel. Biophys J. 1997;73:1355–63. doi: 10.1016/S0006-3495(97)78168-2. [DOI] [PMC free article] [PubMed] [Google Scholar]
- 21.Sweet TB, Cox DH. Measurements of the BKCa channel’s high-affinity Ca2+ binding constants: effects of membrane voltage. J Gen Physiol. 2008;132:491–505. doi: 10.1085/jgp.200810094. [DOI] [PMC free article] [PubMed] [Google Scholar]
- 22.Hou S, Xu R, Heinemann SH, Hoshi T. Reciprocal regulation of the Ca2+ and H+ sensitivity in the SLO1 BK channel conferred by the RCK1 domain. Nat Struct Mol Biol. 2008;15:403–10. doi: 10.1038/nsmb.1398. [DOI] [PMC free article] [PubMed] [Google Scholar]
- 23.Silver IA, Erecinska M. Intracellular and extracellular changes of [Ca2+] in hypoxia and ischemia in rat brain in vivo. J Gen Physiol. 1990;95:837–66. doi: 10.1085/jgp.95.5.837. [DOI] [PMC free article] [PubMed] [Google Scholar]
- 24.Murphy E, Steenbergen C. Ion transport and energetics during cell death and protection. Physiology (Bethesda) 2008;23:115–23. doi: 10.1152/physiol.00044.2007. [DOI] [PMC free article] [PubMed] [Google Scholar]
- 25.Avdonin V, Tang XD, Hoshi T. Stimulatory action of internal protons on Slo1 BK channels. Biophys J. 2003;84:2969–80. doi: 10.1016/S0006-3495(03)70023-X. [DOI] [PMC free article] [PubMed] [Google Scholar]
- 26.Hou S, Xu R, Heinemann SH, Hoshi T. The RCK1 high-affinity Ca2+ sensor confers carbon monoxide sensitivity to Slo1 BK channels. Proc Natl Acad Sci U S A. 2008;105:4039–43. doi: 10.1073/pnas.0800304105. [DOI] [PMC free article] [PubMed] [Google Scholar]
- 27.Qian X, Niu X, Magleby KL. Intra- and intersubunit cooperativity in activation of BK channels by Ca2+ J Gen Physiol. 2006;128:389–404. doi: 10.1085/jgp.200609486. [DOI] [PMC free article] [PubMed] [Google Scholar]
- 28.Piskorowski R, Aldrich RW. Calcium activation of BKCa potassium channels lacking the calcium bowl and RCK domains. Nature. 2002;420:499–502. doi: 10.1038/nature01199. [DOI] [PubMed] [Google Scholar]
- 29.Yang H, Hu L, Shi J, Delaloye K, Horrigan FT, Cui J. Mg2+ mediates interaction between the voltage sensor and cytosolic domain to activate BK channels. Proc Natl Acad Sci U S A. 2007;104:18270–5. doi: 10.1073/pnas.0705873104. [DOI] [PMC free article] [PubMed] [Google Scholar]
- 30.Horrigan FT, Ma Z. Mg2+ enhances voltage sensor/gate coupling in BK channels. J Gen Physiol. 2008;131:13–32. doi: 10.1085/jgp.200709877. [DOI] [PMC free article] [PubMed] [Google Scholar]
- 31.Lee KK, Fitch CA, Garcia-Moreno EB. Distance dependence and salt sensitivity of pairwise, coulombic interactions in a protein. Protein Sci. 2002;11:1004–16. doi: 10.1110/ps.4700102. [DOI] [PMC free article] [PubMed] [Google Scholar]
- 32.Lipton P. Ischemic cell death in brain neurons. Physiol Rev. 1999;79:1431–568. doi: 10.1152/physrev.1999.79.4.1431. [DOI] [PubMed] [Google Scholar]
- 33.Storm JF. Action potential repolarization and a fast after-hyperpolarization in rat hippocampal pyramidal cells. J Physiol (Lond) 1987;385:733–59. doi: 10.1113/jphysiol.1987.sp016517. [DOI] [PMC free article] [PubMed] [Google Scholar]
- 34.Nelson MT, Cheng H, Rubart M, Santana LF, Bonev AD, Knot HJ, et al. Relaxation of arterial smooth muscle by calcium sparks. Science. 1995;270:633–7. doi: 10.1126/science.270.5236.633. [DOI] [PubMed] [Google Scholar]
- 35.Shao LR, Halvorsrud R, Borg-Graham L, Storm JF. The role of BK-type Ca2+-dependent K+ channels in spike broadening during repetitive firing in rat hippocampal pyramidal cells. J Physiol (Lond) 1999;521:135–46. doi: 10.1111/j.1469-7793.1999.00135.x. [DOI] [PMC free article] [PubMed] [Google Scholar]
- 36.Tombaugh GC. Intracellular pH buffering shapes activity-dependent Ca2+ dynamics in dendrites of CA1 interneurons. J Neurophysiol. 1998;80:1702–12. doi: 10.1152/jn.1998.80.4.1702. [DOI] [PubMed] [Google Scholar]
- 37.Horrigan FT, Heinemann SH, Hoshi T. Heme regulates allosteric activation of the Slo1 BK channel. J Gen Physiol. 2005;126:7–21. doi: 10.1085/jgp.200509262. [DOI] [PMC free article] [PubMed] [Google Scholar]
- 38.Tang XD, Daggett H, Hanner M, Garcia ML, McManus OB, Brot N, et al. Oxidative regulation of large conductance calcium-activated potassium channels. J Gen Physiol. 2001;117:253–74. doi: 10.1085/jgp.117.3.253. [DOI] [PMC free article] [PubMed] [Google Scholar]
- 39.Avdonin V, Hoshi T. Modification of voltage-dependent gating of potassium channels by free form of tryptophan side chain. Biophys J. 2001;81:97–106. doi: 10.1016/S0006-3495(01)75683-4. [DOI] [PMC free article] [PubMed] [Google Scholar]
- 40.Neyton J. A Ba2+ chelator suppresses long shut events in fully activated high-conductance Ca2+-dependent K+ channels. Biophys J. 1996;71:220–6. doi: 10.1016/S0006-3495(96)79218-4. [DOI] [PMC free article] [PubMed] [Google Scholar]
Associated Data
This section collects any data citations, data availability statements, or supplementary materials included in this article.