

Abstract
In neocortex, the induction and expression of long-term potentiation (LTP) and long-term depression (LTD) vary depending on cortical area and laminae of presynaptic and postsynaptic neurons. Layer 4 (L4) is the initial site of sensory afference in barrel cortex and primary visual cortex (V1) in which excitatory inputs from thalamus, L6, and neighboring L4 cells are integrated. However, little is known about plasticity within L4. We studied plasticity at excitatory synaptic connections between pairs and triplets of interconnected L4 neurons in guinea pig V1 using a fixed delay pairing protocol. Plasticity outcomes were heterogeneous, with some connections undergoing LTP (n = 7 of 42), some LTD (n = 19 of 42), and some not changing (n = 16 of 42). Although quantal analysis revealed both presynaptic and postsynaptic plasticity expression components, reduction in quantal size (a postsynaptic property) contributing to LTD was ubiquitous, whereas in some cell pairs, this change was overridden by an increase in the probability of neurotransmitter release (a presynaptic property) resulting in LTP. These changes depended on the initial reliability of the connections: highly reliable connections depressed with contributions from presynaptic and postsynaptic effects, and unreliable connections potentiated as a result of the predominance of presynaptic enhancement. Interestingly, very strong, reliable pairs of connected cells showed little plasticity. Pairs of connected cells with a common presynaptic or postsynaptic L4 cell behaved independently, undergoing plasticity of different or opposite signs. Release probability of a connection with initial 100% failure rate was enhanced after pairing, potentially avoiding silencing of the presynaptic terminal and maintaining L4–L4 synapses in a broader dynamic range.
Introduction
Synaptic plasticity in mammalian neocortex contributes to important functions, including sensory map reorganization and refinement during development (Miller et al., 1989; Shatz, 1990; Kirkwood et al., 1995), functional reorganization after imbalanced or impoverished early sensory experience (Wiesel and Hubel, 1963; Dews and Wiesel, 1970; Chapman et al., 1986; Kind et al., 2002) or injury (Kaas et al., 1990; Gilbert and Wiesel, 1992; Chino et al., 2001), and perceptual learning (Schoups et al., 2001; Supèr et al., 2001; Li et al., 2008). These changes in functional cortical circuitry often manifest as persistent upregulation or downregulation of synaptic strength (Crozier et al., 2007; Smith et al., 2009). Such plasticity occurs between and within most cortical layers (Egger et al., 1999; Heynen and Bear, 2001; Sjöström et al., 2001; Ismailov et al., 2004; Hardingham et al., 2007; Liu et al., 2008). It is important to understand these processes at the earliest site of sensory processing within cortex, layer 4 (L4). L4 neurons integrate excitatory input from the thalamus, L6, and neighboring L4 neurons (Ahmed et al., 1994; Tarczy-Hornoch et al., 1999; Bannister et al., 2002). Although the thalamocortical pathway has been extensively studied (Feldman et al., 1999; Heynen and Bear, 2001), there are few reports regarding capacity for plasticity of intracortical synapses within L4 (Egger et al., 1999). This represents a substantial gap in understanding cortical processing, particularly in light of the numerical preponderance of these types of synaptic connections onto L4 cells (Ahmed et al., 1994; Peters et al., 1994; Binzegger et al., 2004).
In barrel cortex, L4–L4 synaptic connections only undergo long-term depression (LTD) in response to coincident presynaptic and postsynaptic activation (Egger et al., 1999), even at temporal delays usually associated with the induction of long-term potentiation (LTP) according to spike-timing-dependent plasticity (STDP) rules (Bi and Poo, 1998; Dan and Poo, 2004). In visual cortex, the amplitude of unitary L4–L4 synaptic connections is increased after monocular deprivation (Maffei et al., 2004), but LTP of individual L4–L4 connections has not been reported. Interestingly, L4–L4 excitatory synapses in visual cortex have a wider range of baseline strengths than in barrel cortex, including very weak, unreliable connections (Sáez and Friedlander, 2009). Thus, if as suggested, the initial state of the synapse contributes to the plasticity response (Larkman et al., 1992; Bi and Poo, 1998; Montgomery et al., 2001; Ward et al., 2006; Hardingham et al., 2007), L4–L4 connections may have a wider operating range and capacity for plasticity than realized previously. To evaluate this hypothesis, we recorded from pairs and triplet sets of synaptically connected L4 neurons to eliminate contamination by other excitatory (Stratford et al., 1996; Tarczy-Hornoch et al., 1999) and neuromodulatory (Bear and Singer, 1986; Seol et al., 2007) inputs. We found that the plasticity outcome between L4 excitatory cells is a function of the initial state of the synapses, uniformly exhibiting a reduction in quantal size postsynaptically that is sometimes overridden by presynaptic changes, resulting in a more dynamic excitatory synaptic network within L4.
Materials and Methods
Slice preparation.
All experiments were performed according to guidelines by the Institutional Animal Care and Use Committees of Baylor College of Medicine. Tricolor guinea pigs, aged postnatal days 6–14 were deeply anesthetized with a mixture of 0.85 mg/kg ketamine and 0.15 mg/kg xylazine and decapitated. The brain was rapidly removed and cooled for at least 90 s in artificial CSF (aCSF) containing 124 mm NaCl, 2 mm KCl, 2 mm MgSO4, 2 mm CaCl2, 1.25 mm KH2PO4, 26 mm NaHCO3, and 11 mm dextrose, saturated with 95% O2/5% CO2 to a final pH of 7.4. Coronal slices of the visual cortex were cut at 300 μm with a Vibratome 1000 Plus (Technical Products International). Slices were incubated at 33–35°C for 45–60 min in a holding chamber in a heated water bath (Fisher Scientific), transferred to a room temperature bath until being transferred to a submerged recording chamber (Warner Instruments), and perfused continuously at 2–3 ml/min with oxygenated aCSF at 32–34°C. Neurons were visualized with a Zeiss upright microscope (Axioskope FS1) equipped with an Achroplan 40×, 0.8 numerical aperture water-immersion lens set up for differential interference contrast (DIC) microscopy.
Glass micropipettes [Corning 7056 glass (1.5 mm outer diameter, 1.12 mm inner diameter); A-M Systems] were pulled on a vertical puller (PP-830; Narishige) to an open tip resistance of 2.5–4.0 MΩ and filled with a pipette solution containing the following (in mm): 115 K-gluconate, 20 KCl, 10 HEPES, 4 NaCl, 4 Mg-ATP, 0.3 Na-GTP, and 4 phosphocreatine-Na, with the pH adjusted to 7.4 by KOH. Osmolarity was adjusted to 280–290 mOsm with mannitol.
Electrophysiology.
All recordings were made with two MultiClamp 700B amplifiers (Molecular Devices), and signals were digitized at 20 kHz with a Digidata digitizer 1440A and recorded using Clampex 9 or 10 software (Molecular Devices). Recordings were filtered online at 4 kHz with a four-pole Bessel low-pass filter. Layer 4 was identified under light and DIC microscopy based on its differential opacity to transmitted light and the smaller size of L4 somata compared with L5 cells. Cells with membrane potentials more positive than −60 mV and recordings with high access resistance (>40 MΩ or >20% the value of the input resistance for that cell) were discarded. The intrinsic firing properties of the patched cell were tested by injecting a 100 ms depolarizing current pulse; neurons that did not exhibit regular spiking typical of excitatory cells (McCormick et al., 1985) were considered as putative inhibitory neurons and discarded. Up to four cells were patched simultaneously. After a pair of cells were patch clamped, one of them was held under current clamp, and pairs of action potentials (APs) were elicited with a 30 ms interspike interval with two 5 ms square-pulse depolarizing current injections (typically 300–800 pA) at 0.2 Hz. The putative postsynaptic cell was held under voltage clamp at −70 mV. If an EPSC response was not apparent immediately, at least 50 trials were collected, spike-trigger-averaged and phase locked to the peak of the action potential in the putative presynaptic cell and examined again. If a response was detected, data collection proceeded for at least 10 min (120 trials). If no response was observed, the configuration was reversed with the original putative postsynaptic cell tested for input to the original putative presynaptic cell. If a response was not observed in either direction, the cells were considered not connected and a third cell was patched and examined as a potential presynaptic and postsynaptic partner to the other two. If necessary, a fourth cell was patched. Occasionally, synaptic connections between multiple cells were found and simultaneously (if possible) or sequentially recorded. Connections were analyzed offline by placing a 0.4 ms window (noise measurement) in the postsynaptic current trace 2–3 ms before the action potential onset in the presynaptic channel and a second window, time locked to the first one, around the peak of the average unitary EPSC response (uEPSC). Latency was measured from the AP peak to the onset of the average uEPSC trace as defined by 10% of the rise time to uEPSC peak. Failure rate was estimated using quantal analysis methods (see below). Analyses were performed in Clampfit (Molecular Devices), Igor Pro (Wavemetrics), and R 2.71 (R Development Core Team; Foundation for Statistical Computing).
Access resistance was monitored during the experiment; cells in which Ra changed by more than ± 20% were discarded from the analysis. As an additional stability requirement, the prepairing time series was fitted with a linear fit. Experiments with an unstable baseline in which significant trends were obtained with a linear fit (p < 0.05) were discarded. After the prepairing epoch was complete (120 stimuli at 0.2 Hz), we used a pairing protocol for plasticity induction. The postsynaptic cell was switched from voltage to current clamp and a square current pulse was injected to produce a train of APs (typically 6–9 APs, mean of 7.85 ± 1.6) 10 ms before the onset of the presynaptic stimulation (a 5 ms square pulse to trigger a single AP. This pairing was repeated 60 times at 0.1 Hz, after which the postsynaptic recording was switched back to voltage clamp, and testing of the connection resumed for an average of 17 min (± 5.5). To estimate changes in synaptic parameters [average uEPSC amplitude including failures (strength) and excluding failures (potency) and failure rate] after pairing, the following formula was used: Xpost − Xpre/Xpost + Xpre, where X is the analyzed parameter during the prepairing (Xpre) or postpairing (Xpost) epochs. We selected this method because it normalizes changes and avoids giving excessive weights to small or large connections, which would become predominant if percentage or absolute changes were used, respectively. This difference was referred to as the normalized difference ΔN. The plasticity outcome of unitary connections after pairing was classified as LTP or LTD if we observed a statistically significant increase or decrease, respectively, in strength after pairing (Wilcoxon's test, α < 0.05). Because the distribution of uEPSC peak measurements for the majority of connections was multimodal and typically did not conform to a Gaussian distribution, we used a Wilcoxon's test whenever prepairing and postpairing conditions were compared. Connections that did not reach statistical significance were classified as no change (NC).
Wilcoxon's test was also applied throughout the study, as most data sets analyzed did not conform to a normal distribution (p < 0.05, Shapiro-Wilks). Throughout the text, values are reported as mean ± SD; error bars in figures correspond to SEM. For comparison of plasticity outcomes between pairs with a common presynaptic cell (supplemental Fig. 2, available at www.jneurosci.org as supplemental material), the differences in ΔN strength, potency, and failure rate between pair of connections in a divergent triplet or a similar sample size of pairs of unrelated connections from our database (n = 42) were selected and compared. This test was repeated 1000 times, and the cumulative distribution of the obtained significance values (p) was recorded. If >50% of the comparisons showed a significant difference (p < 0.05), we concluded that the difference in plasticity outcomes between pairs with a common presynaptic cell was lower (or greater, as the case may be) than between any two L4 connections that do not share a common partner.
Quantal analysis.
Unbiased quantal analysis methods were used to analyze the uEPSCs evoked by the first action potential. Collection of great number of data points for analysis is preferable in quantal analysis (Kullmann, 1989; Stricker and Redman, 2003), but we chose a limited numbers of trials (125 ± 28.5 trials before pairing and 201.7 ± 65.4 trials after pairing) over an average 37 min recording period as a compromise between quantal analysis requirements and the potential untoward effects associated with longer recordings (i.e., cell health and recording stability and possible intracellular factor washout), which can affect the plasticity signaling cascades of neurons (Kato et al., 1993; Eder et al., 2002; Ismailov et al., 2004). A full account of the analysis methods used in this study has been described in others' studies (Stricker and Redman, 2003; Cowan and Stricker, 2004). Briefly, both the noise and uEPSC measurements were converted into probability density functions (PDFs) using a Gaussian kernel estimator by convolving each measurement with a normal distribution. The noise PDF, which is frequently skewed presumably attributable to contamination of the measurement by spontaneous currents, was fit by two Gaussian distributions by using an expectation-maximization (EM) algorithm. The resulting fit was considered as a “model peak,” which accounts for intracellular and experimental noise. The average noise SD across experiments was 1.53 pA. Following current models of synaptic transmission in the cortex, the observed uEPSC response distribution was assumed to be attributable to a real fluctuation of the response between a number of possible discrete amplitudes (attributable to probabilistic release at an unknown number of release sites) superimposed with recording and intracellular noise. We therefore sought to determine the optimal number of underlying discrete amplitudes that account for the observed distribution. This was achieved first by sequentially fitting an increasing number K of different model peaks using an EM algorithm. Increasing the number of peaks increases the likelihood of the fit at the cost of introducing additional degrees of freedom in the model. Because we sought to obtain the minimal number of peaks that correctly fit the observed distribution without introducing unnecessary complexity, we compared the different models in pairs to determine whether the fits were significantly different using a Wilks statistic computed from the log-likelihoods of the H0 (the model with the lower number of peaks) and H1 models:
 |
Thus, the log-likelihoods together with the difference in degrees of freedom provide the basis for statistical comparison of the competing models. Because this is a non-nested comparison between mixture models with different number of peaks, the Wilks statistic is not asymptotically distributed as a χ2 random variable, so we performed Monte Carlo simulations to generate its distribution. By comparing pairs of models, eventually an optimal model of peaks is obtained. This initial fit was the unconstrained model, because no restrictions were imposed on the locations or weights of the peaks. Once this optimal K was obtained, a quantal model (in which the peaks are forced to be equally distanced by a separation Q, corresponding to the quantal content of a synaptic vesicle) was fit to the uEPSC PDF and compared with the unconstrained model. Typically, the compared quantal and unconstrained models had a similar number of peaks, and the comparison could be handled with a χ2 test instead of a Monte Carlo simulation. If H0 could not be rejected, a quantal model was assumed. Finally, a third model was tested in which the release sites mediating the connection were assumed to be independent and have the same release probability p (binomial model). Because no valid estimates could be made about the real number of release sites mediating connections with a failure rate of 0, these were not fitted to a binomial model. Again, a Monte Carlo simulation was used to obtain the distribution of the Wilks statistic. In this way, every analyzed synaptic connection was assigned to one of three models (unconstrained, quantal, or binomial), and a different number of synaptic parameters were extracted depending on the model: number of peaks, failure rate, quantal size Q (for quantal and binomial connections), and release probability p (for binomial connections). The proportion of connections optimally fit by fully unconstrained/quantal/binomial models in the prepairing condition was 9 of 42, 14 of 42, and 19 of 42, respectively.
Results
Database
We analyzed the plasticity outcomes in response to a Hebbian pairing protocol between pairs of L4 excitatory cells (n = 42). To gain additional insights into the locus of synaptic plasticity, we applied quantal analysis. In a subset of experiments, we recorded simultaneous responses of multiple cells (n = 7) that shared a common presynaptic (n = 4) or postsynaptic (n = 3) element.
Example recording and analysis
To identify unitary L4–L4 synaptic connections, we recorded from up to four adjacent L4 excitatory cells (Fig. 1A) simultaneously and tested for possible synaptic connections between all possible pairs of cells (Sáez and Friedlander, 2009). When a functional excitatory synaptic connection between a pair of cells was identified (see Materials and Methods), we recorded the prepairing baseline (uEPSCs evoked by pairs of presynaptic APs (with a 30 ms interspike interval) for at least 10 min. Figure 1C shows 30 consecutively recorded responses (top, black traces) and the average of all recorded responses (middle, black trace) in response to two presynaptic APs (bottom trace) during the prepairing condition from an example cell pair. After switching the postsynaptic recording to current clamp to permit spiking during pairing, we applied the pairing protocol with a single presynaptic spike after the beginning of the induced postsynaptic train of APs at −10 ms (Fig. 1B). After the pairing, the postsynaptic recording condition was returned to voltage clamp, and the postpairing uEPSCs were recorded in response to the two presynaptic APs. Thirty individual postpairing responses are shown in Figure 1D (top black traces), and the average of all the postpairing responses are shown in red (middle trace). In this particular example, the connection underwent LTD (from 4.5 ± 5.1 to 2.4 ± 3.1 pA; p < 0.001, Wilcoxon's test). The superimposed prepairing (black) and postpairing (red) averaged traces are shown as an inset in Figure 1B. The distributions of the recorded peak amplitudes of the uEPSCs in the prepairing and postpairing conditions were converted to PDFs (Fig. 1E) using density estimation; subsequently, the optimal synaptic transmission model was chosen among unconstrained, quantal, and binomial alternatives (see Materials and Methods). For this particular connection, a quantal transmission model best described both the prepairing data (Fig. 1F, black; number of release sites, N = 3; quantal size, Q = 4.91 pA) and the postpairing data (Fig. 1F, red; N = 2, Q = 3.6 pA). The time plot of the peak amplitudes of the uEPSCs over the 42 min course of the experiment is shown in Figure 1G, with the pairing epoch represented as a 10 min gap. Failures of synaptic transmission are shown as open circles; successful synaptic transmission events are shown as filled circles. The gray horizontal lines indicate the average uEPSC peak amplitude for the prepairing and postpairing epochs; the dotted line indicates baseline (0 pA).
Figure 1.
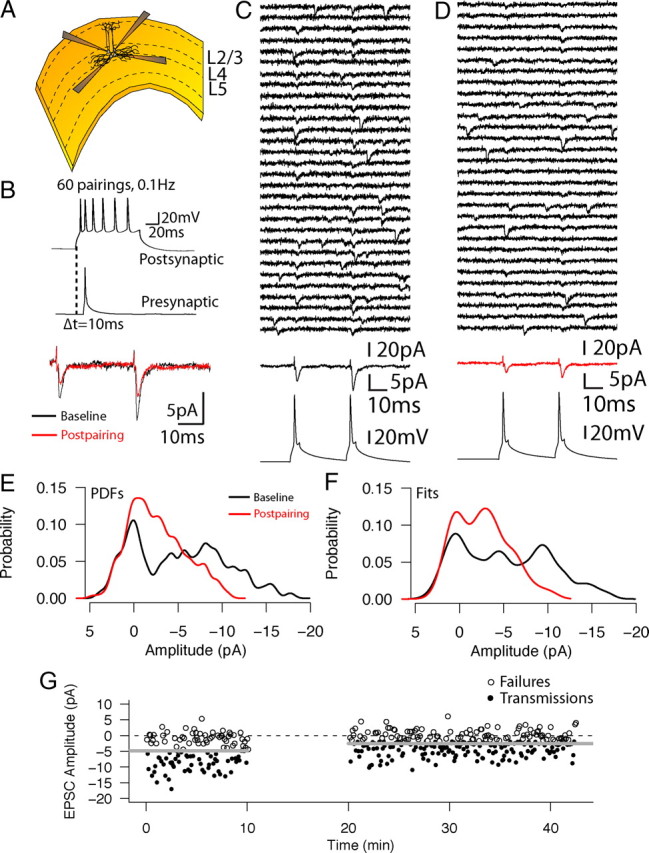
Example single-cell stimulation pairing experiment. A, Diagram depicting the multiple patch-clamp configuration. Up to four adjacent cells were patched within the boundaries of L4. B, Top, Pairing protocol. A single presynaptic AP was elicited 10 ms after the onset of a depolarizing pulse that led to a postsynaptic burst of six to nine APs; the pairing was repeated 60 times at 0.1 Hz. Bottom, Averaged prepairing (black) and postpairing (red) traces from an example experiment. In this particular example, the unitary EPSC in response to the first action potential depressed from an average peak amplitude strength of 4.47 ± 5.07 to 2.42 ± 3.1 pA (the averaged response includes all trials, including when failures of transmission occurred; p < 0.01, Wilcoxon's test). C, Example traces of prepairing individual sequential trials of uEPSCs recorded from the postsynaptic cell in response to paired action potential stimulation of the presynaptic cell; 30 consecutive individual trials (top) and the averaged response for all 120 recorded traces (middle) are aligned to the first presynaptic action potential peak (bottom). D, Same as C, for the postpairing condition. The averaged response for 280 postpairing traces is shown as a red trace (middle). E, PDFs for the prepairing (black trace) and postpairing (red trace) conditions. F, Model fits for the prepairing (black trace) and postpairing (red trace) conditions. This connection was optimally fit by a quantal model in both conditions (prepairing number of release sites, N = 3 and quantal size, Q = 4.91 pA; postpairing, N = 2, Q = 3.6 pA). G, Time plot of peak amplitudes for all recorded trials for the connection. Horizontal gray lines indicate the average uEPSC peak amplitude before and after pairing. Horizontal dotted line indicates the 0 pA level. Synaptic failures are shown as open circles, and successful synaptic transmission events are shown as filled circles. Pairing epoch is shown as a 10 min gap.
Examples of different pairing outcomes
The pairing protocol resulted in variable plasticity outcomes among cell pairs tested. Figure 2 shows records from three example cell pairs exhibiting LTP (A1–A3), LTD (B1–B3), and no significant change (NC) (C1–C3), respectively. For each of these three cell pairs, the time plots (A1–C1), prepairing (black) and postpairing (red) PDFs (A2–C2), average traces before (black) and after (red) (A2–C2, insets) pairing, and prepairing and postpairing values for uEPSCs, including average strength (the average of all trials), average potency (the average excluding the trials with failures), and failure rates are shown (A3–C3). In these examples, the connection strength of the cell pair that underwent LTP increased significantly (from 12.7 ± 7.3 to 19.8 ± 6.0 pA; p < 0.001, Wilcoxon's test) (Fig. 2A1–A3). This increase in strength was accompanied by an increase in potency (from 13.6 ± 6.5 to 20.2 ± 5.4 pA; p < 0.001, Wilcoxon's test) and a decrease in failure rate (from 17 to 2%) (Fig. 2A3). For the cell pair that underwent LTD, the connection strength decreased significantly (from 13.8 ± 5.3 to 7.9 ± 5.4 pA; p < 0.001, Wilcoxon's test) (Fig. 2B1–B3). This change was accompanied by a decrease in potency (from 14.0 ± 4.9 to 8.5 ± 5.0 pA; p < 0.001, Wilcoxon's test) and an increase in failure rate (from 2 to 9%) (Fig. 2B3). The failure rate of the cell pair whose strength did not change (Fig. 2C1–C3) was unaffected by pairing: 0% during the prepairing and postpairing periods. Because the connection never failed, strength and potency values were equal and also did not change after pairing (20.8 ± 6.1 to 20.3 ± 6.3 pA; p = 0.79, Wilcoxon's test) (Fig. 2C3). The failure rate for a given connection and epoch is a single scalar value not amenable to statistical analysis.
Figure 2.

Recordings from three example L4–L4 cell pairs demonstrating that responses to pairing are heterogeneous. Examples of connections that underwent LTP (A1–A3), LTD (B1–B3), or NC (C1–C3) in response to the pairing. A1–C1, Time plots for each of the three example cell pairs. Horizontal gray lines indicate the average uEPSC peak amplitude before and after pairing. Horizontal dotted line indicates the 0 pA level. Synaptic failures are shown as open circles, and successful synaptic transmission events are shown as filled circles. Pairing epoch is shown as a 10 min gap. A2–C2, PDFs for the prepairing (black trace) and postpairing (red trace) conditions. Insets show the average of all recorded traces before (black) and after (red) pairing. A3–C3, Bar plots showing the strength, potency, and failure rate values for the prepairing (black bars) and postpairing (red bars) conditions. Failure rates are single scalar values so no error bars or statistical comparisons are shown; for strength and potency, error bars indicate SEM. ***p < 0.001, significant changes after pairing (Wilcoxon's test).
Effects of pairing on synaptic transmission parameters for individual cell pairs
Histograms of the distributions of changes in synaptic strength, potency, and failure rate for the entire sample of cell pairs tested (n = 42) are plotted in Figure 3, A, B, and C, respectively (LTD, blue; NC, gray; LTP, red). Because there was a large range of baseline values for these parameters (0.3–81.5 pA, 3.0–81.5 pA, and 0–95% for strength, potency, and failure rate during baseline prepairing conditions, respectively), comparisons of parameters in the prepairing versus the postpairing epochs were normalized (referred to throughout the text as ΔN; see Materials and Methods) (supplemental Fig. 1, available at www.jneurosci.org as supplemental material). The criterion for LTP and LTD was set at a statistical significance level of p < 0.05 for an increase and decrease for average synaptic strength, respectively, in the prepairing versus the postpairing condition. LTD was the most prevalent outcome (19 of 42, or 45.2% of tested pairs), with NC (16 of 42, or 38.1% of tested pairs) and LTP (7 of 42, or 16.7 of tested pairs) occurring less often. The distribution of outcomes based on changes in normalized strength is summarized in Figure 3A. The distributions of the changes in potency and failure rate are illustrated in Figure 3, B and C, respectively. The changes in all three parameters plotted for each cell pair are shown in Figure 3D, where each group of three bars corresponds to the normalized change in strength (black), potency (gray), and failure rate (white) for a given cell pair. Cell pairs are sorted left to right by group from the lowest to the greatest ΔN. The lines below the bar plot indicate the grouping of pairs by outcome group (LTP, NC, and LTD).
Figure 3.
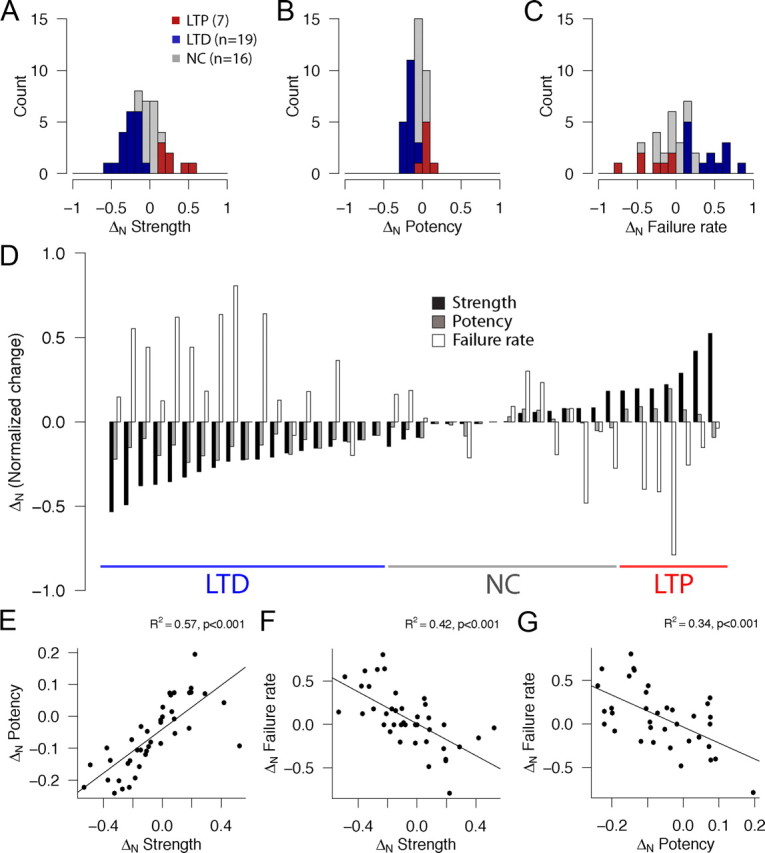
Pairing-induced changes in synaptic strength, potency, and failure rate. A–C, Histograms showing the distribution of normalized (ΔN = Xpost− Xpre/Xpost + Xpre) changes in average uEPSC peak amplitude including (A, strength) and excluding (B, potency) failures and failure rate (C). Connections that showed LTP (as defined by an increase in normalized strength change, +ΔN strength, p < 0.05, Wilcoxon's test) are shown in red, those that showed LTD (−ΔN strength, p < 0.05, Wilcoxon's test) in blue, and connections whose strength did not change after pairing (p ≥ 0.05, Wilcoxon's test) as gray. D, Changes in strength (black bars), potency (gray bars), and failure rate (white bars) for all studied L4–L4 cell pairs (n = 42). Each group of three bars corresponds to a pair recording experiment sorted by group from lowest ΔN to the left to highest ΔN to the right. Underlined areas indicate pairs that underwent significant depression (blue, n = 19), potentiation (red, n = 7), or no change (gray, n = 16). E, F, Correlations between ΔN strength and ΔN potency (A; R2 = 0.57, p < 0.001) and ΔN failure rate (B; R2 = 0.42, p < 0.001). G, Correlation between ΔN potency and ΔN failure rate (R2 = 0.34, p < 0.001).
Because average synaptic strength reflects the interaction of potency and failure rate over all trials, we also determined the relationship between changes in these three parameters. Changes in strength, potency, and failure rate were related, so that connections that underwent potentiation tended to show an increase in potency and a decrease in failure rate concomitant with the increase in strength; the opposite was true for cell pairs that underwent depression, in which decreases in strength were typically accompanied by decreases in potency and increases in failure rate. For NC cell pairs, the relationship between these parameters was variable: in some cases, neither potency nor failure rate changed; in other cases, they offset each other (i.e., both potency and failure rate increased or decreased in response to pairing). These relationships between strength, potency, and failure rate are plotted in Figure 3E–G. Figure 3E illustrates a positive correlation between ΔN strength and ΔN potency (R2 = 0.57, p < 0.001), and Figure 3F illustrates a negative correlation between ΔN strength and ΔN failure rate (R2 = 0.42, p < 0.001). Although changes in failure rates are generally ascribed to a presynaptic locus, the changes in potency could arise from postsynaptic changes (i.e., changes glutamate receptor density or conductance), from presynaptic changes (i.e., changes in failure rate in connections mediated by multiple release sites), or from a combination of both. If potency changes have a presynaptic component, a correlation between changes in potency and failure rate would be expected, as is the case (Fig. 3G, R2 = 0.34, p < 0.001).
Differences in outcomes with common presynaptic or postsynaptic cellular elements
In light of the variable outcomes of plasticity, it is of interest to determine whether presynaptic processes [such as the developmental assembly of presynaptic vesicle fusion machinery with common properties (Rosenmund et al., 2002) or a common activity history of the parent axon (Abraham, 2008)] or postsynaptic processes (such as a common postsynaptic activity history or expression of similar secondary signaling mechanisms across the dendritic tree) contributed to the response to pairing. To assess this possibility, we recorded simultaneously from triplets of connected L4 cells in which presynaptic APs resulted in simultaneous uEPSCs in two postsynaptic neurons (n = 4 divergent triplet sets) or sequentially from cell pairs in triplet sets in which a common postsynaptic cell responded to activation of two presynaptic neurons (n = 3 convergent triplet sets). In the case of divergent triplets, simultaneous pairing of presynaptic and postsynaptic activity was applied to both connections. The records and analysis from one of these simultaneously recorded divergent triplet sets are shown in Figure 4, A and B. In this particular example, one of the connections underwent LTP (from 6.94 ± 7.14 to 10.31 ± 6.38 pA; p < 0.001, Wilcoxon's test) (Fig. 4A) and the other underwent LTD (from 3.82 ± 5.38 to 2.49 ± 4.53 pA; p < 0.05, Wilcoxon's test) (Fig. 4B). The time plots (Fig. 4A1,B1), PDFs (Fig. 4A2,B2), average prepairing (black) and postpairing (red) traces (Fig. 4A2,B2, insets), and summarized changes in strength, potency, and failure rate (Fig. 4A3,B3) are shown. The results for all four divergent triplet experiments are summarized in Figure 4C; pairs of connections with a common presynaptic element could undergo a similar outcome (NC–NC, n = 1; triplet a), different outcomes (NC–LTP, n = 2; triplets b and c), or opposite outcomes (LTD–LTP, n = 1; triplet d) sign. The data in Figure 4, A and B, correspond to triplet d in Figure 4C1–C3. When the differences in outcomes between pairs in a triplet set were compared with a similarly sized random sample of pairs of L4–L4 connections from the complete database of connected cell pairs (n = 42), no differences were found (see Materials and Methods) (supplemental Fig. 2, available at www.jneurosci.org as supplemental material), suggesting that connections with a common presynaptic element do not respond more similarly to the plasticity induction protocol than do pairs of connections for which different presynaptic and postsynaptic cells were tested. Figure 4D shows the outcomes for pairs of connections that share a common postsynaptic neuron (n = 3 convergent triplets); unlike with divergent triplets, these pairs were tested sequentially. Changes in strength (Fig. 4D1), potency (Fig. 4D2), and failure rate (Fig. 4D3) are indicated for three such convergent triplet sets (a–c). Pairs of connections with a common postsynaptic element underwent different combinations of outcomes, including NC–NC (n = 1; triplet e) and NC–LTD (n = 2; triplets f and g). For every triplet in D, the left bar in the pair corresponds to the pair that was recorded and paired first. As was the case for divergent triplets, no differences were found in plasticity outcomes between pairs among convergent triplet sets and randomly selected pairs from our L4–L4 database (supplemental Fig. 2, available at www.jneurosci.org as supplemental material).
Figure 4.

Different plasticity outcomes in connections sharing a common presynaptic or postsynaptic neuron. A, B, Time plots (A1–B1), PDFs (A2–B2), average prepairing and postpairing responses (A2–B2, insets; coupling artifacts removed for clarity), and strength (left), potency (middle), and failure rate (middle) bar plots (A3–B3) for the two sets of cell pairs in a divergent triplet set that share a common presynaptic cell and that were recorded simultaneously. The results for changes in strength, potency, and failure rate for this divergent triplet are summarized in d in C1–C3. A1–A3 show results from the cell pair of the triplet set that underwent LTP (from 6.94 ± 7.14 to 10.31 ± 6.38 pA; p < 0.01, Wilcoxon's test), and B1–B3 show results from the other cell pair of the divergent triplet set (same presynaptic cell, different postsynaptic target cell) from the same triplet set that underwent LTD (from 3.82 ± 5.38 to 2.49 ± 4.53 pA; p < 0.05, Wilcoxon's test). C, Changes in strength (C1), potency (C2), and failure rate (C3) for all four divergent triplet set experiments in which pairs of connections with a common presynaptic cell were recorded and paired simultaneously. Each pair of bars corresponds to the changes for both connections in a triplet. LTP/NC/LTD pairs are indicated by red, gray, and blue bars, respectively. D, Changes in strength (D1), potency (D2), and failure rate (D3) for all three experiments in which triplet sets of connected cell pairs with different presynaptic cells and a common postsynaptic cell were evaluated. Each pair of bars corresponds to the changes for both connections in a triplet; the left bar corresponds to the pair that was recorded and paired first. *p < 0.05, **p < 0.01, ***p < 0.001 by Wilcoxon's test.
Effects of plasticity on paired-pulse responses
Because there is an effect of pairing on release probability, a parameter that has been shown to be linked to the short-term behavior in L4–L4 connections (Sáez and Friedlander, 2009), we investigated whether the outcomes in response to the pairing also changed the behavior of the synapses in response to pairs of presynaptic spikes at brief intervals by measuring the paired-pulse ratio (PPR) before and after pairing. One cell pair that had a very high failure rate (95%) and large prepairing PPR (28.3) was thus excluded from the analysis. A negative PPR change indicates a shift toward paired-pulse depression (PPD), and a positive PPR change indicates a shift toward paired-pulse facilitation (PPF). The changes in paired-pulse ratios were negatively correlated with ΔN strength (Fig. 5A, R2 = 0.65, p < 0.001) and positively with ΔN failure rate (Fig. 5B, R2 = 0.15, p < 0.05). Therefore, cell pairs whose strength decreased or failure rate increased showed more pronounced PPF after pairing, whereas those whose strength increased or failure rate decreased shifted toward PPD. Thus, the longer-term plasticity triggered by the pairing also results in changes in the effective coupling in the cell pairs in response to sequential presynaptic spikes over milliseconds timescales. Moreover, these results are consistent with a presynaptic locus contributing to some of the expression of LTP and LTD in response to our pairing protocol (see Fig. 8 on this subject, as well). Figure 5C shows recordings from a cell pair that showed more pronounced PPD after LTP (top; black, average prepairing response; red, average postpairing response) and a cell pair that showed a shift toward PPF depression (bottom; black, pre; red, post). The average changes in PPR separated by outcome group are shown in Figure 5D. There was a significant difference in PPR change between the LTP and LTD groups (−0.57 ± 0.32 vs 0.09 ± 23.7; p < 0.001, Wilcoxon's test) and between the LTD and NC group that had an intermediate PPR change (−0.22 ± 0.26; p < 0.01, Wilcoxon's test) but not between the LTP and NC groups (p = 0.05, Wilcoxon's test). There was also a change in latency after pairing that correlated with the change in strength (supplemental Fig. 3, available at www.jneurosci.org as supplemental material). However, the magnitude of the change was not higher than one would expect given the relationship between strength and latency in L4–L4 pairs (Sáez and Friedlander, 2009).
Figure 5.

Changes in synaptic strength are correlated with changes in paired-pulse responses. Correlations between changes in paired-pulse ratio (PPRpost − PPRpre) and normalized changes in strength (A; R2 = 0.65, p < 0.001) and failure rate (B; R2 = 0.15, p < 0.05). Negative ΔN PPR values indicate a shift toward PPD, whereas positive values indicate a shift toward PPF. C, Averaged prepairing (black) and postpairing (red) traces from example connections that underwent LTP and a shift toward PPD (top) and LTD and a shift toward PPF (bottom). D, Bar plots showing the change in PPR for each plasticity group (LTP/NC/LTD shown in red/gray/blue). **p < 0.01, ***p < 0.001 by Wilcoxon's test.
Figure 8.
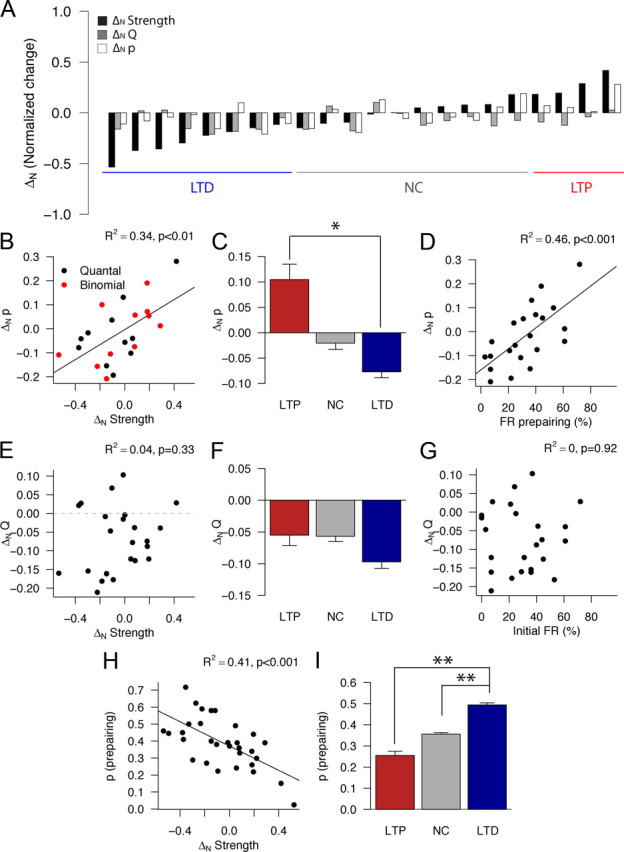
Quantal analysis of loci of plasticity expression. A, Changes in strength (black bars), quantal size Q (gray bars), and individual release site release probability (white bars) for all connections that were fit by either a quantal or binomial model before and after pairing (n = 22). Each group of three bars corresponds to one experimental cell pair, sorted from the most depression to the left to the most potentiation to the right. The lines below the bar plot indicate pairs that underwent significant depression (blue; n = 8), no change (gray; n = 10), or significant potentiation (red; n = 4) in this subset of cell pairs. B, Correlation between normalized changes in strength and p (R2 = 0.34, p < 0.01). Black dots indicate connections that were optimally fitted by a binomial model before and after pairing; the p values are therefore estimated to be the same across all release sites mediating the connection. Connections that were optimally fitted by a quantal model before or after pairing are shown as red circles; for these connections, the p values are averages of the inhomogeneous release probabilities across all release sites. C, Averaged normalized changes in p for connections grouped by outcome. ΔN p was significantly different for LTP and LTD groups (p < 0.05, Wilcoxon's test) only. D, Correlation between initial failure rate and ΔN p (R2 = 0.46, p < 0.001). E, Lack of correlation between normalized changes in strength and Q (R2 = 0.04, p = 0.33). F, Averaged normalized changes in Q for connections grouped by outcome. ΔN Q was not significantly different between groups (all p > 0.05, Wilcoxon's test). G, Lack of correlation between initial failure rate and ΔN Q (R2 = −0, p = 0.92). H, Correlation between initial p and ΔN strength (R2 = 0.41, p < 0.01). I, Averaged normalized initial p values for connections grouped by plasticity outcome. Average p values for were significantly different between LTD and LTP groups and between LTD and NC groups (p < 0.01, test).
Initial synapse state predicts plasticity outcome
Because the parameters governing baseline synaptic transmission among L4–L4 excitatory cells are widely variable (Sáez and Friedlander, 2009), we determined whether outcomes in response to an identical conditioning protocol with a fixed post-presynaptic activation timing delay were also related to the initial state of the synapses. The ability to undergo plasticity is related to the initial strength of the synapses between a connected pair of cells (Fig. 6A): connections with greater initial strengths are less likely to undergo any plasticity (LTP or LTD) (Fig. 6A). The absolute value of the magnitude of the plasticity for individual cell pairs is correlated with initial strength (R2 = 0.14, p < 0.01; data not shown). The absolute value of the normalized changes in strength was larger for initially weaker (<10 pA) vs stronger (>10 pA) pairs (0.22 ± 0.26, n = 28 vs 0.12 ± 0.1, n = 14; p < 0.001, Wilcoxon's test). These strength changes were analyzed as absolute values, thus effectively combining potentiation and depression under a superset of plasticity regardless of polarity for purposes of this comparison. A similar relationship exists between the ability to undergo plasticity and the number of release sites (N) obtained by quantal analysis for the baseline prepairing period. N is a strong determinant of connection strength in L4–L4 connections (Sáez and Friedlander, 2009). Cell pairs with N < 5 modeled release sites and those with N ≥ 5 also follow a similar relationship in absolute change after pairing (0.24 ± 0.28 vs 0.10 ± 0.13; p < 0.001, Wilcoxon's test) (supplemental Fig. 4, available at www.jneurosci.org as supplemental material). There was also a correlation between outcome and initial failure rate (Fig. 6B): cell pairs with initial lower failure rates (reliable connections) tend to depress and those with higher failure rates (unreliable connections) tend to potentiate (R2 = 0.3, p < 0.001). The prepairing and postpairing failure rates for all individual cell pairs that underwent plasticity are shown in Figure 6C, with LTP cell pairs in red and LTD cell pairs in blue. The average failure rates for all LTP and LTD cell pairs are indicated as red (LTP) and blue (LTD) ticks. These were significantly different in the baseline condition (49.3 ± 27.7 vs 15.1 ± 15.5%; p < 0.01, Wilcoxon's test) but not in the postpairing condition (34.9 ± 29.6 vs 26.9 ± 19.7%; p = 0.51, Wilcoxon's test). The average failure rate for all tested pairs (gray ticks) did not change after pairing (24.54 ± 22.20 vs 27.36 ± 20.99%; p = 0.51, Wilcoxon's test). The initial PPR of the connections also correlated with strength change (Fig. 6D, R2 = 0.18, p < 0.01), such that pairs that show PPD are more likely to undergo LTD and those that show PPF tend to undergo LTP. These results are summarized in Figure 6E–G; significant differences between the LTP and LTD group were observed for initial strength (Fig. 6E, p < 0.05, Wilcoxon's test), initial failure rate (Fig. 6F, p < 0.01, Wilcoxon's test), but not in initial PPR, although a trend existed (Fig. 6G, p = 0.06, Wilcoxon's test). Additionally, significant differences between the LTD and the NC group were observed for initial PPR (Fig. 6G, p < 0.01, Wilcoxon's test). Together, these results indicate that the initial reliability of the connection is an important factor in determining the sign and magnitude of strength changes induced by pairing, thus providing a normalizing mechanism for the release probability of connections and individual release sites.
Figure 6.

Initial connection reliability, but not strength, predicts plasticity outcome. A, Scatter plot showing the relationship of initial connection strength to normalized synaptic strength change. B, Correlation between ΔN strength and initial cell pair connection failure rate (n = 42; R2 = 0.30, p < 0.001). C, Plot showing the individual failure rate values before (left) and after (right) pairing. Connections that underwent LTP (n = 7) are shown as red circles and lines, and those that underwent LTD (n = 19) are shown as blue circles and lines. Ticks indicate the initial and final average failure rate values for LTP (red), LTD (blue), and all connections (gray). D, Correlation between ΔN strength and initial PPR (n = 42; R2 = 0.18, p < 0.01). E–G, Bar plots showing the average initial strength (E), failure rate (FR; F), and PPR (G) for each plasticity group (LTP/NC/LTD shown in red/gray/blue). *p < 0.05, **p < 0.01 by Wilcoxon's test.
Unmasking weak connections
An extreme example of a weakly connected cell pair is illustrated in Figure 7. The failure rate for this cell pair in response to the first presynaptic action potential during the prepairing period was 100%; because of this unusual behavior, we were unable to calculate a value for strength or potency prepairing. Thus, we excluded it from analysis elsewhere and report it here independently. Interestingly, this cell pair demonstrated substantial relative capacity for plasticity in response to the pairing protocol. Sixty example consecutive responses recorded during the baseline prepairing condition in response to paired presynaptic action potentials are shown in Figure 7A (top left). The lack of an apparent response is evident in all the individual traces as well as in the averaged trace recorded before pairing (Fig. 7A, middle black trace). However, an uEPSC is evident in response to the second of the two presynaptic action potentials during the prepairing condition (Fig. 7A, top individual traces and middle averaged trace), as would be expected because of the tendency of connections with low release probabilities to undergo PPF (Sáez and Friedlander, 2009). After pairing (of just a single presynaptic action potential with postsynaptic activation), occasional uEPSCs were evoked in response to both presynaptic APs (Fig. 7B, top traces), resulting in an increased average uEPSC amplitude in response to the second spike but also a discernible averaged response in response to the first spike as well (Fig. 7B, middle red trace). The PPR for this connection was 5.65 after pairing. Remarkably, the connection between this cell pair was able to undergo plasticity in response to a Hebbian pairing protocol in which a single presynaptic AP that appeared not to evoke any detectable postsynaptic response was paired with postsynaptic spiking. The changes in strength, potency, and failure rate in response to the first spike are summarized in Figure 7C. Figure 7D shows the superimposed average traces for both the prepairing (black) and postpairing (red) epochs. The response to the second AP in the paired-pulse stimulation paradigm rules out the possibility that the synaptic connections were devoid of postsynaptic AMPA receptors (silent synapses with only NMDA receptors) (Liao et al., 1995; Montgomery et al., 2001; Kerchner and Nicoll, 2008). Without first conditioning or unmasking the NMDA receptor response through postsynaptic depolarization, these would not respond to the first or second presynaptic AP. The quantal size of the second response (6.18 pA) indicates sufficient activation of postsynaptic AMPA receptors whenever a vesicle was liberated, ruling out the possibility that glutamate was released in concentrations too low to activate AMPA receptors. However, one or more undetected fusion events may have occurred during pairing, perhaps sufficient to trigger plasticity. Alternatively, AP invasion of the presynaptic terminals might have created a presynaptic “tag” [similar in concept to a postsynaptic tag (Frey and Morris, 1997; Barco et al., 2002)] capable of detecting coincident presynaptic and postsynaptic activity in conjunction with a retrograde signal. Such a tag could result from residual calcium or activation of a calcium sensor in the presynaptic terminal (Tsujimoto et al., 2002; Rizo and Rosenmund, 2008) that could interact with a retrograde signal (Montague et al., 1994; Kreitzer and Regehr, 2001; Sjöström et al., 2003).
Figure 7.

Example of a connection with 100% initial failure rate that potentiated in response to pairing. A, Sixty example prepairing consecutive traces (top, black), average of all recorded trials (middle, black), and example presynaptic action potentials (bottom, black) of a connection with failure rate of 100% in response to the first action potential in the pair. B, Same as A but after pairing. The average of all recorded trials is shown in red (middle). C, Summary strength (left), potency (middle), and failure rate (right) changes for the connection shown in A and B. D, Superimposed average prepairing (black) and postpairing (red) traces for the connection in A–C.
Potential sites of expression of plasticity
Analysis of failure rate and potency (Fig. 3) suggests that the plasticity induced by pairing has a presynaptic component but does not determine whether a postsynaptic locus of expression also exists. This is particularly important to address the underlying mechanisms between the different plasticity outcomes that occur with an identical timing delay in the pairing protocol. To address the issues of the mechanisms of differential outcomes between L4 neuronal pairs and the site(s) of plasticity expression, we applied unbiased quantal analysis techniques (see Materials and Methods) to determine the effects of the pairing protocol on individual release site release probability (p) and quantal size (Q). Figure 8A shows the normalized changes in synaptic strength, Q, and p for each of the cell pairs that were fitted to a quantal or binomial model (n = 22). Similar to Figure 3D, each group of bars represents the change in each parameter for an individual cell pair (connections are sorted by outcome group from minimum to maximum ΔN left to right). Changes in p were correlated with changes in strength (Fig. 8B, R2 = 0.34, p < 0.01). Cell pairs that underwent LTP had an overall increase in p, whereas cell pairs that underwent LTD had a decrease in p (Fig. 8C; LTP ΔN = 0.1 ± 0.12, LTD ΔN = −0.08 ± 0.09; p < 0.05, Wilcoxon's test). Similar to the case of normalized strength change (Fig. 6B), the initial reliability predicts the change in p (Fig. 8D, R2 = 0.46, p < 0.001). Changes in Q were not correlated with changes in strength (Fig. 8E, R2 = 0.04, p = 0.33), nor were they significantly different between groups (Fig. 8F, p > 0.3 for all comparisons, Wilcoxon's test). Interestingly, Q underwent a significant reduction after pairing (p < 0.01, Wilcoxon's test) among all outcome groups, regardless of the change in p (Fig. 8F). Contrary to p (Fig. 8D), the initial failure rate did not predict ΔNQ (Fig. 8G, R2 = 0, p = 0.92). Changes in the modeled number of release sites (N) did not correlate with strength change (R2 = 0.08, p = 0.08), were not significantly affected by pairing (p = 0.53), and were not predicted by the initial failure rate of the connection (R2 = 0.03, p = 0.16) (supplemental Fig. 4, available at www.jneurosci.org as supplemental material). Similar to the overall failure rate (Fig. 6B), the prepairing p also correlates with strength change (Fig. 8H, R2 = 0.41, p < 0.001). The prepairing p values differ significantly between the LTD group and the LTP and NC groups (Fig. 8I, p < 0.01, Wilcoxon's test).
Discussion
Summary
We analyzed synaptic responses between pairs of L4 excitatory neurons before and after pairings of presynaptic and postsynaptic activity in primary visual cortex. The identical pairing protocol resulted in different outcomes between cell pairs. The polarity and magnitude of the outcome depended on the initial strength and reliability of the connections: unreliable connections underwent LTP, more reliable connections underwent LTD, and the most reliable and potent connections did not change. Most sets of connections underwent a reduction in quantal size (Q), whereas transmission probability (p) underwent bidirectional changes that, when increased, could offset or override the reduction in Q, sometimes leading to a net LTP. Moreover, different outcomes could be induced at different sets of synapses that share a common presynaptic or postsynaptic cell.
Range of outcomes
Most L4–L4 cell pairs (62%) responded to pairing with LTP or LTD resulting from a combination of altered potency and failure rate (Fig. 3E,F). The relative presynaptic and postsynaptic contributions to plasticity expression were evaluated with quantal analysis. LTD was accompanied by a reduction in Q (Fig. 8F) and p (Fig. 8C). Although changes in Q may be presynaptic (Edwards, 2007), they are generally considered as postsynaptic (Malinow, 1991; Voronin et al., 1992; Manabe and Nicoll, 1994) through regulating AMPA receptor trafficking (Hayashi et al., 2000; Park et al., 2004) or by modifying single-channel conductance and/or open probability (Barria et al., 1997; Lee et al., 2000). Clathrin-mediated AMPA receptor retrieval has been implicated in LTD expression in visual cortex (Crozier et al., 2007; Smith et al., 2009) and could account for the uniform decreases in Q. Surprisingly, in our experiments, LTP was often accompanied by a reduction in Q (Fig. 8F) but was overridden by an increase in p (Fig. 8C), increasing synaptic strength. Such changes may be mediated by a retrograde messenger such as nitric oxide (Montague et al., 1994; Hardingham and Fox, 2006; Haghikia et al., 2007). Changes in the number of active spines have been described previously (Nägerl et al., 2004). These changes occur 30–60 min after induction (Engert and Bonhoeffer, 1999), but whether they can happen earlier is still unclear (Toni et al., 1999; Ninan et al., 2006); therefore, it is possible that de novo synapse formation contributes to the observed changes in synaptic strength.
Possible sources of different plasticity outcomes
The different outcomes between cells of like-type may be attributable to the induction protocol, differences in intrinsic properties, or in the initial state of the synapses. We used paired presynaptic and postsynaptic activity with postsynaptic spikes beginning 10 ms before presynaptic stimulation. The outcomes are considered to be a function of the timing between presynaptic and postsynaptic activity, LTP occurring when presynaptic activation leads and LTD occurring when postsynaptic activation leads (Bi and Poo, 1998; Froemke et al., 2005). Such STDP with a single postsynaptic spike occurs in hippocampus (Campanac and Debanne, 2008), optic tectum (Mu and Poo, 2006), and neocortex (Froemke and Dan, 2002; Kampa et al., 2006; Meliza and Dan, 2006). Similar results occur when multiple postsynaptic spikes are evoked, although the timing of the first postsynaptic spike is the most salient (Froemke et al., 2006). Although STDP is generally robust, particularly in hippocampus (Bi and Poo, 1998; Wang et al., 2005), in neocortex, variable outcomes can occur at a given delay in vitro at L4–L2/3 connections (Ismailov et al., 2004; Meliza and Dan, 2006; Hardingham et al., 2007) and in L2/3 neurons in vivo (Meliza and Dan, 2006). Thus, factors other than timing may play a role within neocortex. Moreover, different induction protocols (Kirkwood and Bear, 1994; Dudek and Friedlander, 1996; Lee et al., 2000; Sjöström et al., 2003; Yoshimura et al., 2003) may access alternate expression mechanisms. Although our recordings were made from neurons of apparent like-type, these cells may belong to functional subclasses (Rossner et al., 2006; Sugino et al., 2006). Differences in postsynaptic calcium signaling may also contribute (Ismailov et al., 2004). Interestingly, differences in calcium buffering properties occur among GABAergic cortical neurons (Hendry et al., 1989; Huang et al., 1992; Hof et al., 1999; Porter et al., 2001; Kawaguchi and Kondo, 2002); similar differences might occur among L4 excitatory neurons.
The initial state of the synaptic connections is predictive of outcome (Figs. 6, 8). For example, connections that potentiated were initially weaker (Fig. 6E) and less reliable (Fig. 6F) than those that depressed, and they predominantly underwent PPF (Fig. 6G). Moreover, differences in reliability manifested across release sites, as indicated by quantal analysis: the individual release site p value also is lower in connections that subsequently undergo LTD (Fig. 8I). Sensitivity of plasticity outcome to initial synapse reliability has been suggested in hippocampus and for other types of synapses in neocortex (Larkman et al., 1992; Ward et al., 2006; Hardingham et al., 2007). This mechanism allows previously depressed connections with high failure rates (Fig. 6C) to enhance their reliability, even with presynaptic/postsynaptic temporal conjunctions that would otherwise elicit LTD (Bi and Poo, 1998). The expression of plasticity of a given polarity would potentially hinder additional plasticity of the same polarity (Coan et al., 1989; Huang et al., 1992; Lee et al., 2000), shifting plasticity induction curve (Bienenstock et al., 1982). Thus, the history of the connections is important (Abraham and Bear, 1996; Abraham, 2008).
In a previous study of plasticity at unitary excitatory connections within L4 of barrel cortex (Egger et al., 1999), only LTD was induced, independent of the timing of the pairing. Although LTD was the most common outcome in our experiments in V1, LTP also occurred (Figs. 2A, 6C). Interestingly, L4–L4 excitatory synapses in visual cortex have a wider range of baseline strengths (Sáez and Friedlander, 2009) than those in barrel cortex (Egger et al., 1999), including very weak, unreliable connections that underwent LTP. Thus, the initial state of the synapse is related to the plasticity outcome (Larkman et al., 1992; Bi and Poo, 1998; Montgomery et al., 2001; Ward et al., 2006; Hardingham et al., 2007), giving L4–L4 connections a wider plasticity operating range and avoiding silencing (Torii et al., 1997).
Stability of strong connections
Thirty-eight percent of L4–L4 connections did not undergo plasticity (Fig. 3A). These connections are among the strongest (Fig. 6A,E). In particular, strong connections with 0% failure rate did not change (Fig. 6B). Although 62% of the L4–L4 cellular connections underwent plasticity, the average change for all connections (n = 42) was just −1 ± 54.9% or ΔN = −0.06 ± 0.23. Thus, a generalized presynaptic and postsynaptic coactivation of numerous L4–L4 connections would have a small impact on the overall strength of the entire L4 excitatory network. Within L4, perfectly reliable connections account for 25% of the cell pairs but 75% of the cumulative strength (Sáez and Friedlander, 2009). This pattern of connectivity, with a few powerful synapses embedded in a network of weak ones, has also been described in L5 of visual cortex (Song et al., 2005).
L4 circuitry plays an important role in early visual processing, including amplifying thalamocortical input (Douglas et al., 1995; Martin, 2002) and establishing receptive field architecture (Stern et al., 2001). The high reliability and strength of most L4–L4 connections (Sáez and Friedlander, 2009) suits them for transmission and amplification of thalamocortical input (Douglas et al., 1995). Activation of the strongest L4–L4 connections can trigger postsynaptic spiking (Feldmeyer et al., 1999; Sáez and Friedlander, 2009), propagating intralaminar synaptic activity. Within visual cortex L4, coexistence of strong stable connections with weaker plastic connections might be attributable to the need for L4 circuitry to remain stable during most sensory processing, allowing for dynamic behavior with altered input (Maffei et al., 2004) or during sensory learning (Calford, 2002; Hoshino, 2004; Karmarkar and Dan, 2006; Tsanov and Manahan-Vaughan, 2007; Feldman, 2009). Alternatively, plasticity may be induced only in some connections during normal sensory experience, keeping overall excitability stable. For example, during normal thalamic transmission, transient activation of thalamocortical inputs occurs, resulting preferentially in activation of high release probability synapses. However, in burst mode (Ramcharan et al., 2000; Sherman, 2001, 2005), which has been implicated in awake behavior (Bezdudnaya et al., 2006), trains of APs pass along thalamocortical axons, providing strong input to L4 cells. The efficacy of L4–L4 synapses driven by this train is greater for reliable connections at the beginning of the train and for unreliable ones near its end, separating them temporally and potentially allowing for partially segregated pairing and modification of subsets of connections within L4, whereas strong unmodified connections ensure transmission of rapid information. Similar findings have been reported in hippocampal cultures (Bi and Poo, 1998) and slices (Montgomery et al., 2001) and in cortical slices (Montgomery et al., 2001; Sjöström et al., 2001).
Pairs of connections with a common presynaptic or postsynaptic element
The dependence of plasticity outcome on initial state suggests that the history of synapses can influence their behavior (Abraham and Bear, 1996; Philpot et al., 2003). Thus, connections with common presynaptic or postsynaptic elements or similar histories may respond similarly. Such cell pairs within an interconnected triplet set can behave similarly or differently (Fig. 4C,D). However, their plasticity responses are no more similar than those of randomly selected cell pairs (n = 42) (supplemental Fig. 2, available at www.jneurosci.org as supplemental material). Although the initial state of a set of synaptic connections between different cells may also be influenced by cell-wide regulation of expression of presynaptic or postsynaptic signaling cascades, our analysis of interconnected triplets shows that the history of individual synapses trumps such effects. Our experiments are conducted when visual cortex has experienced considerable activity (guinea pigs are precocious, born with eyes open, exhibiting diurnal visual behavior early) (Huang et al., 1990; Harkness and Wagner, 1995), and, thus, there is likely to be variability in the correlated pre-postsynaptic activity profiles between cells and synapses. Studies with equal experience for the visual cortex (e.g., dark rearing or binocular deprivation) (Desai et al., 2002; Kind et al., 2002; Smith et al., 2009) would provide a direct test of this hypothesis.
Conclusion
It is generally considered that synaptic connections of like-type behave similarly when subject to a plasticity inducing protocol (Kirkwood and Bear, 1994; Stevens and Wang, 1994; Heynen et al., 1996; Egger et al., 1999; Feldman, 2000; Daw et al., 2004). However, increasing evidence suggests that there can be functional diversity in plasticity behavior (Ismailov et al., 2004; Hardingham et al., 2007). Thus, it is not surprising that these variable plasticity outcomes are related to the initial strength and reliability of the synapses (Larkman et al., 1992; Bear, 1995; Montgomery and Madison, 2002; Ward et al., 2006).
Footnotes
This work was supported by National Institutes of Health Grant EY-12782 (M.J.F.). We thank Felicia Hester and Susanna Kiss for technical assistance and Christian Stricker for help with the quantal analysis.
References
- Abraham WC. Metaplasticity: tuning synapses and networks for plasticity. Nat Rev Neurosci. 2008;9:387. doi: 10.1038/nrn2356. [DOI] [PubMed] [Google Scholar]
- Abraham WC, Bear MF. Metaplasticity: the plasticity of synaptic plasticity. Trends Neurosci. 1996;19:126–130. doi: 10.1016/s0166-2236(96)80018-x. [DOI] [PubMed] [Google Scholar]
- Ahmed B, Anderson JC, Douglas RJ, Martin KA, Nelson JC. Polyneuronal innervation of spiny stellate neurons in cat visual cortex. J Comp Neurol. 1994;341:39–49. doi: 10.1002/cne.903410105. [DOI] [PubMed] [Google Scholar]
- Bannister NJ, Nelson JC, Jack JJ. Excitatory inputs to spiny cells in layers 4 and 6 of cat striate cortex. Philos Trans R Soc Lond B Biol Sci. 2002;357:1793–1808. doi: 10.1098/rstb.2002.1160. [DOI] [PMC free article] [PubMed] [Google Scholar]
- Barco A, Alarcon JM, Kandel ER. Expression of constitutively active CREB protein facilitates the late phase of long-term potentiation by enhancing synaptic capture. Cell. 2002;108:689–703. doi: 10.1016/s0092-8674(02)00657-8. [DOI] [PubMed] [Google Scholar]
- Barria A, Muller D, Derkach V, Griffith LC, Soderling TR. Regulatory phosphorylation of AMPA-type glutamate receptors by CaM-KII during long-term potentiation. Science. 1997;276:2042–2045. doi: 10.1126/science.276.5321.2042. [DOI] [PubMed] [Google Scholar]
- Bear MF. Mechanism for a sliding synaptic modification threshold. Neuron. 1995;15:1–4. doi: 10.1016/0896-6273(95)90056-x. [DOI] [PubMed] [Google Scholar]
- Bear MF, Singer W. Modulation of visual cortical plasticity by acetylcholine and noradrenaline. Nature. 1986;320:172–176. doi: 10.1038/320172a0. [DOI] [PubMed] [Google Scholar]
- Bezdudnaya T, Cano M, Bereshpolova Y, Stoelzel CR, Alonso JM, Swadlow HA. Thalamic burst mode and inattention in the awake LGNd. Neuron. 2006;49:421–432. doi: 10.1016/j.neuron.2006.01.010. [DOI] [PubMed] [Google Scholar]
- Bi GQ, Poo MM. Synaptic modifications in cultured hippocampal neurons: dependence on spike timing, synaptic strength, and postsynaptic cell type. J Neurosci. 1998;18:10464–10472. doi: 10.1523/JNEUROSCI.18-24-10464.1998. [DOI] [PMC free article] [PubMed] [Google Scholar]
- Bienenstock EL, Cooper LN, Munro PW. Theory for the development of neuron selectivity: orientation specificity and binocular interaction in visual cortex. J Neurosci. 1982;2:32–48. doi: 10.1523/JNEUROSCI.02-01-00032.1982. [DOI] [PMC free article] [PubMed] [Google Scholar]
- Binzegger T, Douglas RJ, Martin KA. A quantitative map of the circuit of cat primary visual cortex. J Neurosci. 2004;24:8441–8453. doi: 10.1523/JNEUROSCI.1400-04.2004. [DOI] [PMC free article] [PubMed] [Google Scholar]
- Calford MB. Dynamic representational plasticity in sensory cortex. Neuroscience. 2002;111:709–738. doi: 10.1016/s0306-4522(02)00022-2. [DOI] [PubMed] [Google Scholar]
- Campanac E, Debanne D. Spike timing-dependent plasticity: a learning rule for dendritic integration in rat CA1 pyramidal neurons. J Physiol. 2008;586:779–793. doi: 10.1113/jphysiol.2007.147017. [DOI] [PMC free article] [PubMed] [Google Scholar]
- Chapman B, Jacobson MD, Reiter HO, Stryker MP. Ocular dominance shift in kitten visual cortex caused by imbalance in retinal electrical activity. Nature. 1986;324:154–156. doi: 10.1038/324154a0. [DOI] [PubMed] [Google Scholar]
- Chino Y, Smith EL, 3rd, Zhang B, Matsuura K, Mori T, Kaas JH. Recovery of binocular responses by cortical neurons after early monocular lesions. Nat Neurosci. 2001;4:689–690. doi: 10.1038/89469. [DOI] [PubMed] [Google Scholar]
- Coan EJ, Irving AJ, Collingridge GL. Low-frequency activation of the NMDA receptor system can prevent the induction of LTP. Neurosci Lett. 1989;105:205–210. doi: 10.1016/0304-3940(89)90038-4. [DOI] [PubMed] [Google Scholar]
- Cowan AI, Stricker C. Functional connectivity in layer IV local excitatory circuits of rat somatosensory cortex. J Neurophysiol. 2004;92:2137–2150. doi: 10.1152/jn.01262.2003. [DOI] [PubMed] [Google Scholar]
- Crozier RA, Wang Y, Liu CH, Bear MF. Deprivation-induced synaptic depression by distinct mechanisms in different layers of mouse visual cortex. Proc Natl Acad Sci U S A. 2007;104:1383–1388. doi: 10.1073/pnas.0609596104. [DOI] [PMC free article] [PubMed] [Google Scholar]
- Dan Y, Poo MM. Spike timing-dependent plasticity of neural circuits. Neuron. 2004;44:23–30. doi: 10.1016/j.neuron.2004.09.007. [DOI] [PubMed] [Google Scholar]
- Daw N, Rao Y, Wang XF, Fischer Q, Yang Y. LTP and LTD vary with layer in rodent visual cortex. Vision Res. 2004;44:3377–3380. doi: 10.1016/j.visres.2004.09.004. [DOI] [PubMed] [Google Scholar]
- Desai NS, Cudmore RH, Nelson SB, Turrigiano GG. Critical periods for experience-dependent synaptic scaling in visual cortex. Nat Neurosci. 2002;5:783–789. doi: 10.1038/nn878. [DOI] [PubMed] [Google Scholar]
- Dews PB, Wiesel TN. Consequences of monocular deprivation on visual behaviour in kittens. J Physiol. 1970;206:437–455. doi: 10.1113/jphysiol.1970.sp009023. [DOI] [PMC free article] [PubMed] [Google Scholar]
- Douglas RJ, Koch C, Mahowald M, Martin KA, Suarez HH. Recurrent excitation in neocortical circuits. Science. 1995;269:981–985. doi: 10.1126/science.7638624. [DOI] [PubMed] [Google Scholar]
- Dudek SM, Friedlander MJ. Developmental down-regulation of LTD in cortical layer IV and its independence of modulation by inhibition. Neuron. 1996;16:1097–1106. doi: 10.1016/s0896-6273(00)80136-1. [DOI] [PubMed] [Google Scholar]
- Eder M, Zieglgänsberger W, Dodt HU. Neocortical long-term potentiation and long-term depression: site of expression investigated by infrared-guided laser stimulation. J Neurosci. 2002;22:7558–7568. doi: 10.1523/JNEUROSCI.22-17-07558.2002. [DOI] [PMC free article] [PubMed] [Google Scholar]
- Edwards RH. The neurotransmitter cycle and quantal size. Neuron. 2007;55:835–858. doi: 10.1016/j.neuron.2007.09.001. [DOI] [PubMed] [Google Scholar]
- Egger V, Feldmeyer D, Sakmann B. Coincidence detection and changes of synaptic efficacy in spiny stellate neurons in rat barrel cortex. Nat Neurosci. 1999;2:1098–1105. doi: 10.1038/16026. [DOI] [PubMed] [Google Scholar]
- Engert F, Bonhoeffer T. Dendritic spine changes associated with hippocampal long-term synaptic plasticity. Nature. 1999;399:66–70. doi: 10.1038/19978. [DOI] [PubMed] [Google Scholar]
- Feldman DE. Timing-based LTP and LTD at vertical inputs to layer II/III pyramidal cells in rat barrel cortex. Neuron. 2000;27:45–56. doi: 10.1016/s0896-6273(00)00008-8. [DOI] [PubMed] [Google Scholar]
- Feldman DE. Synaptic mechanisms for plasticity in neocortex. Annu Rev Neurosci. 2009;32:33–55. doi: 10.1146/annurev.neuro.051508.135516. [DOI] [PMC free article] [PubMed] [Google Scholar]
- Feldman DE, Nicoll RA, Malenka RC. Synaptic plasticity at thalamocortical synapses in developing rat somatosensory cortex: LTP, LTD, and silent synapses. J Neurobiol. 1999;41:92–101. [PubMed] [Google Scholar]
- Feldmeyer D, Egger V, Lubke J, Sakmann B. Reliable synaptic connections between pairs of excitatory layer 4 neurones within a single “barrel” of developing rat somatosensory cortex. J Physiol. 1999;521:169–190. doi: 10.1111/j.1469-7793.1999.00169.x. [DOI] [PMC free article] [PubMed] [Google Scholar]
- Frey U, Morris RG. Synaptic tagging and long-term potentiation. Nature. 1997;385:533–536. doi: 10.1038/385533a0. [DOI] [PubMed] [Google Scholar]
- Froemke RC, Dan Y. Spike-timing-dependent synaptic modification induced by natural spike trains. Nature. 2002;416:433–438. doi: 10.1038/416433a. [DOI] [PubMed] [Google Scholar]
- Froemke RC, Poo MM, Dan Y. Spike-timing-dependent synaptic plasticity depends on dendritic location. Nature. 2005;434:221–225. doi: 10.1038/nature03366. [DOI] [PubMed] [Google Scholar]
- Froemke RC, Tsay IA, Raad M, Long JD, Dan Y. Contribution of individual spikes in burst-induced long-term synaptic modification. J Neurophysiol. 2006;95:1620–1629. doi: 10.1152/jn.00910.2005. [DOI] [PubMed] [Google Scholar]
- Gilbert CD, Wiesel TN. Receptive field dynamics in adult primary visual cortex. Nature. 1992;356:150–152. doi: 10.1038/356150a0. [DOI] [PubMed] [Google Scholar]
- Haghikia A, Mergia E, Friebe A, Eysel UT, Koesling D, Mittmann T. Long-term potentiation in the visual cortex requires both nitric oxide receptor guanylyl cyclases. J Neurosci. 2007;27:818–823. doi: 10.1523/JNEUROSCI.4706-06.2007. [DOI] [PMC free article] [PubMed] [Google Scholar]
- Hardingham N, Fox K. The role of nitric oxide and GluR1 in presynaptic and postsynaptic components of neocortical potentiation. J Neurosci. 2006;26:7395–7404. doi: 10.1523/JNEUROSCI.0652-06.2006. [DOI] [PMC free article] [PubMed] [Google Scholar]
- Hardingham NR, Hardingham GE, Fox KD, Jack JJ. Presynaptic efficacy directs normalization of synaptic strength in layer 2/3 rat neocortex after paired activity. J Neurophysiol. 2007;97:2965–2975. doi: 10.1152/jn.01352.2006. [DOI] [PubMed] [Google Scholar]
- Harkness JE, Wagner JE. Baltimore: Williams and Wilkins; 1995. The biology and medicine of rabbits and rodents. [Google Scholar]
- Hayashi Y, Shi SH, Esteban JA, Piccini A, Poncer JC, Malinow R. Driving AMPA receptors into synapses by LTP and CaMKII: requirement for GluR1 and PDZ domain interaction. Science. 2000;287:2262–2267. doi: 10.1126/science.287.5461.2262. [DOI] [PubMed] [Google Scholar]
- Hendry SH, Jones EG, Emson PC, Lawson DE, Heizmann CW, Streit P. Two classes of cortical GABA neurons defined by differential calcium binding protein immunoreactivities. Exp Brain Res. 1989;76:467–472. doi: 10.1007/BF00247904. [DOI] [PubMed] [Google Scholar]
- Heynen AJ, Bear MF. Long-term potentiation of thalamocortical transmission in the adult visual cortex in vivo. J Neurosci. 2001;21:9801–9813. doi: 10.1523/JNEUROSCI.21-24-09801.2001. [DOI] [PMC free article] [PubMed] [Google Scholar]
- Heynen AJ, Abraham WC, Bear MF. Bidirectional modification of CA1 synapses in the adult hippocampus in vivo. Nature. 1996;381:163–166. doi: 10.1038/381163a0. [DOI] [PubMed] [Google Scholar]
- Hof PR, Glezer II, Cond é F, Flagg RA, Rubin MB, Nimchinsky EA, Vogt Weisenhorn DM. Cellular distribution of the calcium-binding proteins parvalbumin, calbindin, and calretinin in the neocortex of mammals: phylogenetic and developmental patterns. J Chem Neuroanat. 1999;16:77–116. doi: 10.1016/s0891-0618(98)00065-9. [DOI] [PubMed] [Google Scholar]
- Hoshino O. Neuronal bases of perceptual learning revealed by a synaptic balance scheme. Neural Comput. 2004;16:563–594. doi: 10.1162/089976604772744910. [DOI] [PubMed] [Google Scholar]
- Huang J, Wyse JP, Spira AW. Ontogenesis of the electroretinogram in a precocial mammal, the guinea pig (Cavia porcellus) Comp Biochem Physiol A Comp Physiol. 1990;95:149–155. doi: 10.1016/0300-9629(90)90024-m. [DOI] [PubMed] [Google Scholar]
- Huang YY, Colino A, Selig DK, Malenka RC. The influence of prior synaptic activity on the induction of long-term potentiation. Science. 1992;255:730–733. doi: 10.1126/science.1346729. [DOI] [PubMed] [Google Scholar]
- Ismailov I, Kalikulov D, Inoue T, Friedlander MJ. The kinetic profile of intracellular calcium predicts long-term potentiation and long-term depression. J Neurosci. 2004;24:9847–9861. doi: 10.1523/JNEUROSCI.0738-04.2004. [DOI] [PMC free article] [PubMed] [Google Scholar]
- Kaas JH, Krubitzer LA, Chino YM, Langston AL, Polley EH, Blair N. Reorganization of retinotopic cortical maps in adult mammals after lesions of the retina. Science. 1990;248:229–231. doi: 10.1126/science.2326637. [DOI] [PubMed] [Google Scholar]
- Kampa BM, Letzkus JJ, Stuart GJ. Requirement of dendritic calcium spikes for induction of spike-timing-dependent synaptic plasticity. J Physiol. 2006;574:283–290. doi: 10.1113/jphysiol.2006.111062. [DOI] [PMC free article] [PubMed] [Google Scholar]
- Karmarkar UR, Dan Y. Experience-dependent plasticity in adult visual cortex. Neuron. 2006;52:577–585. doi: 10.1016/j.neuron.2006.11.001. [DOI] [PubMed] [Google Scholar]
- Kato K, Clifford DB, Zorumski CF. Long-term potentiation during whole-cell recording in rat hippocampal slices. Neuroscience. 1993;53:39–47. doi: 10.1016/0306-4522(93)90282-k. [DOI] [PubMed] [Google Scholar]
- Kawaguchi Y, Kondo S. Parvalbumin, somatostatin and cholecystokinin as chemical markers for specific GABAergic interneuron types in the rat frontal cortex. J Neurocytol. 2002;31:277–287. doi: 10.1023/a:1024126110356. [DOI] [PubMed] [Google Scholar]
- Kerchner GA, Nicoll RA. Silent synapses and the emergence of a postsynaptic mechanism for LTP. Nat Rev Neurosci. 2008;9:813–825. doi: 10.1038/nrn2501. [DOI] [PMC free article] [PubMed] [Google Scholar]
- Kind PC, Mitchell DE, Ahmed B, Blakemore C, Bonhoeffer T, Sengpiel F. Correlated binocular activity guides recovery from monocular deprivation. Nature. 2002;416:430–433. doi: 10.1038/416430a. [DOI] [PubMed] [Google Scholar]
- Kirkwood A, Bear MF. Hebbian synapses in visual cortex. J Neurosci. 1994;14:1634–1645. doi: 10.1523/JNEUROSCI.14-03-01634.1994. [DOI] [PMC free article] [PubMed] [Google Scholar]
- Kirkwood A, Lee HK, Bear MF. Co-regulation of long-term potentiation and experience-dependent synaptic plasticity in visual cortex by age and experience. Nature. 1995;375:328–331. doi: 10.1038/375328a0. [DOI] [PubMed] [Google Scholar]
- Kreitzer AC, Regehr WG. Retrograde inhibition of presynaptic calcium influx by endogenous cannabinoids at excitatory synapses onto Purkinje cells. Neuron. 2001;29:717–727. doi: 10.1016/s0896-6273(01)00246-x. [DOI] [PubMed] [Google Scholar]
- Kullmann DM. Applications of the expectation-maximization algorithm to quantal analysis of postsynaptic potentials. J Neurosci Methods. 1989;30:231–245. doi: 10.1016/0165-0270(89)90134-9. [DOI] [PubMed] [Google Scholar]
- Larkman A, Hannay T, Stratford K, Jack J. Presynaptic release probability influences the locus of long-term potentiation. Nature. 1992;360:70–73. doi: 10.1038/360070a0. [DOI] [PubMed] [Google Scholar]
- Lee HK, Barbarosie M, Kameyama K, Bear MF, Huganir RL. Regulation of distinct AMPA receptor phosphorylation sites during bidirectional synaptic plasticity. Nature. 2000;405:955–959. doi: 10.1038/35016089. [DOI] [PubMed] [Google Scholar]
- Li W, Piëch V, Gilbert CD. Learning to link visual contours. Neuron. 2008;57:442–451. doi: 10.1016/j.neuron.2007.12.011. [DOI] [PMC free article] [PubMed] [Google Scholar]
- Liao D, Hessler NA, Malinow R. Activation of postsynaptically silent synapses during pairing-induced LTP in CA1 region of hippocampal slice. Nature. 1995;375:400–404. doi: 10.1038/375400a0. [DOI] [PubMed] [Google Scholar]
- Liu CH, Heynen AJ, Shuler MG, Bear MF. Cannabinoid receptor blockade reveals parallel plasticity mechanisms in different layers of mouse visual cortex. Neuron. 2008;58:340–345. doi: 10.1016/j.neuron.2008.02.020. [DOI] [PubMed] [Google Scholar]
- Maffei A, Nelson SB, Turrigiano GG. Selective reconfiguration of layer 4 visual cortical circuitry by visual deprivation. Nat Neurosci. 2004;7:1353–1359. doi: 10.1038/nn1351. [DOI] [PubMed] [Google Scholar]
- Malinow R. Transmission between pairs of hippocampal slice neurons: quantal levels, oscillations, and LTP. Science. 1991;252:722–724. doi: 10.1126/science.1850871. [DOI] [PubMed] [Google Scholar]
- Manabe T, Nicoll RA. Long-term potentiation: evidence against an increase in transmitter release probability in the CA1 region of the hippocampus. Science. 1994;265:1888–1892. doi: 10.1126/science.7916483. [DOI] [PubMed] [Google Scholar]
- Martin KA. Microcircuits in visual cortex. Curr Opin Neurobiol. 2002;12:418–425. doi: 10.1016/s0959-4388(02)00343-4. [DOI] [PubMed] [Google Scholar]
- McCormick DA, Connors BW, Lighthall JW, Prince DA. Comparative electrophysiology of pyramidal and sparsely spiny stellate neurons of the neocortex. J Neurophysiol. 1985;54:782–806. doi: 10.1152/jn.1985.54.4.782. [DOI] [PubMed] [Google Scholar]
- Meliza CD, Dan Y. Receptive-field modification in rat visual cortex induced by paired visual stimulation and single-cell spiking. Neuron. 2006;49:183–189. doi: 10.1016/j.neuron.2005.12.009. [DOI] [PubMed] [Google Scholar]
- Miller KD, Keller JB, Stryker MP. Ocular dominance column development: analysis and simulation. Science. 1989;245:605–615. doi: 10.1126/science.2762813. [DOI] [PubMed] [Google Scholar]
- Montague PR, Gancayco CD, Winn MJ, Marchase RB, Friedlander MJ. Role of NO production in NMDA receptor-mediated neurotransmitter release in cerebral cortex. Science. 1994;263:973–977. doi: 10.1126/science.7508638. [DOI] [PubMed] [Google Scholar]
- Montgomery JM, Madison DV. State-dependent heterogeneity in synaptic depression between pyramidal cell pairs. Neuron. 2002;33:765–777. doi: 10.1016/s0896-6273(02)00606-2. [DOI] [PubMed] [Google Scholar]
- Montgomery JM, Pavlidis P, Madison DV. Pair recordings reveal all-silent synaptic connections and the postsynaptic expression of long-term potentiation. Neuron. 2001;29:691–701. doi: 10.1016/s0896-6273(01)00244-6. [DOI] [PubMed] [Google Scholar]
- Mu Y, Poo MM. Spike timing-dependent LTP/LTD mediates visual experience-dependent plasticity in a developing retinotectal system. Neuron. 2006;50:115–125. doi: 10.1016/j.neuron.2006.03.009. [DOI] [PubMed] [Google Scholar]
- Nägerl UV, Eberhorn N, Cambridge SB, Bonhoeffer T. Bidirectional activity-dependent morphological plasticity in hippocampal neurons. Neuron. 2004;44:759–767. doi: 10.1016/j.neuron.2004.11.016. [DOI] [PubMed] [Google Scholar]
- Ninan I, Liu S, Rabinowitz D, Arancio O. Early presynaptic changes during plasticity in cultured hippocampal neurons. EMBO J. 2006;25:4361–4371. doi: 10.1038/sj.emboj.7601318. [DOI] [PMC free article] [PubMed] [Google Scholar]
- Park M, Penick EC, Edwards JG, Kauer JA, Ehlers MD. Recycling endosomes supply AMPA receptors for LTP. Science. 2004;305:1972–1975. doi: 10.1126/science.1102026. [DOI] [PubMed] [Google Scholar]
- Peters A, Payne BR, Budd J. A numerical analysis of the geniculocortical input to striate cortex in the monkey. Cereb Cortex. 1994;4:215–229. doi: 10.1093/cercor/4.3.215. [DOI] [PubMed] [Google Scholar]
- Philpot BD, Espinosa JS, Bear MF. Evidence for altered NMDA receptor function as a basis for metaplasticity in visual cortex. J Neurosci. 2003;23:5583–5588. doi: 10.1523/JNEUROSCI.23-13-05583.2003. [DOI] [PMC free article] [PubMed] [Google Scholar]
- Porter JT, Johnson CK, Agmon A. Diverse types of interneurons generate thalamus-evoked feedforward inhibition in the mouse barrel cortex. J Neurosci. 2001;21:2699–2710. doi: 10.1523/JNEUROSCI.21-08-02699.2001. [DOI] [PMC free article] [PubMed] [Google Scholar]
- Ramcharan EJ, Gnadt JW, Sherman SM. Burst and tonic firing in thalamic cells of unanesthetized, behaving monkeys. Vis Neurosci. 2000;17:55–62. doi: 10.1017/s0952523800171056. [DOI] [PubMed] [Google Scholar]
- Rizo J, Rosenmund C. Synaptic vesicle fusion. Nat Struct Mol Biol. 2008;15:665–674. doi: 10.1038/nsmb.1450. [DOI] [PMC free article] [PubMed] [Google Scholar]
- Rosenmund C, Sigler A, Augustin I, Reim K, Brose N, Rhee JS. Differential control of vesicle priming and short-term plasticity by Munc13 isoforms. Neuron. 2002;33:411–424. doi: 10.1016/s0896-6273(02)00568-8. [DOI] [PubMed] [Google Scholar]
- Rossner MJ, Hirrlinger J, Wichert SP, Boehm C, Newrzella D, Hiemisch H, Eisenhardt G, Stuenkel C, von Ahsen O, Nave KA. Global transcriptome analysis of genetically identified neurons in the adult cortex. J Neurosci. 2006;26:9956–9966. doi: 10.1523/JNEUROSCI.0468-06.2006. [DOI] [PMC free article] [PubMed] [Google Scholar]
- Sáez I, Friedlander MJ. Synaptic output of individual layer 4 neurons in guinea pig visual cortex. J Neurosci. 2009;29:4930–4944. doi: 10.1523/JNEUROSCI.0046-09.2009. [DOI] [PMC free article] [PubMed] [Google Scholar]
- Schoups A, Vogels R, Qian N, Orban G. Practising orientation identification improves orientation coding in V1 neurons. Nature. 2001;412:549–553. doi: 10.1038/35087601. [DOI] [PubMed] [Google Scholar]
- Seol GH, Ziburkus J, Huang S, Song L, Kim IT, Takamiya K, Huganir RL, Lee HK, Kirkwood A. Neuromodulators control the polarity of spike-timing-dependent synaptic plasticity. Neuron. 2007;55:919–929. doi: 10.1016/j.neuron.2007.08.013. [DOI] [PMC free article] [PubMed] [Google Scholar]
- Shatz CJ. Impulse activity and the patterning of connections during CNS development. Neuron. 1990;5:745–756. doi: 10.1016/0896-6273(90)90333-b. [DOI] [PubMed] [Google Scholar]
- Sherman SM. Tonic and burst firing: dual modes of thalamocortical relay. Trends Neurosci. 2001;24:122–126. doi: 10.1016/s0166-2236(00)01714-8. [DOI] [PubMed] [Google Scholar]
- Sherman SM. Thalamic relays and cortical functioning. Prog Brain Res. 2005;149:107–126. doi: 10.1016/S0079-6123(05)49009-3. [DOI] [PubMed] [Google Scholar]
- Sjöström PJ, Turrigiano GG, Nelson SB. Rate, timing, and cooperativity jointly determine cortical synaptic plasticity. Neuron. 2001;32:1149–1164. doi: 10.1016/s0896-6273(01)00542-6. [DOI] [PubMed] [Google Scholar]
- Sjöström PJ, Turrigiano GG, Nelson SB. Neocortical LTD via coincident activation of presynaptic NMDA and cannabinoid receptors. Neuron. 2003;39:641–654. doi: 10.1016/s0896-6273(03)00476-8. [DOI] [PubMed] [Google Scholar]
- Smith GB, Heynen AJ, Bear MF. Bidirectional synaptic mechanisms of ocular dominance plasticity in visual cortex. Philos Trans R Soc Lond B Biol Sci. 2009;364:357–367. doi: 10.1098/rstb.2008.0198. [DOI] [PMC free article] [PubMed] [Google Scholar]
- Song S, Sjöström PJ, Reigl M, Nelson S, Chklovskii DB. Highly nonrandom features of synaptic connectivity in local cortical circuits. PLoS Biol. 2005;3:e68. doi: 10.1371/journal.pbio.0030068. [DOI] [PMC free article] [PubMed] [Google Scholar]
- Stern EA, Maravall M, Svoboda K. Rapid development and plasticity of layer 2/3 maps in rat barrel cortex in vivo. Neuron. 2001;31:305–315. doi: 10.1016/s0896-6273(01)00360-9. [DOI] [PubMed] [Google Scholar]
- Stevens CF, Wang Y. Changes in reliability of synaptic function as a mechanism for plasticity. Nature. 1994;371:704–707. doi: 10.1038/371704a0. [DOI] [PubMed] [Google Scholar]
- Stratford KJ, Tarczy-Hornoch K, Martin KA, Bannister NJ, Jack JJ. Excitatory synaptic inputs to spiny stellate cells in cat visual cortex. Nature. 1996;382:258–261. doi: 10.1038/382258a0. [DOI] [PubMed] [Google Scholar]
- Stricker C, Redman SJ. Quantal analysis based on density estimation. J Neurosci Methods. 2003;130:159–171. doi: 10.1016/j.jneumeth.2003.09.021. [DOI] [PubMed] [Google Scholar]
- Sugino K, Hempel CM, Miller MN, Hattox AM, Shapiro P, Wu C, Huang ZJ, Nelson SB. Molecular taxonomy of major neuronal classes in the adult mouse forebrain. Nat Neurosci. 2006;9:99–107. doi: 10.1038/nn1618. [DOI] [PubMed] [Google Scholar]
- Supèr H, Spekreijse H, Lamme VA. A neural correlate of working memory in the monkey primary visual cortex. Science. 2001;293:120–124. doi: 10.1126/science.1060496. [DOI] [PubMed] [Google Scholar]
- Tarczy-Hornoch K, Martin KA, Stratford KJ, Jack JJ. Intracortical excitation of spiny neurons in layer 4 of cat striate cortex in vitro. Cereb Cortex. 1999;9:833–843. doi: 10.1093/cercor/9.8.833. [DOI] [PubMed] [Google Scholar]
- Toni N, Buchs PA, Nikonenko I, Bron CR, Muller D. LTP promotes formation of multiple spine synapses between a single axon terminal and a dendrite. Nature. 1999;402:421–425. doi: 10.1038/46574. [DOI] [PubMed] [Google Scholar]
- Torii N, Tsumoto T, Uno L, Astrelin AV, Voronin LL. Quantal analysis suggests presynaptic involvement in expression of neocortical short- and long-term depression. Neuroscience. 1997;79:317–321. doi: 10.1016/s0306-4522(97)00129-2. [DOI] [PubMed] [Google Scholar]
- Tsanov M, Manahan-Vaughan D. Intrinsic, light-independent and visual activity-dependent mechanisms cooperate in the shaping of the field response in rat visual cortex. J Neurosci. 2007;27:8422–8429. doi: 10.1523/JNEUROSCI.1180-07.2007. [DOI] [PMC free article] [PubMed] [Google Scholar]
- Tsujimoto T, Jeromin A, Saitoh N, Roder JC, Takahashi T. Neuronal calcium sensor 1 and activity-dependent facilitation of P/Q-type calcium currents at presynaptic nerve terminals. Science. 2002;295:2276–2279. doi: 10.1126/science.1068278. [DOI] [PubMed] [Google Scholar]
- Voronin LL, Kuhnt U, Hess G, Gusev AG, Roschin V. Quantal parameters of “minimal” excitatory postsynaptic potentials in guinea pig hippocampal slices: binomial approach. Exp Brain Res. 1992;89:248–264. doi: 10.1007/BF00228242. [DOI] [PubMed] [Google Scholar]
- Wang HX, Gerkin RC, Nauen DW, Bi GQ. Coactivation and timing-dependent integration of synaptic potentiation and depression. Nat Neurosci. 2005;8:187–193. doi: 10.1038/nn1387. [DOI] [PubMed] [Google Scholar]
- Ward B, McGuinness L, Akerman CJ, Fine A, Bliss TV, Emptage NJ. State-dependent mechanisms of LTP expression revealed by optical quantal analysis. Neuron. 2006;52:649–661. doi: 10.1016/j.neuron.2006.10.007. [DOI] [PubMed] [Google Scholar]
- Wiesel TN, Hubel DH. Single-cell responses in striate cortex of kittens deprived of vision in one eye. J Neurophysiol. 1963;26:1003–1017. doi: 10.1152/jn.1963.26.6.1003. [DOI] [PubMed] [Google Scholar]
- Yoshimura Y, Ohmura T, Komatsu Y. Two forms of synaptic plasticity with distinct dependence on age, experience, and NMDA receptor subtype in rat visual cortex. J Neurosci. 2003;23:6557–6566. doi: 10.1523/JNEUROSCI.23-16-06557.2003. [DOI] [PMC free article] [PubMed] [Google Scholar]