

Abstract
We have developed miniature (≈1 μm diameter) microcavity surface-plasmon-resonance sensors (MSPRS), integrated them with microfluidics and tested their sensitivity to refractive-index changes. We tested their biosensing capability by distinguishing the interaction of glucose oxidase (Mr 160 kDa) with its natural substrate (β-D-glucose, Mr 180 Da) from its interactions with non-specific substrates (L-glucose, D-mannose and 2-deoxy-D-glucose). We ran the identical protocol we had used with the MSPRS on a Biacore 3000 instrument using their bare gold chip. Only the MSPRS was able to detect β-D-glucose binding to glucose oxidase. Each MSPRS can detect the binding to its surface of fewer than 35,000 glucose-oxidase molecules (representing 9.6 fg or 60 zmol of protein), about 106 times fewer than classical surface-plasmon-resonance biosensors.
Introduction
Systems-level understanding of the function and malfunction of cells and organisms requires comprehensive models based on maps of all interactions between all components: DNA, RNA, proteins, metabolites, hormones, ions, small molecules, etc.. Mapping the complete interaction network (interactomics) requires gathering kinetic information on hundreds of millions of interactions. Current efforts to map important networks address yeast,1-3 Caenorhabditis elegans,4 Drosophila,5, 6 humans7 and other organisms.8-10 Drug discovery also requires quantitative mapping of the interactions of the multitudes of small molecules in drug libraries against libraries of proteins present in an organism. No current biosensor technology combines the sensitivity, kinetic measurement and throughput which interactomics needs. While much current research attempts to improve biosensor sensitivity,11 other sensor characteristics are also important. The ideal biosensor would (1) be sensitive and non-invasive to permit use in a wide range of applications, (2) allow real-time, label-free measurements to provide kinetic data for interaction mapping, (3) be small and integrate with microfluidics to reduce reagent usage, making analyses quick, cheap and accurate, (4) integrate into 2-D (possibly 3-D) arrays to provide the high throughput drug discovery and interactomics mapping requires, (5) be easy and inexpensive to manufacture, (6) be highly reproducible sensor-to-sensor and chip-to-chip, and (7) allow a simple, cheap and robust instrument design to read the sensors and analyze the data.
Surface plasmon (SP) resonance (SPR) is a well-known physical phenomenon which has enabled powerful technologies for optoelectronics,12, 13 bioanalysis,14 and super-resolution imaging.15, 16 For biomolecular-interaction analysis, classical SPR sensors are valued for their ability to monitor molecular binding without labels and in real-time.17 However, planar SPR sensors are large (≈1.2 mm2)18 compared to the microfluidic scales which are becoming common in biochemical analysis. Shrinking the active surface of a planar SPR sensor reduces its sensitivity because the SP wave (SPW) must propagate several propagation lengths for the SPR angle of incidence to change detectably. SPR instruments are also large; the basic planar SPR setup requires well-defined polarization, incidence angle and collimation of the incident light for efficient conversion of light into plasmons.
This paper presents the microcavity surface-plasmon-resonance sensor (MSPRS), a 1 μm diameter (≈2.5 μm2 surface), label-free, optical biosensor for studying biomolecular binding kinetics, whose size allows easy microfluidics integration.
In MSPRSs, stationary SPWs confined in a metal shell wrapped around a sub-micrometer dielectric nanosphere replace the propagating SPWs of planar SPR sensors.19 These stationary SPWs traverse the active metal-film surface a number of times proportional to the quality-factor of the resonance, increasing the interaction probability between the waves and surface adsorbate via so-called shape resonance19-21 and so enhancing sensitivity. MSPRSs are too small to excite the whispering gallery modes seen in 10–100 μm dielectric structures20-22 and orders of magnitude larger than the nanoparticles or nanoshells (structures ranging in size from a few nanometers to several hundred nanometers and always much smaller than the incident-light wavelength), which generate localized surface-plasmon resonances.23-26 Stationary SPWs also eliminate classical geometric and polarization requirements for SPW excitation, allowing straight-line transmission detection (excitation source-MSPRS-detector).
We studied the proprieties of microcavity resonances generated by 780 nm polystyrene spheres placed on a flat cover-glass surface and argon-ion sputtered with a ≈120 nm layer of gold. Each MSPRS has a sub-wavelength pinhole where the nanosphere touches the glass substrate, with a sharp cusp in the gold layer deep beneath the nanosphere. Effectively, a spherical gold shell covers the nanosphere and a planar layer covers the glass substrate. The cusp produces high-intensity electromagnetic fields similar to those between a nanostructure and a nearby semi-infinite metallic plane.27-29
To demonstrate the integration of MSPRSs with microfluidics, we built a simple, T-type, microfluidic device with two input-channels feeding a microchamber (0.2 μL) containing MSPRSs. This device allowed sample flow rates of 0.5 nL/s and sample volumes down to 5 μL under hydrostatically-driven flow. For comparison, a Biacore 3000 instrument requires a minimum 35 μL sample volume of which only 5 μL is effectively injected into the chamber containing the SPR sensing surface. The Biacore 3000 allows sample flow rates in the range 1–100 μL/min. Therefore, our method allows experiments of ≈180 min using 5 μL of reagent, while the Biacore 3000 allows only 5 min using 5 μL of reagent, saving potentially expensive or hard-to-synthesize reagents, while simultaneously improving detection accuracy and data reproducibility.
To determine MSPRS sensitivity we chose the interaction model of glucose oxidase (GOx) with β-D-glucose (βD-Glu), L-glucose (L-Glu), D-mannose (D-Man) and 2-deoxy-D-glucose (2Do-Glu). These well-studied interactions are fast, so the time each substrate molecule remains bound to the enzyme is short. In addition, while the metabolism of βD-Glu by GOx is medically significant, the binding of a small analyte molecule (180 Da) to a large target enzyme (160 kDa) is difficult to observe with other technologies.
Experimental Section
MSPRS Substrate Preparation
We manufactured the MSPRSs on No. 1½ cover-glass (50 × 24 × 0.18 mm, VWR) which were rinsed with methanol (reagent grade, Sigma-Aldrich), then rinsed with deionized water (DI-water, 18 MΩcm, Super-Q Plus, Millipore Corp.), cleaned in NH4OH/H2O2/HNO3 (1:1:1) for one hour, rinsed with DI-water and dried with nitrogen. The methanol solution of polystyrene nanospheres (780 ± 5.9 nm diameter) had ≈104 nanospheres/μL. With a micropipette, we dispensed 70 μL of solution onto each cover-glass, dried them at low vacuum (≈1 Torr) for one hour and then stored them individually in Petri dishes, producing a random distribution of nanospheres 10–20 μm apart. We covered the cover-glasses with a copper mask with oval slits above their nanosphere regions, placed them in a sputter coater (Polaron E5100) and uniformly coated them with 120 ± 20 nm of gold (≈0.06 Torr vacuum, 20 mA discharge). Removing the copper mask left a 3 × 10 mm gold domain on each cover-glass. We selected for further use substrates showing consistent metal deposition, i.e., uniform optical transmission throughout the gold layer.
Master Fabrication
We fabricated the microfluidic stamps (masters), used for replica molding, on glass slides (75 × 50 × 1 mm, Corning) cleaned in HCl/HNO3 (3:1), then rinsed with DI-water, dried with nitrogen, sonicated in methanol and dried with nitrogen. We used two photoresist (SU-8 2010, MicroChem Corp.) layers. The first layer (≈20 μm thick) promoted the adhesion of the channel structure to the glass. The second layer (≈20 μm thick) became the channel structure. Both layers were processed identically, except that first layer was exposed without a photomask. The photoresist was spin-coated (P6708, Speedline Technologies) onto the substrate by ramping at 40 rpm/s to 1000 rpm and holding at 1000 rpm for 30 s. Prior to exposure, the photoresist was prebaked on a digital hot-plate (732P, PMC Industries) at 65 °C for 1 min, ramped to 95 °C at 100 °C/h and held at 95 °C for 3 min. The microfluidic pattern was designed using AutoCAD LT 2004 (AutoDesk, Inc.), printed on a transparency using a high-resolution laser photoplotter (40,640 dpi, Photoplot Store) and contact-printed onto the photoresist using UV-light (365 nm, 300 mJ/cm2, 205S, Optical Associates, Inc.) from a high-pressure Hg-arc lamp and an additional 360 nm band filter (fwhm 45 nm, Edmund Optics, Inc.). The exposed photoresist was postbaked at 65 °C for 1 min, ramped at 300 °C/h to 95 °C and held for 1 min. We then developed the unexposed photoresist for 10 min, rinsed with 2-propanol and dried with nitrogen. The SU-8 master height was 19.4 ± 0.2 μm (n = 10) across the structure as measured with a stylus profiler (Dektak 6M, Veeco Instruments, Inc.).
Channel Fabrication
We cast microchannels in poly(dimethylsiloxane) (PDMS) substrates, using the SU-8 master. The polymer base and the curing agent (Sylgard 184 Silicone Kit, Dow Corning Corp.) were mixed at a ratio of 10:1 (m/m) for 3 min. A tape barrier placed around the mold held the elastomer mixture in place as we poured it onto the master. We then placed the mold under low vacuum (≈1 Torr) for one hour to enhance channel replication, cured it at 100 °C for 30 min and then immediately separated the hot polymerized PDMS-substrate from the master. This technique avoided the need for SU-8 master silanization.30, 31
The channel design was a simple T-type intersection with two 50 μm wide inputs, one for buffer injection and one for reagent injection, both connecting into a main chamber. We collected the waste at the opposite end of the main chamber. Microfluidic channels terminated in 2 mm diameter disks into which we punched fluid access holes through the elastomer using 16-gauge titanium-nitride-coated needles for clean, accurate cuts. PDMS-substrates were rinsed with methanol, then dried with nitrogen, to remove any surface debris, postbaked for 24 hours at 120 °C, to remove any volatiles or unpolymerized residues, and stored in Petri dishes.
Chip Assembly
We exposed the MSPRS substrates to air plasma (PDC-32G, Harrick Plasma) for 3 min to remove any surface impurities, then simultaneously exposed the MSPRSs and PDMS substrates to air plasma for 40 s and joined them permanently. This assembly, with the MSPRSs at the bottom and the PDMS microfluidics on top constitutes a chip. The chip has a buffer-input channel and a reagent-input channel feeding a common MSPRS chamber (1 mm × 10 mm) containing more than 5000 randomly distributed MSPRSs (Figure S-1b). Our studies showed that MSPRS chambers as narrow as 20–50 μm wide are practical. Priming the chip with running buffer through the waste reservoir minimized bubble formation and uniformly wet the channels.
Flow Control
We used pressure-driven flow to bring buffer and reagent solution into contact with the MSPRSs. Input-channel ends were connected to a common 25 mL graduated cylinder using valved 1.6 mm o.d. polypropylene tubing.30, 31 The MSPRS-chamber end was connected to a 25 mL graduated wastecylinder also controlled by a valve (Figure S-1b). The diameter of the 25 mL graduated cylinders was so large that the fluid level did not change noticeably during the experiments. We used two sets of buffers in our experiments: rinsing buffers and running buffers. The running buffer filled the graduated cylinders and most of the tubing and we ran it continuously through the chip between experiments to keep the MSPRS surface clean and the chip bubble-free. Before each experiment, using a 10 μL Hamilton syringe we backfilled the end of the reagent-input tubing with 2–10 μL of reagent solution and the end of the buffer-input tubing with 2–10 μL of rinsing buffer. To eliminate flow fluctuations in the chip due to accidental vibration of the tubing, we injected a ≈1 μL air-bubble into each input-tube, to serve as a damper and to separate reagent and rinsing buffer in the input tubing from the running buffer in the graduated cylinder.
We defined the reference level as the height of the fluid in the waste cylinder. We maintained constant flow through the chip at all times by adjusting the relative height (△H) of the liquid level in the input graduated cylinder with respect to the reference level. Raising the graduated-cylinder liquid level to △H = 77 mm produced a flow of 0.5 nL/s through the chip, which we calculated by monitoring the movement of an air bubble inside the input tubing over 17 hours. The flow at the MSPRS surface was laminar and unidirectional.
Optical Setup
The experimental setup (Figure S-1a) collected either spectra (to analyze changes in MSPRS resonances due to refractive-index changes in the fluid or to molecular binding to the MSPRS surface), or time series (to monitor analyte binding to target proteins anchored to the MSPRS surface).
We monitored MSPRS-emitted light using an inverted optical microscope (Diaphot, Nikon, Inc.) with its stage custom-modified to accept a T115 Nano-Stage (± 10 nm resolution in all directions) driven by a Nano-Drive (Mad City Labs, Inc). Using the Nano-Stage we could select and align a single MSPRS with the microscope’s optical axis and focal plane and analyze it individually. Small magnets fixed the MSPRS chip to a metal plate, temperature controlled to 24.0 ± 0.1°C, on top of the Nano-Stage.
MSPRSs were illuminated using a DC-950H Dolan-Jenner DC-Regulated Fiber-Optic Illuminator (Edmund Optics, Inc.). In all experiments we set the software-controlled lamp intensity to 90% of its maximum intensity. A fiber-optic (0.5 in. core) light pipe guided the light from the 150 W quartz halogen light bulb to the microscope condenser (0.3 numerical aperture (NA)) through the iris. This setup excited the MSPRSs with white light. The microscope collected the MSPRS-emitted light through a 40× objective (0.85 NA) and fed it into a spectrometer (300 μm slit-width, 500 nm blaze-wavelength, 600 grooves/mm grating, SpectraPro SP-2150i, Acton Research) through an optical fiber. We mounted one end of the fiber on a 5-degree-of-freedom support in front of an exit microscope port and aligned it with the port’s optical axis. The image of one MSPRS (< 100 μm diameter, ≈0.02 NA) at the port fits inside the fiber (600 μm diameter core, 0.34 NA). We connected the other end to the entrance of the spectrometer. At the spectrometer exit slit we mounted an integrated photon-counting photo-multiplier tube (IPC-PMT, PD-473, Acton Research) (Figures S-1a). We used Spectra Sense software (Acton Research) to control the spectrometer’s dispersive element and the detector integration time and to record spectra and time-series at fixed wavelengths. A thermo-isolation box housed the microscope, MSPRS chip and liquid reservoirs. The temperature inside the box was 23.4 ± 0.1°C, with room temperature regulated to 23.3 ± 1°C.
Biochemistry
MSPRSs require surface functionalization to detect specific ligands. For functionalization stability and accuracy, a cross-linker must covalently bind the target protein to the MSPRSs’ gold surfaces.32 We have used several functionalization techniques on plasma-cleaned MSPRSs successfully, most based on short (≈0.6 nm), water-soluble cross-linkers.32-34
After priming the chip with DI-water (Invitrogen Co.), we injected 10 mM cross-linker solution in DI-water. We used 3,3′-dithio-bis(sulfosuccinimidyl propionate) (DTSSP, Calbiochem, EMD Chemicals, Inc.), a water-soluble, homo-, bi-functional, thiol-cleavable zero-length cross-linker that covalently binds to gold surfaces through its disulfide group and to proteins through its amine-reactive N-hydroxysulfosuccinimide (sulfo-NHS) ester. DTSSP hydrolyzes rapidly in aqueous solution and both hydrolysis and conjugation release NHS as a leaving group.34 To minimize cross-linker hydrolysis we injected the target protein within ≈5 min of the cross-linker. We prepared GOx (Mr 160 kDa, from Aspergillus niger, Sigma-Aldrich Co.) solution in DI-water one to two hours before injection, at typical concentrations of 0.78–25 μM in DI-water. The protein covalently links to the gold surface through the cross-linker’s carbon chain. Multiple DTSSPs can anchor the same GOx. After functionalization we verified binding stability by rinsing with DI-water for 30 min and by eluting with 0.1 mM HCl for 5 min (control experiments).
We evaluated GOx activity using four substrates: D-Glu, L-Glu, D-Man (Mr 180.16 Da, Sigma-Aldrich Co.) and 2DoD-Glu (Mr 164.16 Da, Sigma-Aldrich Co.) in four different buffers: 1× phosphate-buffered saline (PBS, Invitrogen Co.), 200 mM L-Glu in PBS 1×, Dulbecco’s Modified Eagle Medium 1× (DMEM, Invitrogen Co.) and 10% Horse Serum (HS, Invitrogen Co.) in DMEM 1×. We rinsed the tubing connecting to the microfluidics with DI-water, eluted it with 0.1 M HCl, rinsed it with DI-water, rinsed it with methanol, rinsed it with DI-water, rinsed it with 0.1 M NaOH and finally thoroughly rinsed it with DI-water before connecting it to a freshly primed MSPRS chip.
Data Analysis
We recorded visible-range spectra (450–750 nm) to characterize the MSPRS response to changes in the media or surface functionalization. We also recorded time series to characterize the reaction kinetics. Spectra were collected at 2 nm resolution with 1 s detector integration time and 5-point running-average smoothing. Kinetics curves were recorded at a fixed 660 nm wavelength (Figures 2a, 3, 4a and 5), with 5 s integration, 7.2 s detector duty-cycle and 15-point running average smoothing (except for the data in Figure 3 (positive axis) which used 50-point running average smoothing).
Figure 2.

(a) (solid line) Emitted-light intensity (at 660 nm) of a single MSPRS during two-step sensor functionalization and (○) exponential-decay best-fits: R2(DTSSP) = 0.985, R2(GOx) = 0.965. We used 0.5 nL/s flows at 24.0 ± 0.1°C. *No signal recorded during sample loading. (b) MSPRS spectra under DI-water: (solid line) before and (dashed line) after DTSSP-GOx-complex binding. The formation of a molecular layer (6 ± 1 nm) red-shifted resonance (IV) by 4 nm. Time series in (a) recorded at 660 nm (vertical line). (c) (solid line) The same two-step bare-gold-surface functionalization monitored using a Biacore 3000 and (○) exponential-decay best-fits: R2(DTSSP) = 0.961, R2(GOx) = 0.987. We used 10 μL/s flows at 25°C. *The Biacore 3000 was on standby during sample loading.
Figure 3.
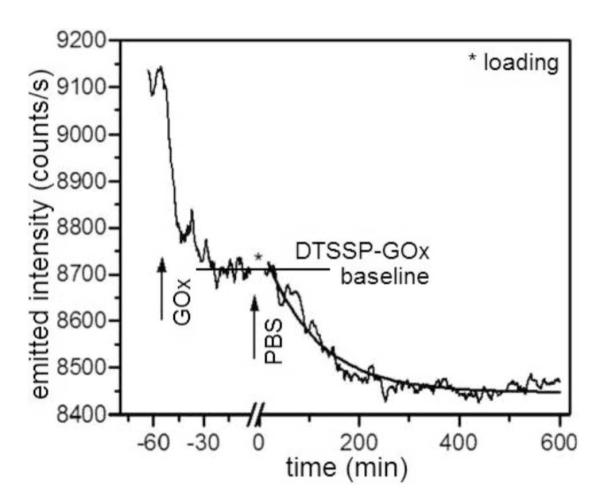
Single-MSPRS emitted-light intensity at 660 nm during GOx conformational changes. We injected 1.56 μM GOx freshly dissolved in DI-water into a DTSSP-functionalized chip, let it reach saturation (≈1 h) then washed in PBS for ≈10 h. An exponential fit gave a 106 ± 1 min relaxation time. *No signal recorded during sample loading.
Figure 4.

(a) Single-MSPRS signal (at 660 nm) during surface-bound GOx (Figure 2a) interaction with L-Glu, 2Do-Glu, D-Man and D-Glu solutions (all substrates dissolved at 100 mM in PBS). Flow rate 0.5 nL/s. Solution temperature 24.0 ± 0.1 °C. The L-Glu signal serves as a control for the effect of the refractive indices of the substrate solutions vs PBS because it does not bind to GOx. D-Glu produces a fast signal change due to the refractive index of the solution followed by a slower change due to formation of the βD-Glu–GOx complex. D-Glu 100 mM in PBS (50 mM βD-Glu equivalent) interacts with GOx. D-Man and 2Do-Glu interact very weakly with GOx. This experiment used the same MSPRS as in Figure 2a,b. (b) Biacore 3000 signals during an equivalent experiment. Flow rate 10 μL/s. Solution Temperature 25°C. We have subtracted the reference-channel signal from the functionalized-channel signal (Figure 2c). The uniform 25 ± 3 RU signal change for all substrates indicates sensitivity to the solutions’ refractive indices, but no detection of βD-Glu–GOx binding.
Figure 5.

Wash-in/wash-out cycles using a single MSPRS showing reproducible GOx–D-Glu interaction detection in different buffers (0.5 nL/s flow rate, 24.0 ± 0.1°C): (a) Differential signal (see Figure S-5) alternating substrate solutions with PBS. The corrected GOx–D-Glu binding signal was 109 ± 22 counts/s. (b) Differential signal alternating substrate solutions with L-Glu. As a second control we ran a four-cycle experiment with 100 mM D-Glu plus 100 mM L-Glu in PBS as the reagent solution and rinsed with 200 mM L-Glu in PBS. Both solutions had the same refractive index. After we subtracted the baseline, the corrected GOx–D-Glu binding signal was 116 ± 21 counts/s. (c) Differential signal alternating substrate solutions with glucose-free DMEM 1x. The corrected GOx–D-Glu-binding signal was 128 ± 29 counts/s. (d) Differential signal alternating substrate solutions with glucose-free 10% HS in glucose-free DMEM 1x. The corrected GOx–D-Glu-binding signal was 112 ± 25 counts/s. Arrows mark the times of reagent or rinsing-buffer injections.
Results and Discussion
Microcavity-Resonance Analysis
Uniformly gold-coated nanospheres (300–800 nm diameters) excited in white light (400–700 nm) emit characteristic wavelengths due to surface-plasmon microcavity amplification. Their emitted spectra change when molecules adsorb to the MSPRS surface allowing molecular interaction monitoring.19 For this study we used a single monodisperse batch of nanospheres (780 ± 6 nm diameter) and a constant gold thickness (120 ± 20 nm). SEM showed an MSPRS-footprint of 1.02 ± 0.05 μm diameter (n = 25) (Figure S-2a). Omni-directional argon-ion sputtering should produce a sub-wavelength nanoaperture at the contact point of the nanosphere with the glass surface. To verify the nanoaperture quality, we mechanically removed a few MSPRSs to expose their underlying nanoapertures. Intensity profile analysis of SEM images (Figure S-2b,c) revealed a typical nanoaperture diameter of 143 ± 8 nm (n = 5) and showed that the gold penetrated deep under the nanospheres to form a sharp cusp. The thickness of the cusp tip was ≈3.2 nm, comparable to the gold-cluster size the sputterer produced.35
Our previous experiments19 injected light through the nanoaperture into the spherical microcavity and collected the emitted light from the gold surface of the MSPRSs (Figure 1a, dashed line). In the present experiments we supplied light to the top of the MSPRSs and collected through the nanoapertures from below (Figure 1a, solid line). Rather surprisingly, the MSPRS spectra are very similar in both cases and the positions of their peaks are the same. The nanoapertures strongly enhance emission with respect to a flat film in both cases. The nanoaperture determines the formation of the microcavity resonances because, when we pre-coated the glass with gold before we deposited the nanospheres, thus closing the nanoapertures, while maintaining the total gold-layer thickness the same, the resonance amplitude decreased as the underlayer thickness increased and disappeared completely for underlayers 50 nm or more in thickness. Exciting the MSPRSs from the top produced a stronger emitted signal and was convenient for our microfluidics integration. Transmission optics is simpler than the reflection optics of classical SPR.
Figure 1.

(a) Spectra of light emitted by one MSPRS in air (120 ± 20 nm gold-coating thickness on 780 ± 6 nm diameter polystyrene nanospheres) excited using white light in two configurations: (solid line) the MSPRS is illuminated from the top of the sensor and the emitted light collected through the nanoaperture and (dashed line) the MSPRS is illuminated through the nanoaperture and the emitted light collected from the top of the sensor. (b) Spectra of MSPRS-emitted light and neighboring bare flat gold (10 μm to left of the MSPRS) under air (n = 1.000) and under DI-water (n = 1.333). (c) Lorentzian fit of the MSPRS-spectrum under air: (solid line) experiment, (○) multi-peak fit (R2 = 0.9964), (△) individual peaks and (dotted line) MSPRS-spectrum under water (experiment). (d) Lorentzian fit of the MSPRS-spectrum under DI-water: (solid line) experiment, (○) multi-peak fit (R2 = 0.9968), (△) individual peaks and (dotted line) MSPRS-spectrum under air (experiment).
The MSPRS emission spectrum in air has five well-defined resonances: (I) 500 ± 1.2 nm, (II) 562.3 ± 0.2 nm, (III) 595.1 ± 0.3 nm, (VI) 639.7 ± 0.3 nm and (V) 706.6 ± 0.4 nm. In water the resonances shift to: (I) 503 ± 1 nm, (II) 568.8 ± 0.3 nm, (III) 596.5 ± 0.2 nm, (IV) 651.9 ± 0.2 nm and (V) 706.8 ± 0.7 nm. We did not study the 706.6 nm peak in detail because our IPC-PMT detector has reduced sensitivity in the NIR.
Figure 1b shows that sample-medium refractive-index changes, e.g., from air (n20 = 1.000) to water (n20 = 1.333), shifted the position and amplitude of the microcavity resonances (II–V), but scarcely affected light transmitted through the flat gold film neighboring the MSPRSs whose spectrum has a single broad peak (I) that shifted negligibly from 499.2 ± 0.2 nm to 499.8 ± 0.2 nm and decreased in intensity by only ≈9.5% relative-to-air (Figures 1b). The light transmitted through the flat gold film is probably not due to surface-plasmon excitation because eq S-1 has no real solution below ≈500 nm for gold (Figure S-3), suggesting that SPWs cannot be excited. In addition, the incident convergent beam (0.3 NA) is not polarized and its axis is perpendicular to the gold surface, which is not optimal for SPW excitation.
The 500 nm peak (I) corresponds to light transmission through the spherical gold shell. It is brighter than the peak for the flat gold film because the MSPRS’s curved surface increases the surface area above the pinhole. Submerging the MSPRS in water (n = 1.333) decreased the apparent peak (I) intensity by 31.3% relative to air. Using a multi-peak Lorentzian fit (R2 = 0.9964) to eliminate the contributions of the neighboring resonances showed a real peak (I) amplitude decrease of only 11.2%, very close to that for a planar gold layer in water. We expected the residual difference, because the incident beam’s numerical aperture depends on the medium’s refractive index. The apparent frequency shift could be the result of fitting errors for the overlapping peaks. The 500 nm peak’s negligible frequency shift and small intensity change make it a bad choice for biosensing.
The microcavity resonances are not present in the bare-flat-gold transmission spectrum. In water, the 562.3 nm peak (II) shifted 6.5 nm to the red and decreased 57.2% in amplitude. The 595.1 nm peak (III) shifted negligibly (1.4 ± 0.5 nm) to the red and increased in intensity by 36.5% (Figures 1c,d). The 639.7 nm peak (IV) shifted 12.2 nm to the red and decreased 41.4% in amplitude. At the fixed wavelengths we used to monitor reaction kinetics (e.g., 562.3 nm and 639.7 nm), the resonance amplitude decreased ≈63% (from air to water). We selected these frequencies because they showed the most sensitivity to refractive-index changes in the medium. In the end, we used the peak (IV) to monitor reaction kinetics because it had the least overlap with neighboring peaks and because it lay in the red–NIR optical window of tissue transparency, which could allow us to use MSPRSs to study complex media like blood, blood plasma and serum in the future.
MSPRS Calibration
Commercial SPR instruments employ one of two metrics to quantify SPR response to refractive-index changes. Biacore instruments correlate the refractive index with the resonance angle measured in response units (RU), while other vendors use refractive-index units (RIU, 1 RU = 106 RIU). To compare our MSPRSs’ sensitivity to bulk refractive-index changes in the medium to the sensitivity of the popular Biacore 3000 required control experiments to convert our detected signal amplitude into Biacore RU. Figure S-4a plots the amplitude change of the MSPRS-emitted signal at 640 nm (peak IV) under various known refractive-index D-Glu aqueous solutions.36 For the experiments protocol see the caption to Figure S-4a. We repeated the experiment using a Biacore 3000 with a bare gold chip (Figure S-4b). Figures S-4a and S-4b together show that 106 RU = 1 RIU = 6.93 ± 0.24 MSPRS units (MSPRS u) for changes in bulk-medium index of refraction. Time-stability experiments on the Biacore 3000 found a 23 RU/h baseline drift (over three hours) and 3–7.5 RU high-frequency noise.
Since the MSPRS-emitted intensity varied linearly (Figure S-4a) with the solution’s refractive index (over the investigated range) analyses which depend on the refractive index (like eq 1) and which use Biacore RU should apply to the MSPRS with appropriate scaling.
Sensor Functionalization
Because surface plasmons detect molecular adsorption to the sensor surface indiscriminately, any SPR-based sensor requires functionalization to provide molecular-interaction specificity. Typically, the sensor’s surface is covered with a target-molecule which interacts specifically with the desired analyte. In classical SPR, target-analyte binding increases the resonance angle following a kinetic equation of form (Figure 2c):
| (1) |
where RSPR(t) is the amount of analyte bound to the SPR detector at time t, RB is the instrument baseline, e.g., the refractive index of the rinsing buffer, R0 is the initial amount of analyte bound at the surface, C is the concentration of analyte, and kon and koff are the association and dissociation kinetic rate constants respectively.37
Our apparatus monitors the emitted intensity at a fixed wavelength. A binding event increases the refractive index at the MSPRS surface, red-shifting the resonance (Figure 2b) and decreasing the emitted intensity (Figure 2a) proportionally to:
| (2) |
where RMSPRS(t) is the amount of analyte bound to the MSPRS at time t.
Figure 2a shows the change in MSPRS-emitted light during the covalent binding of DTSSP cross-linker to the MSPRS’s gold surface. After a 300 s DI-water rinse (which defined our emission-intensity baseline), we stopped the recording, loaded the end of the reagent tubing with reagent, inserted it into the PDMS chip and injected 10 mM DTSSP (in DI-water), monitored the gold-DTSSP covalent binding for 500 s and then rinsed the chip for 300 s with DI-water. We used the maximum concentration of DTSSP soluble in DI-water to cover the gold surface with cross-linker as rapidly as possible.
The saturated gold-DTSSP reaction decreased the MSPRS-emitted intensity at 660 nm by 1,481 counts/s from 2590 counts/s (water baseline) with a S/N = 52.7 (17.2 dB).
Since the cross-linker is much smaller than typical target proteins, linking the target to the cross-linker monolayer produces a dense target-molecule layer.
After depositing the cross-linker, we rinsed the end of the tubing for 10 s with DI-water, eluted it for 10 s with 0.1 mM HCl and rinsed it again with DI-water for 10 s using a 1 mL syringe. We then loaded the tubing end with ≈5 μL GOx solution and reconnected the tubing to the PDMS layer. At 1300 s, we injected 6.25 μM GOx (in DI-water) and monitored the DTSSP-GOx covalent binding for 1700 s as side-chain amino groups on the protein surface reacted with the cross-linker’s sulfo-NHS ester group. After the MSPRS signal reached a stable plateau indicating reaction saturation, we rinsed with DI-water until we recorded no further change in signal (Figure 2a). GOx binding decreased the output signal by 1,424 counts/s from 24470 counts/s (DTSSP baseline) with an S/N = 50.7 (17.1 dB). The signal from the DTSSP-GOx on the MSPRS surface remained stable for 9 days, at which point the gold layer started to wrinkle and detach from the cover-glass, ending the experiment. Figure 2b shows the red-shift in the MSPRS-emission spectrum due to DTSSP-GOx binding to the surface. Fitting the experimental data to exponentials gave reaction times of 209 ± 7 s for gold-DTSSP binding and 211 ± 4 s for DTSSP-GOx binding.
Figure 2c shows the reaction kinetics for the same gold-DTSSP, DTSSP-GOx reactions monitored using a Biacore 3000 with a bare-gold-surface SPR chip. After we loaded the instrument with 300 μL of DTSSP solution, we rinsed the chip with DI-water for 200 s (which defined the baseline), injected 10 mM of DTSSP (in DI-water), monitored the gold-DTSSP covalent binding for 900 s and rinsed the chip for 600 s with DI-water. We then loaded the instrument with 300 μL of GOx solution, rinsed the chip for 200 s with DI-water, injected 6.25 μM of GOx (in DI-water), monitored the DTSSP-GOx covalent binding for 900 s, then rinsed the chip with DI-water for an extended period to show that the GOx had bound permanently to the DTSSP. The DTSSP binding produced a 643 RU signal with an S/N = 107 (20.3 dB) and the GOx binding a 553 RU signal with an S/N = 138 (21.4 dB). Exponential fitting (Figure 2c) yielded reaction times of 184 ± 3 s for the gold-DTSSP binding and 211 ± 4 s for the DTSSP-GOx binding.
The MSPRS measured a gold-DTSSP reaction time ≈12% longer than the Biacore, consistent with our previous findings.19 We believe this difference is real and resulted from slower cross-linker adsorption on the rough sputtered-gold surface of the MSPRS (the gold-cluster size is comparable to the cross-linker size) than on the very smooth evaporated-and-annealed-gold film of the Biacore chip.19
The MSPRS and Biacore 3000 measured similar GOx-reaction time constants showing that MSPRS surface roughness only affected small-molecule-gold reactions and not subsequent protein–small-molecule-gold reactions. These results assume the validity of eqs (1) and (2), which are correct only if the number of molecules bound is large. The maximum density of GOx bound to the MSPRS surface depends on the DTSSP density which is influenced by the gold atoms’ density. Crystalline gold atoms’ spacing at a surface is ≈5 Å.38 A DTSSP molecule has a footprint smaller than the lattice constant, so its maximum monolayer density on gold is set by the separation between gold atoms, yielding an effective area of 20.6 Å2/cross-linker.38 GOx is a dimeric protein (60 Å × 52 Å × 77 Å)39 covering an area of 37–50 nm2 on a gold surface.40 Each polypeptide-chain subunit has 583 amino-acid residues of which 24 ± 1 are at the protein surface.39, 41 An average of 5 ± 1 DTSSP molecules could anchor each GOx.41 Theoretical studies predict a maximum coverage of 55% and a GOx-monolayer density on a gold surface of 2.7 × 10¹⁰ molecules/mm2 (4.6 pmol/cm2 or 7.3 ng/mm2).42, 43 Experiments using scanning-tunneling microscopy, quartz-crystal microbalance and fluorescence methods find surface coverages ranging from 23% to 52%, or densities from 7.8 × 10⁹ molecules/mm2 (1.3 pmol/cm2 or 2.1 ng/mm2) to 2.3 × 10¹⁰ molecules/mm2 (3.8 pmol/cm2 or 6.1 ng/mm2).40, 42, 44, 45 Thus, each MSPRS should bind between 1.9 × 10⁴ and 5.7 × 10⁴ molecules (between 32 zmol (5.2 fg) and 95 zmol (15 fg)) of GOx at its surface. The Biacore sensor similarly should bind between 1010 and 2.8 × 10¹⁰ molecules (between 15.6 fmol (2.5 ng) and 45.6 fmol (7.3 ng)) of GOx at its surface. Despite binding 5 × 10⁵ times as many molecules, the Biacore sensor had only twice the S/N of one MSPRS, implying that the MSPRS is ≈250 times more sensitive as determined by the number of molecules required to achieve a given S/N (eq S-5). In addition, the reagent flow rate for the MSPRS was only 0.5 nL/s compared to 10 μL/s for the Biacore 3000.
Study of GOx Conformational Changes
Proteins change conformation near both hydrophobic and hydrophilic surfaces. Gold surfaces are hydrophobic, causing adsorbed proteins to restructure to expose their hydrophobic residues to the gold and their polar and charged residues to the water.46 Microcantilever studies show that on hydrophobic gold, proteins including IgG, BSA and Calmodulin change conformation,47, 48 while neutron-reflection studies have shown that salt can cause GOx’s globular structure to unfold at a hydrophobic-hydrophilic interface (e.g., air-water, oil-water).46 We hypothesized that GOx freshly dissolved in water and fixed on gold at low density via DTSSP should slowly change conformation. To enhance our ability to observe GOx refolding at the gold surface, we modified our functionalization protocol. We dissolved GOx in DI-water at a reduced concentration (0.78, 1.56 and 3.12 μM) and immediately (≈5 min) loaded it into a DTSSP-coated chip to prevent the GOx from refolding in solution. After DTSSP-GOx binding, we monitored the MSPRS signal for 10–12 hours overnight under PBS. PBS has enough dissolved ions to help GOx properly reconfigure in solution.
Figure 3 shows the change in the MSPRS-emitted intensity at 660 nm during DTSSP-GOx binding (1.56 μM GOx in DI-water) and during a ten-hour PBS-rinse. The MSPRS signal decreased by ≈3% with respect to the DTSSP-GOx baseline (Figure 3) for the 0.78 μM and 1.56 μM GOx solutions and by ≈1.6% for the 3.12 μM GOx solution. For the 6.25 μM, 12.5 μM and 25.0 μM solutions the signal remained constant during the PBS rinse. The lower packing fraction produced by the 0.78–3.12 μM GOx solutions allowed a slow relaxation of the DTSSP-GOx conformation which higher densities inhibited. For the 1.56 μM GOx, an exponential fit gave a relaxation time of 106 ± 1 min. The timescale of this relaxation is consistent with those for IgG and BSA on gold surfaces.47 We lack data to determine the detailed dependence of the relaxation time on the DTSSP-GOx surface coverage.
Study of GOx Binding Activity in PBS
Because DTSSP-GOx binding might denature the GOx and binding to the sensor surface might obstruct the GOx active site,49 we tested whether the gold-surface bound GOx can selectively bind its natural substrate.
GOx is a FAD-dependent enzyme which catalyses the oxidation of βD-Glu to δ-gluconolactone and hydrogen peroxide. βD-Glu binds inside the active site of GOx via 12 hydrogen bonds, many hydrophobic contacts to three neighboring aromatic residues and to the FAD.50 Crystallography indicates that a deep pocket provides access to the FAD which is located at the bottom of the active site.39 α-D-glucose (αD-Glu), D-Man, 2Do-Glu and L-Glu form either fewer bonds than βD-Glu or unfavorable contacts with neighboring amino acids, decreasing their binding affinity. Hence they react slowly or not at all with GOx: αD-Glu reacts at 0.64%, D-Man at 1%, 2Do-Glu at 20% and L-Glu at 0% of the βD-Glu rate.39, 50-52
Figure 4a shows the MSPRS signal (at 660 nm) as the various substrates interact with GOx. To control for the refractive indices of the substrate solutions, we used matched 100 mM substrate solutions (in PBS 1×) with identical refractive indices. We confirmed the index matching of the substrate solutions using the Biacore 3000. The two forms of D-Glu (αD-Glu and βD-Glu) interconvert and coexist in solution (prepared one day before), so a 100 mM D-Glu solution contains only 50 mM βD-Glu, the only isomer which binds to GOx. In each experiment, we rinsed the DTSSP-GOx-functionalized chip with PBS for 500 s to establish an experimental baseline, injected the substrate solution for 500 s, then rinsed the chip with PBS for 500 s. L-Glu served as a control for the effect of refractive index changes in the bulk substrate solutions since it does not bind to GOx but has a larger refractive index than PBS. The L-Glu solution produced rapid signal changes on wash-in and wash-out, with stable baselines for PBS and the substrate solution, indicating the absence of both specific and non-specific interactions between the L-Glu and the sensor.
The D-Glu solution produced a fast signal change due to the solution’s refractive index, then slower changes due to the formation of the βD-Glu–GOx complex. The time-series for the D-Man and 2Do-Glu solutions showed identical fast changes due to their refractive indices, followed by much smaller slow changes due to their small but non-zero catalysis rates. Table 1 summarizes the reaction kinetics determined from exponential fits to the time series.
Table 1.
Emitted-intensity changes at 660 nm from a single MSPRS during substrate interaction with a GOx-functionalized surface (see Figure 4a).
| substrates (100mM in PBS) |
L-Glu (reference) |
2Do-Glu | D-Man | D-Glu |
|---|---|---|---|---|
|
Ibaseline (counts/s) |
22757 | 22725 | 22746 | 22737 |
|
Isubstrate (counts/s) |
22236 | 22190 | 22168 | 21974 |
| signal (Ibaseline–Isubstrate) (counts/s) |
521 | 535 | 579 | 763 |
| noise (counts/s) |
25 | 9 | 16 | 20 |
| S/N | 21 (13.2 dB) | 57 (17.5 dB) | 36 (15.5 dB) | 37 (15.7 dB) |
|
Ssubstrate–SL-Glu (counts/s) |
0 | 14 | 58 | 242 |
| relative rate ± error | 0.00 ± 0% | 0.06 ± 65% | 0.24 ± 28% | 1.00 ± 8% |
Among label-free sensors, cantilevers (0.01 mm2) may have detected the binding to surface-bound GOx of βD-Glu in PBS at concentrations from 0.2 to 20 mM at a flow rate of 2 mL/h.53 Their results surprisingly suggested that the βD-Glu–GOx binding was irreversible, so the apparent detection may have been an artifact. If these experiments really did detect βD-Glu–GOx binding, the binding timescale of 2000 ± 500 s which we estimated from their Figure 2 (they did not calculate it explicitly in the paper) is similar to that in our Figure 4a.
We repeated our experiments on a Biacore 3000 using an untreated-gold SPR chip (Figure 2c). We used the first channel as a reference and rinsed its untreated surface with DI-water and PBS for 1000 s before injecting any substrate. We functionalized another channel with DTSSP-GOx as described above, then rinsed with DI-water and PBS for 1000 s each. We injected each substrate solution for 1500 s, then rinsed with PBS for 500 s. The SPR signal from the reference channel represents the difference in refractive index between substrates and PBS. We subtracted this reference signal from the equivalent signal from the GOx-functionalized channel (Figure 4b).
The corrected SPR signal for all substrates was 25 ± 3 RU. Their lack of variation among substrates indicated that the SPR was sensitive to the fluids’ refractive indices but could not detect GOx–βD-Glu binding. It also showed that the refractive indices of the substrate solutions were indeed the same.
Study of GOx Binding Activity in Complex Buffers
The medical need for tools to help personalize treatment of complex conditions (e.g., sepsis, stroke, Acute Respiratory Distress Syndrome, cancer and Alzheimer’s disease) is clear, while the wide variability of clinical symptoms causes difficulty in reaching rapid and specific diagnoses. Effective monitoring of blood markers in real blood would help in both applications. However, blood is a complex medium containing proteins, sugars, minerals, hormones, clotting factors, leukocytes, platelets, red blood cells and white blood cells, many of which bind non-specifically to surfaces, complicating detection of specific (and often low concentration) components in blood.
To examine the feasibility of using MSPRSs in possible future clinical applications, we designed experiments to use our MSPRSs to monitor the GOx–βD-Glu interaction in two complex buffers (1) DMEM 1× (with complexity higher than PBS) and (2) 10% HS in DMEM 1× (with a complexity closer to blood) and in two controls: (a) PBS 1× (a buffer control) and (b) 200 mM L-Glu in PBS 1× (a refractive-index control). Figure 5 shows the MSPRS signal during repeated wash-in and wash-out of 100 mM substrate in such buffers.
To control for refractive-index effects, we used 100 mM L-Glu in PBS as a reference and 100 mM D-Glu in PBS as a reagent (both solutions have the same refractive index). We first loaded the L-Glu solution, rinsed the GOx-functionalized chip (Figure 2a) with PBS for 500 s to establish a signal baseline, washed-in L-Glu solution for 1500 s and rinsed with PBS for 1000 s. We repeated the wash-in/wash-out cycle four times to establish our detection reproducibility. We then loaded the D-Glu solution, rinsed the chip with PBS for 500 s, washed-in D-Glu solution for 1500 s and rinsed with PBS for 1000 s. Again, we repeated the wash-in/wash-out cycle four times. We subtracted the L-Glu signal from the D-Glu signal to eliminate refractive-index effects (Figure S-5) to obtain a signal of 109 ± 22 counts/s representing only the GOx–βD-Glu binding (Figure 5a). During the 10–12 hour overnight interval between experiments, we held the chip under continuous 0.5 nL/s DI-water flow.
As a second method to eliminate refractive-index artifacts, we matched the reagent and rinsing-buffer refractive indices. We used 200 mM L-Glu in PBS as a rinsing buffer and 100 mM D-Glu plus 100 mM L-Glu in PBS as a substrate solution. In this experiment the rinsing buffer and the substrate solution have the same refractive index. We loaded the D-Glu–L-Glu solution, rinsed the chip with L-Glu for 1000 s to establish a signal baseline, washed-in D-Glu–L-Glu solution for 1500 s, then rinsed with L-Glu for 1000 s. We repeated the wash-in/wash-out cycle four times. Figure 5b shows a βD-Glu–GOx-binding signal of 116 ± 21 counts/s, within the error of the PBS (Figure 5a) value above.
We approached the complexity of blood as a solution in two steps: first using glucose-free DMEM 1× and then using 10% HS in glucose-free DMEM 1×.
DMEM is a cell-culture medium suitable for most mammalian cells, not as complex as blood, but abundant in amino acids, vitamins and salts. Serum is filtered, clotted blood. It has never been fully characterized, but its complexity resembles blood’s, containing over 1,000 different components including proteins, electrolytes, lipids, carbohydrates, hormones, enzymes and albumin, but not clotting factors, leukocytes, platelets, red blood cells or white blood cells. We chose serum to avoid filtration or anticoagulant mixing steps which could alter reagent concentrations.
Our DMEM experiments used 100 mM D-Glu in glucose-free DMEM 1× and 100 mM L-Glu in glucose-free DMEM 1× as substrate solutions. We loaded the L-Glu solution, rinsed the GOx-functionalized chip (Figure 2a) with glucose-free DMEM 1× for 1000 s to define a signal baseline, injected the L-Glu solution for 1500 s and rinsed with glucose-free DMEM 1× for 1000 s. We repeated the wash-in/wash-out cycle four times, then loaded the D-Glu solution and performed four wash-in/wash-out cycles with the D-Glu solution. We subtracted the L-Glu signal from the D-Glu signal to eliminate refractive-index effects (Figure S-5) to obtain a GOx-βD-Glu binding signal of 128 ± 29 counts/s (Figure 5c).
After the experiment, we flushed the chip with glucose-free DMEM 1× for 16 hours at a 0.5 nL/s flow rate. We observed a considerable change in the baseline (≈25%), which we attributed to non-covalent, non-specific binding of DMEM components to the MSPRS. When we eluted the chip for 30 s with 0.1 M HCl in DI-water, we recovered the baseline, proving this assumption. After elution, we rinsed the chip with PBS for about one hour and changed the buffer to 10% HS in glucose-free DMEM 1×. Loading 10% HS in glucose-free DMEM 1× into the chip caused an almost instantaneous decrease of 5.2% in the baseline signal, indicating non-specific binding to the MSPRS. In a different set of experiments, we eluted with 0.1 M HCl in DI-water for 5 min but did not recover the original baseline, showing that the irreversible shift results from the non-specific covalent binding of serum albumen which is known from other contexts.54
Our 10%-HS-in-glucose-free-DMEM-1× experiment used 100 mM D-Glu and 100 mM L-Glu in 10% HS in glucose-free DMEM 1× as substrate solutions. We first performed four wash-in/wash-out cycles with L-Glu to measure refractive-index effects; rinsed with 10% HS in glucose-free DMEM 1× to reestablish the signal baseline, then performed four wash-in/wash-out cycles with D-Glu. We subtracted the L-Glu signal from the D-Glu signal (Figure S-5) to obtain a GOx–βD-Glu binding signal of 112 ± 25 counts/s (Figure 5d).
The last two experiments used the same MSPRS on consecutive days and produced equivalent responses, showing that the bound GOx remained active for at least 36 hours. DMEM non-specific binding did not interfere with the specific interaction between GOx and its substrate (Figure 5c–d). All four experiments returned signals for the βD-Glu–GOx interaction identical within error (109 ± 22, 116 ±21, 128 ± 29, 112 ± 25 counts/s) showing that MSPRSs can work in complex media and suggesting that our MSPRSs and functionalization protocol are suitable for use in clinical blood assays.
Supplementary Material
Acknowledgments
We thank Dr. S. C. Jacobson for providing access to his microfluidics facility. We thank Mr. P. Childres and his team for helping build the optical setup. We acknowledge support from NIH/NIGMS grant R01-GM76692 and from the Office of the Vice President for Research of Indiana University.
Footnotes
Supporting information available: Additional information as noted in the text. This material is available free of charge via the Internet at http://pubs.acs.org.
References
- (1).Mellor J, DeLisi C. J. Biol. 2005;5(10) doi: 10.1186/jbiol44. [DOI] [PMC free article] [PubMed] [Google Scholar]
- (2).Reguly T, Breitkreutz A, Boucher L, Breitkreutz B-J, Hon GC, Myers CL, Parsons A, Friesen H, Oughtred R, Tong A, Stark C, Ho Y, Botstein D, Andrews B, Boone C, Troyanskya OG, Ideker T, Dolinski K, Batada NN, Tyers M. J. Biol. 2006;5(11) doi: 10.1186/jbiol36. [DOI] [PMC free article] [PubMed] [Google Scholar]
- (3).Batada NN, Reguly T, Breitkreutz A, Boucher L, Breitkreutz B-J, Hurst LD, Tyers M. PLoS Biol. 2006;4(e317) doi: 10.1371/journal.pbio.0040317. [DOI] [PMC free article] [PubMed] [Google Scholar]
- (4).Zhong W, Sternberg PW. Science. 2006;311:1481–1484. doi: 10.1126/science.1123287. [DOI] [PubMed] [Google Scholar]
- (5).Formstecher E, Aresta S, Collura V, Hamburger A, Meil A, Trehin A, Reverdy C, Betin V, Maire S, Brun C, Jacq B, Arpin M, Bellaiche Y, Bellusci S, Benaroch P, Bornens M, Chanet R, Chavrier P, Delattre O, Doye V, Fehn R, Faye G, Galli T, Girault J-A, Goud B, deGunzburg J, Johannes L, Junier M-P, Mirouse V, Mukherjee A, Papadopoulo D, Perez F, Plessis A, Rosse C, Saule S, Stoppa-Lyonnet D, Vincent A, White M, Pegrain P, Wojcik J, Camonis J, Daviet L. Genome Res. 2005;15:376–384. doi: 10.1101/gr.2659105. [DOI] [PMC free article] [PubMed] [Google Scholar]
- (6).Stapleton M, Carlson J, Brokstein P, Yu C, Champe M, George R, Guarin H, Kronmiller B, Pacleb J, Park S, Wan K, Rubin GM, Celniker SE. Genome Biol. 2002;3(res0080):1–8. doi: 10.1186/gb-2002-3-12-research0080. [DOI] [PMC free article] [PubMed] [Google Scholar]
- (7).Gandhi TKB, Zhong J, Mathivanan S, Karthick L, Chandrika KN, Mohan SS, Sharma S, Pinkert S, Nagaraju S, Periaswamy B, Mishra G, Nandakumar K, Shen B, Deshpande N, Nayak R, Sarker M, Boeke JD, Parmigiani G, Schultz J, Bader JS, Pandey A. Nat. Genet. 2006;38:285–293. doi: 10.1038/ng1747. [DOI] [PubMed] [Google Scholar]
- (8).Buckingham SD. Invert. Neurosci. 2005;5:183–187. doi: 10.1007/s10158-005-0009-4. [DOI] [PubMed] [Google Scholar]
- (9).Liu Y, Liu N, Zhao H. Bioinformatics. 2005;21:3279–3285. doi: 10.1093/bioinformatics/bti492. [DOI] [PubMed] [Google Scholar]
- (10).Patil A, Nakamura H. BMC Bioinformatics. 2005;6(100) doi: 10.1186/1471-2105-6-100. [DOI] [PMC free article] [PubMed] [Google Scholar]
- (11).Fan X, White IM, Shopova SI, Zhu H, Suter JD, Sun Y. Anal. Chim. Acta. 2008;620:8–26. doi: 10.1016/j.aca.2008.05.022. [DOI] [PMC free article] [PubMed] [Google Scholar]
- (12).Ebbesen TW, Lezec HJ, Ghaemi HF, Thio T, Wolff PA. Nature. 1998;391:667–669. [Google Scholar]
- (13).Zawadzka J, Jaroszynski DA, Carey JJ, Wynne K. Nucl. Instrum. Methods Phys. Res., Sect. A. 2000;445:324–328. [Google Scholar]
- (14).Karlsson R. J. Mol. Recognit. 2004;17:151–161. doi: 10.1002/jmr.660. [DOI] [PubMed] [Google Scholar]
- (15).Kielmann F. J. Microsc. 1999;194:567–570. doi: 10.1046/j.1365-2818.1999.00495.x. [DOI] [PubMed] [Google Scholar]
- (16).Yokota H, Saito K, Yanagida T. Phys. Rev. Lett. 1998;80:4606–4609. [Google Scholar]
- (17).Bergqvist S, Doyle M, Giannetti AM, Hensley P, Schwarz FP, Yadav SP. MIRG 2007 Survey on Label-Free Biophysical Technologies Used in Characterizing Biomolecular Interactions. The Association of Biomolecular Resource Facilities; 2008. http://www.abrf.org/ [Google Scholar]
- (18).Myszka DG, He X, Dembo M, Morton TA, Goldstein B. Biophys. J. 1998;75:583–594. doi: 10.1016/S0006-3495(98)77549-6. [DOI] [PMC free article] [PubMed] [Google Scholar]
- (19).Amarie D, Onuta T-D, Potyrailo RA, Dragnea B. J. Phys. Chem. B. 2005;109:15515–15519. doi: 10.1021/jp052536i. [DOI] [PubMed] [Google Scholar]
- (20).Symes R, Sayer RM, Reid JP. Phys. Chem. Chem. Phys. 2004;6:474–487. doi: 10.1039/b500385g. [DOI] [PubMed] [Google Scholar]
- (21).Vollmer F, Arnold S. Nat. Methods. 2008;5:591–596. doi: 10.1038/nmeth.1221. [DOI] [PubMed] [Google Scholar]
- (22).Matsko AB, Savchenkov AA, Strekalov D, Ilchenko VS, Maleki L. IPN Progress Report #42-162. 2005:1–51. [Google Scholar]
- (23).Hutter E, Fendler JH. Adv. Mater. 2004;16:1685–1706. [Google Scholar]
- (24).Link S, El-Sayed MA. J. Phys. Chem. B. 1999;103:8410–8426. [Google Scholar]
- (25).El-Sayed MA. Acc. Chem. Res. 2001;34:257–264. doi: 10.1021/ar960016n. [DOI] [PubMed] [Google Scholar]
- (26).Murphy CJ, Sau TK, Gole AM, Orendorff CJ, Gao J, Gou L, Hunyadi SE, Li T. J. Phys. Chem. B. 2005;109:13857–13870. doi: 10.1021/jp0516846. [DOI] [PubMed] [Google Scholar]
- (27).Nordlander P, Prodan E. Nano Lett. 2004;4:2209–2213. [Google Scholar]
- (28).Le F, Lwin NZ, Steele JM, Ka M, Halas NJ, Nordlander P. Nano Lett. 2005;5:2009–2013. doi: 10.1021/nl0515100. [DOI] [PubMed] [Google Scholar]
- (29).Le F, Lwin NZ, Halas NJ, Nordlander P. Phys. Rev. B. 2007;76(165410) [Google Scholar]
- (30).Amarie D, Glazier JA, Jacobson SC. Anal. Chem. 2007;79:9471–9477. doi: 10.1021/ac0714967. [DOI] [PMC free article] [PubMed] [Google Scholar]
- (31).Koyama S, Amarie D, Soini HA, Novotny MV, Jacobson SC. Anal. Chem. 2006;78:3354–3359. doi: 10.1021/ac052087i. [DOI] [PubMed] [Google Scholar]
- (32).Mattson G, Conklin E, Desai S, Nielander G, Savage MD, Morgensen S. Mol. Biol. Rep. 1993;17:167–183. doi: 10.1007/BF00986726. [DOI] [PubMed] [Google Scholar]
- (33).Baac H, Hajos JP, Lee J, Kim D, Kim SJ, Shuler ML. Biotechnol. Bioeng. 2006;94:815–819. doi: 10.1002/bit.20882. [DOI] [PubMed] [Google Scholar]
- (34).Hermanson GT. Bioconjugate Techniques. Academic Press, Inc.; 1996. [Google Scholar]
- (35).Okayama S, Haraichi S, Matsuhata H. J. Electron. Microsc. 2005;54:345–350. doi: 10.1093/jmicro/dfi053. [DOI] [PubMed] [Google Scholar]
- (36).Lide DR, editor. CRC Handbook of Chemistry and Physics. 88th ed Taylor and Francis Group, LLC; 2007. [Google Scholar]
- (37).Homola J. Anal. Bioanal. Chem. 2003;377:528–539. doi: 10.1007/s00216-003-2101-0. [DOI] [PubMed] [Google Scholar]
- (38).Ulman A. An Introduction to Ultrathin Organic Films: from Langmuir-Blodgett to Self-Assembly. Academic Press; San Diego: 1991. [Google Scholar]
- (39).Hecht JH, Kalisz HM, Hendle J, Schmid RD, Schomburg D. J. Mol. Biol. 1993;229:153–172. doi: 10.1006/jmbi.1993.1015. [DOI] [PubMed] [Google Scholar]
- (40).Losic D, Shapter JG, Gooding JJ. Langmuir. 2002;18:5422–5428. [Google Scholar]
- (41).Baszkin A, Boissonnade MM, Rosilio V, Kamyshny A, Magdassi S. J. Colloid Interface Sci. 1997;190:313–317. doi: 10.1006/jcis.1997.4874. [DOI] [PubMed] [Google Scholar]
- (42).Pishko MV, Revzin A, Simonian AL. Sensors. 2002;2:79–90. [Google Scholar]
- (43).Jin X, Wang N, Tarjus G, Talbot J. J. Phys. Chem. 1993;97:4256–4258. [Google Scholar]
- (44).Gooding JJ, Situmorang M, P. E, Hibbert DB. Anal. Commun. 1999;36:225–228. [Google Scholar]
- (45).Nakano K, Doi K, Tamura K, Katsumi Y, Tazaki M. Chem. Commun. 2003:1544–1545. doi: 10.1039/b303298a. [DOI] [PubMed] [Google Scholar]
- (46).Lu JR, Su T-J. J. Phys. Chem. B. 2003;107:3954–3962. [Google Scholar]
- (47).Moulin AM, O’Shea SJ, Badley RA, Doyle P, Welland ME. Langmuir. 1999;15:8776–8779. [Google Scholar]
- (48).Yan X, Hill K, Gao H, Ji H-F. Langmuir. 2006;22:11241–11244. doi: 10.1021/la0605337. [DOI] [PubMed] [Google Scholar]
- (49).Valentová O, Marek M, Švec F, Štramberg J, Vodrážka Z. Biotechnol. Bioeng. 1981;23:2093–2104. [Google Scholar]
- (50).Wohlfahrt G, Witt S, Hendle J, Schomburg D, Kalisza HM, Hecht H-J. Acta Crystallogr., Sect. D: Biol. Crystallogr. 1999;D55:969–977. doi: 10.1107/s0907444999003431. [DOI] [PubMed] [Google Scholar]
- (51).Pazur JH. Methods Enzymol. 1966;9:82–87. [Google Scholar]
- (52).Leskovac V, Trivić S, Wohlfahrt G, Kandrač J, Peričin D. Int. J. Biochem. Cell Biol. 2005;37:731–750. doi: 10.1016/j.biocel.2004.10.014. [DOI] [PubMed] [Google Scholar]
- (53).Pei J, Tian F, Thundat T. Anal. Chem. 2004;76:292–297. doi: 10.1021/ac035048k. [DOI] [PubMed] [Google Scholar]
- (54).Melethil S, Poklis A, Sagar VA. J. Pharm. Sci. 1980;69:585–587. doi: 10.1002/jps.2600690529. [DOI] [PubMed] [Google Scholar]
Associated Data
This section collects any data citations, data availability statements, or supplementary materials included in this article.