

Abstract
GW bodies (GWB, or P bodies) are cytoplasmic foci thought to result from microRNA (miRNA) regulation of mRNA targets and subsequent mRNA degradation. The purpose of this study is to examine the effects of lipopolysaccharide (LPS) stimulation of human monocytes on GW body formation, miRNA induction, miRNA target regulation, and downstream cytokine and chemokine expression. In response to LPS stimulation, the number of GWB consistently increased by 2 fold at 8 hours after stimulation and this increase was abolished when the miRNA-effector proteins Rck/p54 or argonaute 2 (Ago2) were depleted. Since the level of miR-146a increased from 19 fold up to 100 fold during LPS stimulation, the transfection of a miR-146a-mimic into THP-1 cells was examined to determine whether miR-146a alone can induce similar changes in GWB. The results showed transfected miR-146a could produce a comparable increase in the number of GWB and this was accompanied by a reduction in major cytokines/chemokines induced by LPS. These data show that the increase in size and number of GWB may serve as a biomarker for miRNA mediated gene regulation, and miR-146a plays a significant role in the regulation of LPS-induced cytokine production in THP-1 cells.
Keywords: cytokines, GW body, innate immune signaling, lipopolysaccharide, microRNA, monocytes, processing body
Introduction
GW bodies, first identified using human autoantibodies,1,2 are also known as mammalian processing bodies (P bodies), here referred to as GWB. GWB are cytoplasmic foci present in mammalian cells that have a role in mRNA processing and degradation and have been linked to the RNA interference (RNAi) and microRNA (miRNA) pathways.3-6 Specifically, it has been shown that small interfering RNA (siRNA) and miRNA localize to GWB.7-9 It has also been shown that argonaute 2 (Ago2), the slicing enzyme of RNAi, interacts with a critical GWB protein, GW182, and localizes to GWB.7,10-12 In addition, we have shown that the formation of GWB is a consequence of miRNA biogenesis,8 and our other report demonstrated that siRNA-mediated silencing of endogenous targets results in the induction of GWB assembly.13 Other investigators have also demonstrated the link between RNA-mediated gene silencing and GWB formation.14
MicroRNAs target specific sites in the 3′ untranslated regions (UTR) of their specific mRNA targets. AU-rich elements (AREs) are the predominant motifs in the 3′UTR of mRNAs that regulate mRNA stability.15 It was previously thought that AREs were mainly involved in the regulation of relatively few mRNAs such as cytokine and growth factor mRNAs. However, it is now known that ARE mRNAs make up roughly 8% of mRNAs transcribed from the human genome including those involved in cell growth and differentiation, immune responses, signal transduction, and apoptosis.15 Many cytokine mRNAs, including those for tumor necrosis factor-α (TNF-α), interleukins, interferons, and granulocyte-macrophage colony-stimulating factor (GM-CSF), have very short half-lives, and their degradation is regulated by AREs in their 3′UTR.15 Since miRNA are known to target sequences in the 3′UTR of mRNAs, it is interesting to postulate that cytokine mRNAs could be regulated by miRNA. In fact, studies showed that miRNA are involved in some ARE-mediated mRNA degradation. In 2005, Jing et al. reported that miR-16 targets the ARE in the 3′UTR of TNF-α mRNA and is required for its degradation.16 In 2006, Takahashi et al. showed that Dicer is required for ARE-mediated degradation of GM-CSF mRNA, suggesting that mature miRNA play a role in this process.17 Additionally, two recent reports demonstrated that certain miRNA may activate or derepress their target mRNA under specific cellular conditions.18,19 Vasudevan et al. reported that miR-369-3 was able to activate translation of TNF-α mRNA, but this activation was not specific to that miRNA-mRNA pair, therefore this phenomenon may be true for other miRNA as well.18
Further connections between miRNA and the mammalian immune system are becoming more evident with recent publications.20-22 One report showed that certain miRNA are upregulated in human monocytes in response to lipopolysaccharide (LPS).23 LPS is a component of the outer membrane of gram-negative bacteria that activates the production of pro-inflammatory cytokines in monocytes and macrophages. LPS stimulates toll like receptor 4 (TLR4) and activates several intracellular signaling cascades that lead to the production of TNF-α, IL-6, monocyte chemoattractant protein-1 (MCP-1) and other pro-inflammatory cytokines and chemokines.24 Taganov et al. reported that LPS stimulation of THP-1 monocytes resulted in increased expression of miR-146a, miR-155 and miR-132, and that TNF receptor-associated factor 6 (TRAF6) and IL-1 receptor associated kinase (IRAK-1), proteins in the TLR4 signaling pathway, were targets of miR-146a.23 In 2008, Perry et al. reported an increase in miR-146a expression upon IL-1β stimulation of lung alveolar epithelial cells, and demonstrated that the increased miR-146a negatively regulated the production of IL-8 and RANTES.22 In addition, miR-155 has also been linked to several other immune functions including the germinal center response,25 normal lymphocyte functions,26 and regulation of immunoglobulin class-switched plasma cells.27
Taken together, these reports demonstrate an important role for miRNA in normal immune functions. The aim of this study is to investigate the effect of innate immune signaling and related miRNA on GWB since the latter has been linked with miRNA biogenesis in our earlier report using HeLa cells8 and reproduced by other investigators in insect cells.14
Results
GWB increase in size and number in response to LPS stimulation
LPS stimulation of human monocytes/macrophages is a well-characterized model of innate immune signaling.24 To determine if there were any changes in GWB associated with innate immune signaling, THP-1 human monocytes were treated with 1 μg/ml LPS for 0, 4, 6, 8, 12, and 24 hours and GWB were monitored by indirect immunofluorescence (Figure 1). Within 4 hours of LPS stimulation the number and size of GWB significantly increased compared to untreated cells. The number of GWB was highest at 8 hours of LPS stimulation. This observation was quantified using CellProfiler image analysis software to count the number of GWB per cell. As shown in Figure 1B, the average number of GWB increased almost 2-fold with 8 hours of LPS treatment compared to untreated cells cultured in parallel (18.6 in LPS-treated versus 10.5 in untreated cells). After 8 hours, the number of GWB gradually declined as seen at 12 and 24 hours. At the 6, 8, 12, and 24 hour time points, there was a significant increase in the number of GWB in LPS-treated cells compared to paired untreated cells by Mann-Whitney (P<0.0001 for 6, 8, and 24 hours, P<0.008 for 12 hours). This type of experiment was repeated more than 10 times with similar results obtained each time over a period of 2 years.
Figure 1. LPS induces the assembly of GWB.

(A) THP-1 cells treated with 1 μg/ml LPS showed a time-dependent increase in the number and size of GWB. After LPS treatment, cells were fixed and costained with human anti-GWB serum (green) and rabbit anti-Dcp1a (red). Nuclei were counterstained by 4,6-diamidino-2-phenylindole (DAPI, blue). Images were acquired at 400x original magnification. Bar, 10 μm. (B) Bar graph showing representative data from the CellProfiler image analysis software used to quantitate the average number of foci per cell in untreated cells or LPS-treated cells for 0 to 24 hours after LPS incubation (n>150 cells analyzed for each treatment). Asterisks (**) indicate P<0.0001 or (*) P<0.008 compared to paired untreated control as determined by Mann-Whitney.
Next, the expression levels of some of the protein components of GWB were examined by Western blot in order to determine whether the GWB forming in response to LPS were assembled from de novo proteins or pre-existing proteins in the cytoplasm. THP-1 cell extracts were prepared from cells treated with 1 μg/ml LPS for 4, 8, or 24 hours together with paired untreated cells harvested at the corresponding time point (Figure 2). The Western blot data showed that there were only slight changes in the expression levels of Ago2 and Rck/p54 in LPS treated cells compared to untreated cells (lanes (+) versus (−)) for each time point analyzed. No significant difference was demonstrated in Western blot data from 3 independent replicate experiments that were quantified by densitometric analysis. In contrast, the levels of Dcp1 in LPS treated cells were ~2-5 fold increased compared to untreated cells at all 3 time points examined. Since the highest number of GWB was observed at 8 hours (Figure 1), the minimal changes in Rck/p54 and Ago2 protein levels at this time point (Figure 2) cannot reflect the almost 2 fold increase in number of GWB; therefore, these data are more consistent with the conclusion that LPS-induced GWB are formed from pre-existing Ago2 and Rck/p54 proteins in the cytoplasm rather than entirely from de novo proteins. However, by 24 hours, there were obvious increases in levels of these proteins compared to the 4 and 8 hour time points (Figure 2).
Figure 2. Expression of GWB protein components Ago2 and Rck/p54 in THP-1 cells are unaffected by LPS treatment.
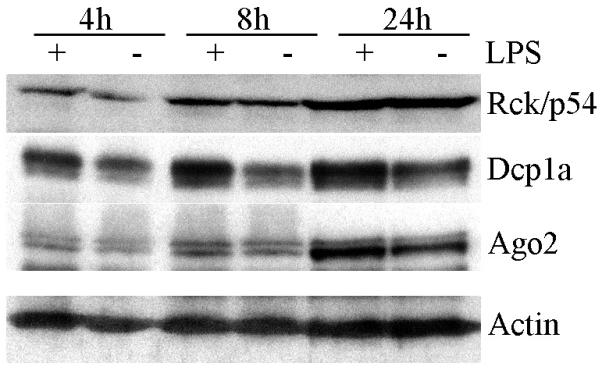
THP-1 cell extracts from LPS treated (+) or untreated (−) cells for each time point were compared using Western blot detection of Rck/p54, Dcp1a, Ago2 and actin, which is shown as a loading control. Representative data from 3 independent experiments is shown.
miR-146a, miR-132 and miR-155 are upregulated in THP-1 cells in response to LPS
Based on the work by Taganov et al. on the upregulation of certain miRNA in response to LPS,23 and our earlier work demonstrating the importance of miRNA for GWB formation,8 we speculated that the LPS-induced increase in the size and number of GWB could be the result of increased miRNA expression (and possibly miRNA activity) in the cells. It is interesting to note that Taganov et al. showed that global miRNA levels were not affected by LPS stimulation but rather that three specific miRNAs (miR-146a, miR-155, and miR-132) were upregulated.23 To test this hypothesis, we first set out to confirm that in our experimental conditions, these miRNA were upregulated in response to LPS. The expression of miR-146a, miR-132, miR-155 and let-7a in THP-1 cells were examined after LPS stimulation by quantitative real time PCR (qRT-PCR). As expected, the expression of let-7a was unaffected by LPS treatment and was used to normalize the expression of miR-146a, miR-155, and miR-132. Fold change in miRNA expression was calculated by comparing 4, 8, 12, and 24 hour LPS treatments to untreated samples cultured in parallel. As shown in Figure 3A, miR-146a was increased an average of 19 fold after 4 hours and 28 fold after 8 hours LPS treatment. In addition, miR-132 expression was increased 3.8 fold after 24 hours of LPS treatment (Figure 3B) and miR-155 expression was increased up to 2.6 fold after 8 hours of LPS treatment (Figure 3C). The increased levels of these miRNA are generally consistent with those reported by Taganov et al.23 although the level of increase for miR-146a at 8 hour was ~3 fold higher (28 fold versus 8 fold) than previous reported. These large increases may be due in part to the relatively low basal level of miR-146a in unstimulated THP-1 cells and this basal level may vary due to slight differences in culture conditions. A second potential reason for the experimental difference is that another miRNA (let7) was used as internal control for comparison whereas miRNA were compared to 5S RNA in the study by Taganov et al.23 In sum, our data show that LPS stimulation results in the upregulation of several miRNA, with miR-146a level increased by 28-fold at 8 hours, coinciding with the highest increase in number of GWB at this same time point.
Figure 3. LPS stimulation induces upregulation of miR-146a, miR-132, and miR-155.

THP-1 cells were stimulated with 1 μg/ml LPS for 4, 8, 12, or 24 hours or left untreated. RNA was isolated from cells and qRT-PCR analysis was performed as described in Methods. Fold changes of miR-146a (A), miR-132 (B), and miR-155 (C) from LPS-treated cells compared to untreated cells cultured in parallel were calculated after normalization to let-7a expression. Average plus SD shown, n=3 independent experiments. Asterisks (*) indicate P<0.05 compared to untreated controls.
Rck/p54 and Ago2 are required for LPS-induced GWB assembly
To further demonstrate the relationship between LPS-induced miRNA and GWB formation, we examined the effect of depleting two independent protein components of GWB that are known to be important for miRNA-mediated function, Rck/p54 and Ago2.28 siRNA were used to knockdown Rck/p54 or Ago2 in THP-1 cells. Forty-eight hours after transfection, transfected cells were stimulated with LPS and the number of GWB were monitored by immunofluorescence. Figure 4A shows the knockdown efficiency for Rck/p54 (~90% reduction) and Ago2 (~70% reduction) under these experimental conditions. Mock-transfected cells stimulated with LPS for 4, 8, and 24 hours exhibited significant increases in the average number of GWB per cell as expected (p<0.0001, not indicated). As shown in Figure 4B, the average number of GWB per cell in the Rck/p54-depleted cells was reduced to 4.7 compared to an average of 9.7 foci per cell in mock-transfected cells prior to LPS treatment. These data are consistent with previous reports demonstrating that Rck/p54 depletion results in the loss of GWB.13,28 In addition, LPS stimulation of Rck/p54 depleted cells did not induce an increase in the number of GWB at all time points examined. At 8 hours, when the maximum increase in GWB after LPS treatment of the mock transfected cells was observed, Rck/p54 depleted cells had an average of 3.1 foci per cell compared to 23.5 foci per cell in mock transfected cells (Figure 4B), representing an 87% reduction. Consistent with our previous report,13 in Ago2-depleted cells, the average number of GWB per cell was similar to that of mock-transfected cells prior to LPS stimulation (Figure 4B). Like the Rck/p54-depleted cells, there was no increase in the number of GWB in Ago2-depleted cells except after 4 hours of LPS stimulation. We speculate that this initial increase in GWB could be due to incomplete knockdown of Ago2 as shown in Figure 4A. Overall, this data demonstrated that Rck/p54 and Ago2 were both required for the LPS-induced increase in GWB assembly, supporting our hypothesis that miRNA-mediated function is responsible for this phenomenon, therefore in the absence of these critical proteins for miRNA function, GWB are no longer induced by LPS stimulation.
Figure 4. Rck/p54 and Ago2 depletion results in loss of LPS-induced GWB assembly.

(A) Reduction in protein levels of Rck/p54 and Ago2 demonstrated by Western blot to compare mock transfected cells or cells transfected with siRNA targeting Rck/p54 or Ago2. Tubulin levels were included as a loading control. Cells were harvested 48 hours after transfection. For the mock transfected cells, 10, 30, and 100 indicate percent input of cell lysate. (B) LPS-induced GWB assembly was abolished by knockdown of Rck/p54 or Ago2. THP-1 cells were transfected with siRNA targeting Rck/p54 or Ago2, or mock transfected, and then 48 hours later the cells were stimulated with 1 μg/ml LPS for 0, 4, 8, or 24 hours. GWB were monitored by immunofluorescence and counted using CellProfiler image analysis software. Average plus SD is shown, n>250 cells analyzed in two independent experiments. Asterisks (*) indicate P<0.0001 compared to corresponding time point for mock transfected cells as determined by Mann-Whitney. Dashed line indicates average foci per cell in normal untreated cells.
miR-146a alone can induce an increase in the size and number of GWB
Since LPS has been shown to induce the expression of only a few miRNA,23 and miR-146a was the most significantly elevated by LPS treatment in our experimental system, the next logical step was to demonstrate whether the introduction of miR-146a alone into THP-1 cells could induce an increase in the size and number of GWB similar to LPS-induced GWB assembly. Precursor miR-146a (miR-146a mimic) was transfected at a concentration of 30nM into THP-1 cells and GWB examined by immunofluorescence 24 hours later. To monitor transfection efficiency, THP-1 cells were transfected with a Cy3-labeled-pre-miR negative control that mimics an endogenous miRNA but has no endogenous target. Figure 5A shows the increase in the size and number of GWB in THP-1 cells transfected with miR-146a mimic compared to mock transfected cells. As shown in Figure 5B, only the cells transfected with miR-146a mimic exhibited greater than 2-fold increase in the average number of GWB per cell similar to the increase observed with 8 hours LPS treatment (Figure 1B). This experiment was repeated using 15 nM, 7.5 nM, 3.75 nM, 1.8 nM, and 0.9 nM concentrations of miR-146a mimic, and a similar increase in size and number of GWB can be observed with as little as 1.8 nM miR-146a mimic (data not shown). Total RNA was also isolated from the transfected cells and the mRNA levels of TRAF6 and IRAK-1, the putative targets of miR-146a,23 were analyzed by qRT-PCR. THP-1 cells transfected with miR-146a mimic showed an 85% reduction in the mRNA level of TRAF6 and a 51% reduction in the level IRAK-1 compared to mock transfected cells (Figure 5C). These data indicate that miR-146a alone can induce a comparable increase in the size and number of GWB as in LPS-induced assembly of GWB and functionally can downregulate endogenous TRAF6 and IRAK-1 at the mRNA level as expected of cellular RNAi activity.
Figure 5. miR-146a alone can induce formation of GWB and repress TRAF6 and IRAK-1 mRNA.

THP-1 cells were transfected with 30nM miR-146a mimic or Cy3-labeled pre-miR negative control and incubated for 24 hours and compared to mock transfected cells. (A) GWB staining showed cells transfected with miR-146a mimic exhibited an increase in the number of GWB compared to mock and negative control (not shown). (B) Numbers of GWB were counted using CellProfiler image analysis software. Average and SEM is shown, n>300 cells analyzed. Asterisks (*) indicate P<0.0001 compared to mock transfected cells as determined by Mann-Whitney. (C) Total RNA was isolated from cells transfected with miR-146a mimic, negative control pre-miR, and mock transfected cells 48 hours after transfection and analyzed for TRAF6 and IRAK-1 mRNA expression by qRT-PCR as described in Methods. Average plus SD is shown, n=2 independent experiments.
To further demonstrate the role of miR-146a in LPS-induced GWB formation, THP-1 cells were transfected with miR-146a inhibitor and these cells were then stimulated with LPS and monitored for the change in GWB by immunofluorescence. As expected, LPS-induced GWB formation at 4, 8, and 24 hours was abolished in these miR-146a inhibitor transfected cells (Supplemental Figure 1A). In fact, after 4 and 8 hours of LPS treatment, GWB formation was decreased in cells transfected with miR-146a inhibitor. The efficiency of the inhibition of miR-146a function was monitored by the expression of its known mRNA targets TRAF6 and IRAK-1 and their levels were increased 3 and 4 fold, respectively compared to mock transfected cells (Supplemental Figure 1B).
miR-146a plays a role in the regulation of THP-1 cytokine and chemokine production
To examine the functional significance of miR-146a in LPS stimulation, cytokine and chemokine production in mock transfected cells compared to cells transfected with miR-146a mimic were monitored using quantitative multiplex cytokine analysis. The miR-146a mimic and mock transfected cells were treated with 2 μg/ml LPS for 24 hours and the culture supernatants were harvested and analyzed. Five detected cytokines/chemokines (IL-8, IP-10, IL-1β, IL-6 and MCP-1) exhibited decreased production in LPS-stimulated THP-1 cells transfected with miR-146a mimic compared to mock transfected cells (Figure 6). The production of IL-8, IP-10, and MCP-1 was decreased by approximately 70%, while that of IL-1β and IL-6 was decreased 89% and 92%, respectively (Figure 6). In these experiments the production of TNF-α was not affected by transfection of miR146a mimic, but this may be due to the low level of TNF-α produced 24 hours after LPS stimulation (data not shown). The negative effect of transfected miR-146a mimic on the production of IL-1β, IL-6, and IP-10 was reproduced in an independent experiment when cells were stimulated with LPS for 4, 8, or 24 hours (Supplemental Figure 2). These data demonstrate that the delivery of miR-146a prior to LPS stimulation inhibits LPS-mediated cytokine/chemokine production; the underlying mechanism may be that miR-146a regulates TRAF6 and IRAK-1 and ultimately results in the decreased production of these cytokines and chemokines.
Figure 6. Pre-transfection of miR-146a in THP-1 cells reduces LPS-induced cytokine/chemokine production.

THP-1 cells were transfected with miR-146a mimic, incubated for 48 hours, and then treated with LPS for 24 hours. Culture supernatants were collected from LPS treated and untreated cells. Multiplex analysis was used to quantitatively detect cytokines and chemokines as described in Methods. The cytokine/chemokine concentrations in LPS-treated culture supernatants were normalized to untreated culture supernatants and are shown in two panels since the scales are substantially different. Mock represents level of cytokines/chemokine induced by LPS alone after 24 hours. THP-1 cells transfected with miR-146a mimic exhibited decreased production of cytokines. Average plus SD is shown, n=2 independent experiments.
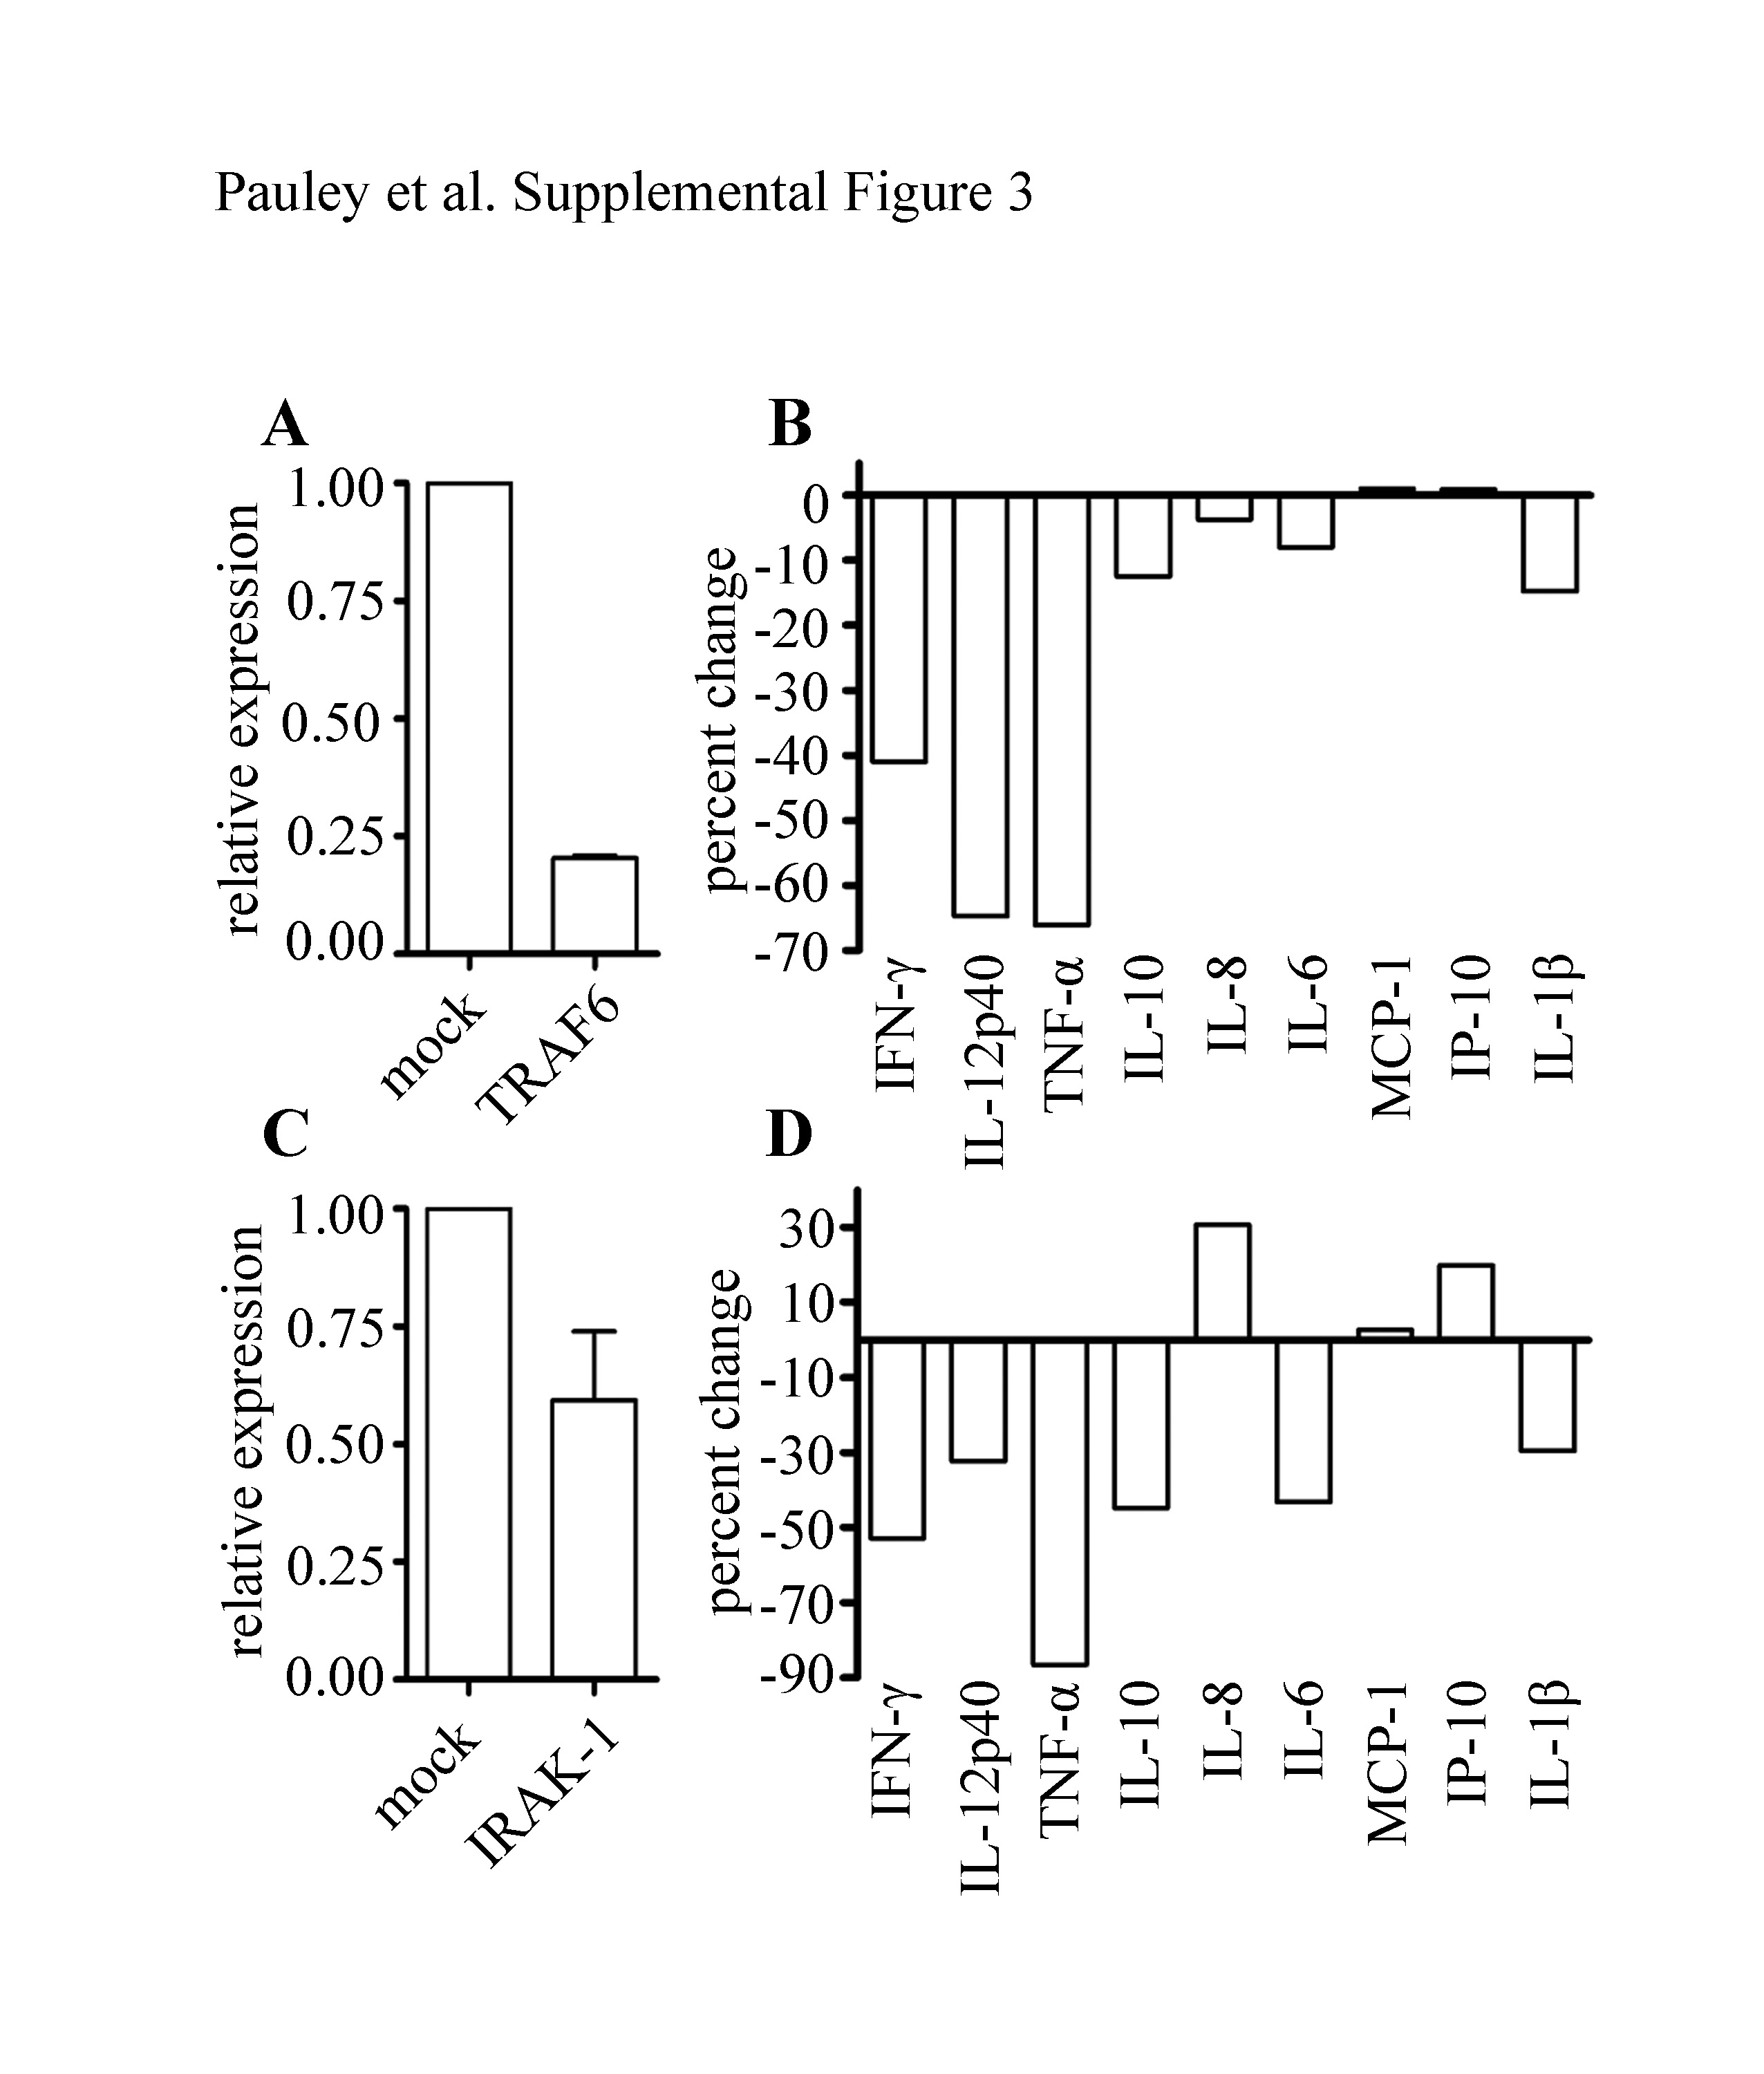
To further investigate this mechanism, a similar experiment was performed with TRAF6 or IRAK-1 deficient THP-1 cells. Cells transfected with siRNA for TRAF6 or IRAK-1 were stimulated with LPS and the production of different cytokines/chemokines were examined (Supplemental Figure 3, Table 1). IFN-γ, IL-12p40, and TNF-α exhibited up to a 70% reduction in production after TRAF6 depletion while IL-10, IL-8, IL-6, and IL-1β exhibited up to 20% decreased production. MCP-1 and IP-10 production was not affected by TRAF6 depletion. In IRAK-1 depleted cells, IL-8 and IP-10 production were slightly increased, MCP-1 production was not affected, and IFN-γ, IL-12p40, TNF-α, IL-10, IL-6, and IL-1β were decreased. These data indicate that miR-146a probably targets a number of proteins in addition to TRAF6 and IRAK-1 and may regulate the production of these cytokines indirectly via other mechanisms not yet understood.
Table 1.
miR-146a regulation of cytokines/chemokines in THP-1 cells.
| LPS induced Cytokine/Chemokinea |
Percent change in production in miR- 146a mimic transfected cellsb |
Percent change in production in TRAF6 deficient cellsc |
Percent change in production in IRAK-1 deficient cellsc |
|---|---|---|---|
| IP-10 | −65.5 | +0.9 | +19.9 |
| IL-8 | −73.0 | −3.7 | +30.7 |
| IL-1β | −89.1 | −14.8 | −29.6 |
| IL-6 | −92.3 | −8.0 | −43.2 |
| MCP-1 | −70.4 | +1.1 | +2.7 |
| TNF-α | No change | −66.1 | −86.6 |
| IL-12p40 | undetected | −64.7 | −32.3 |
| IFN-β | undetected | −40.9 | −52.9 |
| IL-10 | undetected | −12.5 | −44.9 |
Listed in order of level of production as shown in Figure 6.
Data from Figure 6.
Data from Supplemental Fig 3.
Discussion
Proposed model for miRNA-mediated GWB assembly after LPS stimulation
Our proposed model for the LPS-induced assembly of GWB via the miRNA pathway is illustrated in Figure 7. LPS binds to LPS-binding protein (LBP) which in turn is then transferred to CD14 on the cell surface (step 1).24 LPS-CD14 then interacts with TLR4 and its accessory protein MD-2. TLR4 stimulation by LPS activates signal transduction via MyD88 ultimately phosphorylating IκB (step 2). Phosphorylated IκB is then released from NFκB and degraded while NFκB translocates to the nucleus and activates the transcription of pro-inflammatory cytokines and miRNA including miR-146a, miR-155, and miR-132 (step 3) (Figure 3).23,24 Among these, miR-146a has the highest fold increase in expression in response to LPS (Figure 3).23
Figure 7. Model of LPS-induced GWB assembly.

See text in Discussion.
MicroRNA are transcribed as pri-miRNA, which are then processed into pre-miRNA by the Drosha/DGCR8 microprocessor complex (not shown). The pre-miRNA are exported into the cytoplasm by exportin 5 and cleaved by Dicer into mature miRNA duplexes, which are loaded into the Ago/RISC (RNA-induced silencing complex) where they bind their target mRNA (step 4).29 In the case of miR-146a, TRAF6 and IRAK-1, proteins in the MyD88 signaling pathway, are known target mRNAs (Figure 5C).23,30-33
The miRNA/RISC complex is enriched in GWB, although it is not clear whether miRNA/RISC complex is formed in the cytoplasm or if the miRNA is loaded into RISC inside GWB.3,4 The influx of miRNA duplexes from LPS stimulation results in ~2-fold increase in the number of GWB in cells within 8 hours of LPS exposure (step 5) as described in the current report. This expansion of GWB in the cytoplasm may allow, directly or indirectly, for more efficient inhibition of mRNA targets resulting in the ability of the cell to rapidly regulate signaling cascades and cytokine secretion. The increase in number and size of GWB may also be due to an accumulation of target mRNAs undergoing degradation by a limited amount of decay factors.34 An alternative interpretation may be that some of the mRNAs are being degraded independently of miRNA via a GWB mediated pathway, but this seems unlikely based on the evidence shown in this report of miRNA involvement.
The target mRNAs are translationally repressed (or degraded) resulting in a reduction of mRNA and protein expression of factors in the signal transduction pathway (step 6). TRAF6 and IRAK-1 regulation by miR-146a results in the subsequent blockage of NFκB activation leading to the downregulation of inflammatory cytokine production (Figure 6, Supplemental Figure 3). Disruption of the miRNA pathway would result in a lack of regulation after exposure to LPS. This lack of regulation would lead to overproduction of inflammatory cytokines and may also affect other monocyte functions but this will need further experimental validation.
GWB are biomarkers for miRNA activity
Our previous report showed that miRNA biogenesis is required for GWB assembly under normal cellular conditions.8 Specifically, when Drosha or DGCR8 was knocked down using short hairpin RNA plasmids to inhibit miRNA maturation at the pri-miRNA level, GWB were disassembled after mature miRNA were depleted. Our data showed that mature miRNA are required for normal GWB assembly, and exogenously introduced siRNA can act as a surrogate for endogenous miRNA to reassemble GWB.8 Our more recent study also showed that GWB assembly is also linked to siRNA activity.13 The transfection of siRNA into mammalian cells led to an increase in number and size of GWB, and this siRNA-induced GWB assembly was dependent on the presence of an endogenous target mRNA.13 Comparable to the data reported here for LPS-induced GWB, Rck/p54 and Ago2 proteins were found to be required for the siRNA-mediated increase in GWB.13 These reports show that GWB can serve as biomarkers for miRNA and siRNA activity.
In the present report, a more natural condition is employed with inducible miRNA from LPS stimulation demonstrating a mechanistic relationship between GWB and miRNA activity (Figure 7). It is likely that significant increase in miRNA-mediated activities during many cellular processes would result in increased number and size of GWB. Our data extend the current knowledge of GWB and their relationship to innate immune signaling, and are consistent with previous reports demonstrating GWB as biomarkers for miRNA and/or siRNA activity.8,13 Currently it is not possible to exclude the possibility that formation of GWB is influenced by other factors. For example, our earlier study demonstrated that the size and number of GWBs increases in response to changes in the cell cycle, in response to release of serum starvation, and in response to stimulation by concanavalin A.35 However, our current data showing that the formation of GWB is correlated with miRNA activity in the LPS stimulation of THP-1 cells and transfection plus knockdown experiments indicated that these GWB are consistent with miRNA activity – formation of GWB requires Ago2, Rck/p54, and miR-146a. Our new data suggest that a re-interpretation of these early findings may be warranted. Given that miRNA are expected to regulate 30% or more of the human genes, it is entirely feasible to consider that many miRNA activities take place during cell proliferation, cell cycle, and possibly also during concanavalin A stimulation which could result in the observed increases in the size and number of GWBs during these processes.
miR-146a regulates LPS-induced cytokine and chemokine production
Our present study demonstrated that transfection of miR-146a mimic resulted in decreased production of 5 cytokines/chemokines (IL-6, IP-10, IL-8, MCP-1, and IL-1β, Table 1) and this is consistent with a recent report31 describing the negative regulatory role of miR-146a on IL-1β production in human alveolar epithelial cells. Thus miR-146a is demonstrated here to regulate acute inflammatory response resulted from LPS stimulation by restricting cytokine production after the initial innate response. It is interesting that directly knocking down TRAF6 or IRAK-1 also resulted in decreased cytokine production. However, there are some discrepancies between these two sets of data. IP-10 and MCP-1 exhibit decreased production in miR-146a transfected cells, but are not affected by TRAF6 depletion (Table 1). These data suggest that miR-146a may regulate cytokine/chemokine production through other TRAF6/IRAK-1-independent mechanisms not yet understood.
In summary, our report has shown that GWB can serve as biomarkers for miRNA activity during innate immune signaling. miR-146a was demonstrated to play an important role in regulating human monocyte functions such as cytokine and chemokine production. These findings may be clinically significant for patients suffering from autoimmune diseases such as systemic lupus erythematosus, Sjögren's syndrome, and rheumatoid arthritis that are driven by the overproduction of inflammatory cytokines, and further investigations are needed to evaluate the therapeutic potential of these findings. It is intriguing to note that recent studies showed reduced miR-146a levels in peripheral blood leukocytes from patients with systemic lupus erythematosus and it was shown that this miRNA contribute to elevated level of Type I interferon in this disease.30 In contrast, elevated expression of miR-146a in rheumatoid arthritis was reported in peripheral blood leukocytes32 as well as in synovial fibroblasts and synovial tissues.36,37 Conceptually, the present study provides novel insights in demonstrating the potential role of examining the number of GWB in monocytes as an indicator for miRNA-mediated activity. It is however acknowledged that more studies are needed to examine the general nature of our observation and whether the same can be applied to other cell systems.
METHODS
Cell culture and LPS/cytokine treatment
THP-1 human monocytes obtained from American Type Culture Collection (Manassas, VA) were cultured in RPMI 1640 medium with 2 mM L-glutamine adjusted to contain 4.5 g/L glucose, 10 mM HEPES, and 1.0 mM sodium pyruvate and supplemented with 0.05 mM 2-mercaptoethanol and 10% fetal bovine serum. THP-1 cells were seeded at 5×10⁵ cells per well in a six-well plate and treated with 1 μg/ml LPS from Salmonella enterica serotype minnesota (Sigma, St. Louis, MO) unless stated otherwise. After designated treatment time, cells were harvested and washed once in PBS prior to analysis.
Immunofluorescence
THP-1 cells were cytospun onto glass slides at 1,000 rpm for 5 minutes. Cells were fixed in 3% paraformaldehyde for 10 minutes and permeabilized in 0.5% Triton X-100 for 5 minutes. GWB were detected with human anti-GWB sera (1:6000) and rabbit anti-Dcp1a (1:1000). Secondary antibodies used were Alexa Fluor 488 goat anti-human IgG (1:400) and Alexa Fluor 568 goat anti-rabbit IgG (1:400) from Molecular Probes (Carlsbad, CA). Slides were mounted using Vectashield Mounting Medium with 4′,6-diamidino-2-phenylindole (DAPI) (VECTOR Laboratories, Burlingame, CA). Fluorescence images were taken with Zeiss Axiovert 200M microscope and a Zeiss AxioCam MRm camera using the 20x or 40x 0.75 NA objectives. Color images were assessed using Adobe Photoshop version 7. GWB were counted using Cell-Profiler image analysis software.38
Western blots
THP-1 cell extracts were fractionated by 7.5% SDS-PAGE and transferred to nitrocellulose. The following antibodies and dilutions were used: rabbit anti-Ago2 antibodies 1:500; rabbit anti-Dcp1a antibodies 1:1,000; rabbit anti-Rck/p54 antibodies 1:500 (MBL International, Woburn, MA); mouse anti-tubulin antibodies 1:5,000; mouse anti-actin antibodies 1:10,000; rabbit anti-Drosha antibodies 1:500 (Abcam, Cambridge, MA); and rabbit anti-golgin-97 antibodies39 1:200. Secondary goat anti-mouse and anti-rabbit antibodies conjugated to horse radish peroxidase (HRP) were used at 1:10,000 dilutions (Southern Biotech, Birmingham, AL). Densitometric analysis of the developed film was performed using Image J software.40 Protein levels were normalized to tubulin and the fold change in protein level between LPS-treated and untreated samples was calculated for each time point.
Quantitative RT-PCR (qRT-PCR)
RNA isolates were prepared using the mirVana miRNA Isolation kit (Ambion, Austin, TX) according to the manufacturer's protocol. RNA concentrations were determined and equal amounts of each RNA sample were used for qRT-PCR. qRT-PCR was performed using the TaqMan MicroRNA Reverse Transcription Kit, TaqMan Universal PCR Master Mix, and TaqMan MicroRNA Assay primers for human miR-146a, human miR-132, human miR-155 and human let-7a (Applied Biosystems, Foster City, CA ). The cycle threshold (Ct) values, corresponding to the PCR cycle number at which fluorescence emission reaches a threshold above baseline emission, were determined and the miRNA expression, relative to untreated controls, was calculated using the 2ΔΔCt method.41
siRNA and miRNA
siRNAs targeting Rck/p54, Ago2, TRAF6, and IRAK-1 and miR-146a mimic (Ambion) were transfected into THP-1 cells at a final concentration of 40nM using Lipofectamine 2000 (Invitrogen, Carlsbad, CA) according to the manufacturer's instructions. To monitor the transfection efficiency, Cy3-labeled siRNA targeting lamin A/C or Cy3-labeled pre-miR-negative control (Ambion) were transfected into cells in parallel to all transfections, and at least 80% transfection efficiency was achieved. The siRNAs targeting Rck/p54 and Ago2 were purchased from Dharmacon (Lafayette, CO) and dissolved in 1x Universal buffer (provided by Dharmacon), and the resulting 20 μM stock was stored in aliquots at −80°C prior to use. The siRNAs targeting TRAF6 and IRAK-1 were purchased from Applied Biosystems, dissolved in molecular biology grade water, and stored at in 20 μM aliquots at −80°C. The sense and antisense strand sequences are listed below: hAgo2: 5′-GCA CGG AAG UCC AUC UGA A dTdT-3′ and 5′-UUC AGA UGG ACU UCC GUG C dTdT-3′;28 hRck/p54: 5′-GCA GAA ACC CUA UGA GAU UUU-3′ and 5′-AAU CUC AUA GGG UUU CUG CUU-3′;28 TRAF6: 5′-GGU UGU UUG CAC AAG AUG G dTdT-3′ and 5′-CCA UCU UGU GCA AAC AAC C dTdT-3′; IRAK-1: 5′-GGU UUC GUC ACC CAA ACA U dTdT-3′ and 5′-AUG UUU GGG UGA CGA AAC C dTdT-3′.
Multiplex analysis of cytokines
THP-1 cells were transfected as described above, and then treated with 2 μg/ml LPS for 24 hours in culture medium. The culture supernatant was then harvested and frozen at −80°C for storage before multiplex analysis. The human cytokine/chemokine LINCOplex premixed kit (Millipore, Billerica, MA) or Beadlyte human 22-plex multi-cytokine detection system (Millipore) were used according to the manufacturer's protocol to quantitatively detect the following human cytokines/chemokines: IFN-γ, IL-1β, IL-6, IL-10, IP-10, IL-12p40, MCP-1, TNF-α, and IL-8. Samples were analyzed on a Luminex 200 system (Luminex, Austin, TX).
Statistical analysis
All values are shown as the mean ± SEM or SD of data. Comparison between groups was made with the Student's t test or Mann Whitney test as indicated in figure legends. P<0.05 was considered significant.
Supplementary Material
THP-1 cells were transfected with 40nM miR-146a inhibitor and incubated for 48 hours. Transfected and mock-transfected cells were then stimulated with LPS for 4, 8, and 24 hours. A) The LPS-induced increase in GWB formation was abolished after transfection with miR-146a inhibitor. B) TRAF6 and IRAK-1 mRNA levels were 3 and 4-fold higher in cells transfected with miR-146a inhibitor compared to mock transfected cells.
THP-1 cells were transfected with 40nM miR-146a mimic or miR-146a inhibitor and incubated for 48 hours prior to stimulation with LPS for 4, 8, and 24 hours. Culture supernatants were collected and multiplex analysis was used for cytokine production analysis. Cytokine production was notably decreased in miR-146a mimic transfected cells compared to mock and inhibitor transfected cells.
siRNAs targeting TRAF6 (A) or IRAK-1 (C) were transfected into THP-1 cells and knockdown efficiency was determined using qRT-PCR. Forty-eight hours after transfection, mock transfected, TRAF6 deficient (B) or IRAK-1 deficient (D) cells were stimulated with LPS for 24 hours. Cytokine production in culture supernatants was measured using a multiplex assay. Percent change between mock and TRAF6 or IRAK-1 deficient cells is shown.
ACKNOWLEDGEMENTS
The authors wish to thank Dr. J. Lykke-Andersen, University of Colorado, for providing the rabbit anti-Dcp1a antibody and Dr. T. Hobman, University of Alberta, for providing the rabbit anti-Ago2 antibody. We also thank Drs. Anne E. Carpenter and Thouis R. Jones, Whitehead Institute for Biomedical Research, for providing the CellProfiler software and technical support. This work was supported in part by National Institute of Health grant AI47859 and AR051766 and grants from the Lupus Research Institute. K.M.P. was supported by NIDCR oral biology training grant T32 DE007200.
Abbreviations used in this paper
- Ago2
argonaute 2
- ARE
AU-rich element
- GWB
GW bodies or processing bodies
- LPS
lipopolysaccharide
- IRAK-1
IL-1 receptor associated kinase
- MCP-1
monocyte chemoattractant protein-1
- miRNA
microRNA
- RISC
RNA-induced silencing complex
- RNAi
RNA interference
- siRNA
small interfering RNA
- TLR4
toll like receptor 4
- TRAF6
TNF receptor-associated factor 6
- UTR
untranslated region
References
- 1.Eystathioy T, Chan EKL, Tenenbaum SA, Keene JD, Griffith K, Fritzler MJ. A phosphorylated cytoplasmic autoantigen, GW182, associates with a unique population of human mRNAs within novel cytoplasmic speckles. Mol. Biol. Cell. 2002;13:1338–51. doi: 10.1091/mbc.01-11-0544. [DOI] [PMC free article] [PubMed] [Google Scholar]
- 2.Eystathioy T, Chan EKL, Takeuchi K, Mahler M, Luft LM, Zochodne DW, et al. Clinical and serological associations of autoantibodies to GW bodies and a novel cytoplasmic autoantigen GW182. J. Mol. Med. 2003;81:811–8. doi: 10.1007/s00109-003-0495-y. [DOI] [PubMed] [Google Scholar]
- 3.Eulalio A, Behm-Ansmant I, Izaurralde E. P bodies: at the crossroads of post-transcriptional pathways. Nat. Rev. Mol. Cell. Biol. 2007;8:9–22. doi: 10.1038/nrm2080. [DOI] [PubMed] [Google Scholar]
- 4.Jakymiw A, Pauley KM, Li S, Ikeda K, Lian S, Eystathioy T, et al. The role of GW/P-bodies in RNA processing and silencing. J. Cell. Sci. 2007;120:1317–23. doi: 10.1242/jcs.03429. [DOI] [PubMed] [Google Scholar]
- 5.Filipowicz W, Bhattacharyya SN, Sonenberg N. Mechanisms of post-transcriptional regulation by microRNAs: are the answers in sight? Nat. Rev. Genet. 2008;9:102–14. doi: 10.1038/nrg2290. [DOI] [PubMed] [Google Scholar]
- 6.Parker R, Sheth U. P bodies and the control of mRNA translation and degradation. Mol. Cell. 2007;25:635–46. doi: 10.1016/j.molcel.2007.02.011. [DOI] [PubMed] [Google Scholar]
- 7.Jakymiw A, Lian S, Eystathioy T, Li S, Satoh M, Hamel JC, et al. Disruption of GW bodies impairs mammalian RNA interference. Nat. Cell. Biol. 2005;7:1267–74. doi: 10.1038/ncb1334. [DOI] [PubMed] [Google Scholar]
- 8.Pauley KM, Eystathioy T, Jakymiw A, Hamel JC, Fritzler MJ, Chan EKL. Formation of GW bodies is a consequence of miRNA genesis. EMBO. Rep. 2006;7:904–10. doi: 10.1038/sj.embor.7400783. [DOI] [PMC free article] [PubMed] [Google Scholar]
- 9.Pillai RS, Bhattacharyya SN, Artus CG, Zoller T, Cougot N, Basyuk E, et al. Inhibition of translational initiation by Let-7 MicroRNA in human cells. Science. 2005;309:1573–6. doi: 10.1126/science.1115079. [DOI] [PubMed] [Google Scholar]
- 10.Liu J, Rivas FV, Wohlschlegel J, Yates JR, III, Parker R, Hannon GJ. A role for the P-body component GW182 in microRNA function. Nat. Cell. Biol. 2005;7:1261–6. doi: 10.1038/ncb1333. [DOI] [PMC free article] [PubMed] [Google Scholar]
- 11.Meister G, Landthaler M, Peters L, Chen PY, Urlaub H, Luhrmann R, et al. Identification of novel argonaute-associated proteins. Curr. Biol. 2005;15:2149–55. doi: 10.1016/j.cub.2005.10.048. [DOI] [PubMed] [Google Scholar]
- 12.Sen GL, Blau HM. Argonaute 2/RISC resides in sites of mammalian mRNA decay known as cytoplasmic bodies. Nat. Cell. Biol. 2005;7:633–6. doi: 10.1038/ncb1265. [DOI] [PubMed] [Google Scholar]
- 13.Lian S, Fritzler MJ, Katz J, Hamazaki T, Terada N, Satoh M, et al. Small Interfering RNA-mediated Silencing Induces Target-dependent Assembly of GW/P Bodies. Mol. Biol. Cell. 2007;18:3375–87. doi: 10.1091/mbc.E07-01-0070. [DOI] [PMC free article] [PubMed] [Google Scholar]
- 14.Eulalio A, Behm-Ansmant I, Schweizer D, Izaurralde E. P-body formation is a consequence, not the cause, of RNA-mediated gene silencing. Mol. Cell. Biol. 2007;27:3970–81. doi: 10.1128/MCB.00128-07. [DOI] [PMC free article] [PubMed] [Google Scholar]
- 15.Khabar KS. The AU-rich transcriptome: more than interferons and cytokines, and its role in disease. J. Interferon. Cytokine. Res. 2005;25:1–10. doi: 10.1089/jir.2005.25.1. [DOI] [PubMed] [Google Scholar]
- 16.Jing Q, Huang S, Guth S, Zarubin T, Motoyama A, Chen J, et al. Involvement of microRNA in AU-rich element-mediated mRNA instability. Cell. 2005;120:623–34. doi: 10.1016/j.cell.2004.12.038. [DOI] [PubMed] [Google Scholar]
- 17.Takahashi H, Maeda M, Sawa H, Hasegawa H, Moriyama M, Sata T, et al. Dicer and positive charge of proteins decrease the stability of RNA containing the AU-rich element of GM-CSF. Biochem. Biophys. Res. Commun. 2006;340:807–14. doi: 10.1016/j.bbrc.2005.12.071. [DOI] [PubMed] [Google Scholar]
- 18.Vasudevan S, Tong Y, Steitz JA. Switching from repression to activation: microRNAs can up-regulate translation. Science. 2007;318:1931–4. doi: 10.1126/science.1149460. [DOI] [PubMed] [Google Scholar]
- 19.Bhattacharyya SN, Habermacher R, Martine U, Closs EI, Filipowicz W. Relief of microRNA-mediated translational repression in human cells subjected to stress. Cell. 2006;125:1111–24. doi: 10.1016/j.cell.2006.04.031. [DOI] [PubMed] [Google Scholar]
- 20.Gantier MP, Sadler AJ, Williams BR. Fine-tuning of the innate immune response by microRNAs. Immunol. Cell. Biol. 2007;85:458–62. doi: 10.1038/sj.icb.7100091. [DOI] [PubMed] [Google Scholar]
- 21.Taganov KD, Boldin MP, Baltimore D. MicroRNAs and immunity: tiny players in a big field. Immunity. 2007;26:133–7. doi: 10.1016/j.immuni.2007.02.005. [DOI] [PubMed] [Google Scholar]
- 22.Perry MM, Moschos SA, Williams AE, Shepherd NJ, Larner-Svensson HM, Lindsay MA. Rapid changes in microRNA-146a expression negatively regulate the IL-1beta-induced inflammatory response in human lung alveolar epithelial cells. J. Immunol. 2008;180:5689–98. doi: 10.4049/jimmunol.180.8.5689. [DOI] [PMC free article] [PubMed] [Google Scholar]
- 23.Taganov KD, Boldin MP, Chang KJ, Baltimore D. NF-B-dependent induction of microRNA miR-146, an inhibitor targeted to signaling proteins of innate immune responses. Proc. Natl. Acad. Sci. U S. A. 2006;103:12481–6. doi: 10.1073/pnas.0605298103. [DOI] [PMC free article] [PubMed] [Google Scholar]
- 24.Guha M, Mackman N. LPS induction of gene expression in human monocytes. Cell. Signal. 2001;13:85–94. doi: 10.1016/s0898-6568(00)00149-2. [DOI] [PubMed] [Google Scholar]
- 25.Thai TH, Calado DP, Casola S, Ansel KM, Xiao C, Xue Y, et al. Regulation of the germinal center response by microRNA-155. Science. 2007;316:604–8. doi: 10.1126/science.1141229. [DOI] [PubMed] [Google Scholar]
- 26.Rodriguez A, Vigorito E, Clare S, Warren MV, Couttet P, Soond DR, et al. Requirement of bic/microRNA-155 for normal immune function. Science. 2007;316:608–11. doi: 10.1126/science.1139253. [DOI] [PMC free article] [PubMed] [Google Scholar]
- 27.Vigorito E, Perks KL, breu-Goodger C, Bunting S, Xiang Z, Kohlhaas S, et al. microRNA-155 regulates the generation of immunoglobulin class-switched plasma cells. Immunity. 2007;27:847–59. doi: 10.1016/j.immuni.2007.10.009. [DOI] [PMC free article] [PubMed] [Google Scholar]
- 28.Chu CY, Rana TM. Translation Repression in Human Cells by MicroRNA-Induced Gene Silencing Requires RCK/p54. PLoS. Biol. 2006;4:e210. doi: 10.1371/journal.pbio.0040210. [DOI] [PMC free article] [PubMed] [Google Scholar]
- 29.Du T, Zamore PD. microPrimer: the biogenesis and function of microRNA. Development. 2005;132:4645–52. doi: 10.1242/dev.02070. [DOI] [PubMed] [Google Scholar]
- 30.Tang Y, Luo X, Cui H, Ni X, Yuan M, Guo Y, et al. MicroRNA-146A contributes to abnormal activation of the type I interferon pathway in human lupus by targeting the key signaling proteins. Arthritis Rheum. 2009;60:1065–75. doi: 10.1002/art.24436. [DOI] [PubMed] [Google Scholar]
- 31.Perry MM, Moschos SA, Williams AE, Shepherd NJ, Larner-Svensson HM, Lindsay MA. Rapid changes in microRNA-146a expression negatively regulate the IL-1beta-induced inflammatory response in human lung alveolar epithelial cells. J. Immunol. 2008;180:5689–98. doi: 10.4049/jimmunol.180.8.5689. [DOI] [PMC free article] [PubMed] [Google Scholar]
- 32.Pauley KM, Satoh M, Chan AL, Bubb MR, Reeves WH, Chan EKL. Upregulated miR-146a expression in peripheral blood mononuclear cells from rheumatoid arthritis patients. Arthritis Res. Ther. 2008;10:R101. doi: 10.1186/ar2493. [DOI] [PMC free article] [PubMed] [Google Scholar]
- 33.Hou J, Wang P, Lin L, Liu X, Ma F, An H, et al. MicroRNA-146a Feedback Inhibits RIG-I-Dependent Type I IFN Production in Macrophages by Targeting TRAF6, IRAK1, and IRAK2. J. Immunol. 2009;183:2150–8. doi: 10.4049/jimmunol.0900707. [DOI] [PubMed] [Google Scholar]
- 34.Franks TM, Lykke-Andersen J. TTP and BRF proteins nucleate processing body formation to silence mRNAs with AU-rich elements. Genes. Dev. 2007;21:719–35. doi: 10.1101/gad.1494707. [DOI] [PMC free article] [PubMed] [Google Scholar]
- 35.Yang Z, Jakymiw A, Wood MR, Eystathioy T, Rubin RL, Fritzler MJ, et al. GW182 is critical for the stability of GW bodies expressed during the cell cycle and cell proliferation. J. Cell. Sci. 2004;117:5567–78. doi: 10.1242/jcs.01477. [DOI] [PubMed] [Google Scholar]
- 36.Stanczyk J, Pedrioli DM, Brentano F, Sanchez-Pernaute O, Kolling C, Gay RE, et al. Altered expression of MicroRNA in synovial fibroblasts and synovial tissue in rheumatoid arthritis. Arthritis. Rheum. 2008;58:1001–9. doi: 10.1002/art.23386. [DOI] [PubMed] [Google Scholar]
- 37.Nakasa T, Miyaki S, Okubo A, Hashimoto M, Nishida K, Ochi M, et al. Expression of microRNA-146 in rheumatoid arthritis synovial tissue. Arthritis. Rheum. 2008;58:1284–92. doi: 10.1002/art.23429. [DOI] [PMC free article] [PubMed] [Google Scholar]
- 38.Carpenter AE, Jones TR, Lamprecht MR, Clarke C, Kang IH, Friman O, et al. CellProfiler: image analysis software for identifying and quantifying cell phenotypes. Genome. Biol. 2006;7:R100. doi: 10.1186/gb-2006-7-10-r100. [DOI] [PMC free article] [PubMed] [Google Scholar]
- 39.Griffith KJ, Chan EKL, Lung CC, Hamel JC, Guo X, Miyachi K, et al. Molecular cloning of a novel 97-kd Golgi complex autoantigen associated with Sjogren's syndrome. Arthritis. Rheum. 1997;40:1693–702. doi: 10.1002/art.1780400920. [DOI] [PubMed] [Google Scholar]
- 40.Abramoff MD, Magelhaes PJ, Ram SJ. Image Processing with ImageJ. Biophotonics International. 2004;11:36–42. [Google Scholar]
- 41.Livak KJ, Schmittgen TD. Analysis of relative gene expression data using real-time quantitative PCR and the 2(-Delta Delta C(T)) Method. Methods. 2001;25:402–8. doi: 10.1006/meth.2001.1262. [DOI] [PubMed] [Google Scholar]
Associated Data
This section collects any data citations, data availability statements, or supplementary materials included in this article.
Supplementary Materials
THP-1 cells were transfected with 40nM miR-146a inhibitor and incubated for 48 hours. Transfected and mock-transfected cells were then stimulated with LPS for 4, 8, and 24 hours. A) The LPS-induced increase in GWB formation was abolished after transfection with miR-146a inhibitor. B) TRAF6 and IRAK-1 mRNA levels were 3 and 4-fold higher in cells transfected with miR-146a inhibitor compared to mock transfected cells.
THP-1 cells were transfected with 40nM miR-146a mimic or miR-146a inhibitor and incubated for 48 hours prior to stimulation with LPS for 4, 8, and 24 hours. Culture supernatants were collected and multiplex analysis was used for cytokine production analysis. Cytokine production was notably decreased in miR-146a mimic transfected cells compared to mock and inhibitor transfected cells.
siRNAs targeting TRAF6 (A) or IRAK-1 (C) were transfected into THP-1 cells and knockdown efficiency was determined using qRT-PCR. Forty-eight hours after transfection, mock transfected, TRAF6 deficient (B) or IRAK-1 deficient (D) cells were stimulated with LPS for 24 hours. Cytokine production in culture supernatants was measured using a multiplex assay. Percent change between mock and TRAF6 or IRAK-1 deficient cells is shown.