

Abstract
The α4β7 integrin promotes homing of T cells to intestinal sites. The α4 integrin subunit that pairs with β7 integrin can also pair with β1 integrin. Here, we show that the preferential pairing of β1 integrin with α4 integrin regulates the expression of α4β7 on T cells. In the absence of β1 integrin, naïve mouse CD4 T cells have increased α4β7 expression, resulting in increased adhesion to MAdCAM-1 and enhanced homing to Peyer’s patches. In a reciprocal manner, over-expression of β1 integrin causes the loss of α4β7 expression and decreased homing to Peyer’s patches. A similar upregulation of β1 integrin and suppression of α4β7 expression occurs rapidly following CD4 T cell activation. β1 integrin thus dominates β7 integrin for α4 integrin pairing, thereby controlling the abundance of unpaired α4 integrin. Increasing the abundance of α4 integrin relative to β1 integrin is critical to retinoic acid-mediated expression of α4β7 integrin during T cell activation. In the absence of β1 integrin, endogenous antigen-specific CD4 T cells uniformly express high levels of α4β7 following Listeria monocytogenes infection. The resulting β1-deficient early memory T cells have decreased localization to the bone marrow and enhanced localization to Peyer’s patches following infection. Thus, the preferential association of β1 integrin with α4 integrin suppresses α4β7 integrin expression and regulates the localization of memory CD4 T cells.
INTRODUCTION
Integrins are heterodimeric cell surface expressed adhesion molecules composed of non-covalently linked α and β subunits (1). T cells express several integrin family members that are involved in activation, trafficking, and retention in tissue (2, 3). On T cells, the α4 integrin subunit associates with either the β1 subunit, to form α4β1 (VLA-4) integrin, or the β7 subunit, to form α4β7 (LPAM) integrin. Both α4β1 and α4β7 are expressed at low levels on naïve T cells (4). The β7 integrin subunit can also pair with the αE subunit, which is expressed on naïve CD8 T cells (5) and CD4 regulatory T cells (6) but not naïve CD4 T cells. The α4 integrins, along with αLβ2 (LFA-1), promote recirculation through secondary lymphoid organs at steady state (3, 7). Although α4β1 also localizes to the immunological synapse that forms between a T cell and APC (8), the in vivo relevance of α4 integrins for T cell activation by APCs remains unclear (9, 10).
During T cell activation, the expression of integrins changes in order to promote the entry of T cells into non-lymphoid sites. In contrast to low levels of both β1 and β7 integrin on naïve CD4 T cells, human memory CD4 T cells express either high levels of α4β1 or high levels of α4β7 integrin (4, 11, 12). This reciprocal high expression of either α4β1 or α4β7 promotes altered trafficking properties based on the site-specific expression of the α4β1 ligand VCAM-1 and the α4β7 ligand MAdCAM-1. VCAM-1 is expressed at high levels on the vasculature of the bone marrow (BM)2 and the inflamed brain (13). Thus, α4β1 expression is critical for effector/memory T cell entry into these sites (10, 14). In contrast, MAdCAM-1 is specifically expressed at steady state on the venules of the mesenteric lymph node (mLN) and Peyer’s patches (PP), and becomes highly upregulated on intestinal venules during inflammation (15, 16). Expression of α4β7 on T cells has been associated with preferential trafficking to the intestine (17). The role α4 integrins play in directing site-specific homing has made them attractive therapeutic targets for treatment of multiple sclerosis and inflammatory bowel disease (IBD) (18, 19).
Recent studies have identified T cell extrinsic factors that control the expression of α4β7 and the generation of “gut homing” T cells (20). This work has revealed that retinoic acid (RA) produced by intestinal dendritic cells (DC) and/or stromal cells specifically promotes expression of α4β7 and CCR9 on T cells (21–23). In contrast, the vitamin D metabolite, 1,25 dihydroxy-VitD3, suppresses RA-driven induction of α4β7 and CCR9 while enhancing the expression of skin-homing molecules in human T cells (24, 25). These results suggest that the regulation of homing molecules during T cell activation involves the integration of a variety of both positive and negative signals.
The T cell intrinsic factors that regulate the expression of α4 integrins on T cells are not known. As both α4β7 and α4β1 share a common α subunit, we predict that their expression is interrelated. In this study, we show that the loss of β1 integrin on mouse CD4 T cells results in increased α4β7 expression, while high level expression of β1 integrin results in the loss of α4β7 expression. Interestingly, alterations in β7 integrin do not produce reciprocal changes in β1 integrin expression. We demonstrate that β1 integrin regulates the expression of α4β7 expression through preferential pairing with α4 integrin. In the absence of β1 integrin, CD4 T cells aberrantly express high levels of α4β7 in the spleen, resulting in enhanced localization to the PP and reduced maintenance in the BM.
METHODS
Mice
β1 integrin “floxed” mice (26) were backcrossed to the C57BL/6 background for >14 generations and then crossed with CD4-Cre transgenic mice (27). β7 integrin-deficient mice were purchased from The Jackson Laboratories (28). hCAR transgenic mice (29) were provided by Dr. C. Weaver (Universityof Alabama-Birmingham). All mice were housed and bred under specific-pathogen free conditions and generally used between the ages of 6–12 weeks. All experimental procedures were approved by the Institutional Animal Care and Use Committee at the University of Minnesota.
Cell preparation and flow cytometry
Single cell suspensions were prepared from the spleen, lymph nodes, BM, and PP by mashing through cell strainers. BM cells were flushed from bilateral, hindleg tibias and femurs using PBS/2% calf-serum. PP were dissected from the small intestine, mechanically disrupted, and digested in HBSS/HEPES/10% calf serum + 400 U/ml Collagenase D (Roche, Basel, Switzerland) for 30–45 minutes at 37°C. Purified T cells were obtained using negative selection by depleting cells expressing B220, I-Ab, CD16/32 (antibodies all from eBioscience, San Diego, CA) using MACS LS columns (Miltenyi Biotec, Auburn, CA). For naïve CD4 T cell purification, anti-CD8a and anti-CD44 (both from eBioscience) were also added. For flow cytometry, 1–5×10⁶ cells were stained in HBSS/0.2% sodium azide/2% calf-serum (FACS buffer) for 20–30 minutes at 4°C. Samples were collected on a BD LSRII (BD Biosciences, San Jose, CA) and analyzed with FlowJo software (Tree Star, Inc., Ashland, OR).
Intracellular integrin staining
Following CD4 T cell purification (~95% purity), cells were resuspended in 0.01% pronase (EMD Chemicals, Darmstadt, Germany) in PBS for 30–45 mins at 37 °C to non-specifically remove cell surface proteins. Samples were washed twice with FACS buffer supplemented with 10% calf-serum, and then fixed with 2% paraformaldehyde for 25 minutes at room temperature. Fixed samples were stained once prior to permeabilization with the same antibodies to be used for intracellular staining. Cells were permeabilized using 0.02% Triton-X100 in PBS/0.2% BSA for 7–9 minutes at room temperature. Staining for intracellular integrin was done for 20–30 minutes at room temperature with anti-β1 integrin (HMβ1.1-APC) (Biolegend, San Diego, CA) and anti-β7 integrin (M293-PE) (BD Bioscience) antibodies.
Adhesion assays
Adhesion assays were generally performed as previously described (30). Purified T cells labeled with calcein-AM (Invitrogen, Carlsbad, CA) were added to wells coated with recombinant mouse VCAM-1 (0.6 μg/ml), MAdCAM-1 (6 μg/ml), or ICAM-1 (6 μg/ml) (R&D Systems, Minneapolis, MN). Cells were incubated with anti-CD3ε (2C11) (eBioscience) and integrin blocking anti-β1 (Ha2/5, 10 μg/ml), anti-β7 (Fib27, 10 μg/ml), or anti-αL (M17/4, 10 μg/ml) (all from BD Bioscience) antibodies for a 15 minute binding time at 4°C followed by a 15 minute stimulation at 37°C. Wells were washed and the percentage of adherent cells was determined by comparing well fluorescence post-wash to pre-wash. For adhesion assays with adenovirus transduced cells, flow cytometry was used to quantify percentage of adherent Thy1.1 high CD4 cells following stimulation with 50 ng/ml PMA (phorbol 12-myristate 13-acetate).
Short-term in vivo co-homing assays
Lymph nodes cells from β1wt/wtCD4-Cre+ and β1fl/flCD4-Cre+ mice (or Thy1.1 and β1wt virus transduced T cells) were labeled with either Cell Tracker Green CMFDA (0.25μM) or Cell Tracker Orange CMTMR (2μM) (Invitrogen). Reversing these colors did not alter the experimental outcome. Cells were then equally mixed and i.v. injected at 5–10×106 cells/mouse. An aliquot of the mixture was taken prior to injection to serve as the input control. At 2 or 24 hours post-injection the indicated organs were harvested. Transferred cells were identified by intravital labels and CD4 staining by flow cytometry. For the adenovirus transduced T cell co-homing assays, Thy1.1 staining was additionally used to identify transduced cells. The homing index (HI) was calculated as previously described (31).
Mixed bone marrow chimeras
Mixed bone marrow chimeras were generated by mixing T cell-depleted bone marrow cells from β1wt/wtCD4-Cre+ (CD45.1/45.2) and β1fl/flCD4-Cre+ (CD45.2) mice and transferring 5–10×106 cells i.v. into irradiated (1000 cGy) B6.SJL (CD45.1) recipients. Tissues were harvested 8–15 wks post-BM transplant and single cell suspensions were FACS stained for CD3ε, CD4, CD8α, B220, CD45.1, CD45.2, and CD44. The percentage of CD45.2+ and CD45.1/45.2+ CD4+CD44low T cells recovered from each organ was normalized to the percentage recovered from the spleen.
In vitro stimulation assay
Purified naïve T cells labeled with 5 μM CFSE were stimulated with plate-bound anti-CD3ε (3 μg/ml)/anti-CD28 (3 μg/ml) and maintained in T cell proliferation media (TCPM) (RPMI Medium 1640 with L-glutamine and 25 mM HEPES (Invitrogen) supplemented with 10% fetal bovine serum (Atlanta Biologicals, Lawrenceville, GA), 100 mM sodium pyruvate, penicillin/streptomycin, and 55 μM 2-mercaptoethanol). Cells were harvested at three days following plating and FACS stained for CD4, β1 integrin (HMβ1.1-APC) (Biolegend), α4 integrin (R1-2-PE) (eBioscience), and α4β7 (DATK32-Bio, SA-PECy7) (eBioscience). For the retinoic acid (RA) treatment experiments, RA (R2625, Sigma-Aldrich, St. Louis, MO) was added at 1000 nM in DMSO to the TCPM at the start of stimulation and cells were harvested after two days. DMSO carrier alone was added to “No RA” samples.
Adenovirus production and transduction
Murine β1 integrin (mCD29) and α4 integrin (mCD49d) cDNA clones (Open Biosystems, Huntsville, AL) were subcloned by PCR into the pENTR-UP-IT vector using SalI and Bam HI restriction sites. The production of adenovirus and transduction of T cells was performed as previously described (29, 32, 33). Isolated lymph node cells from hCAR expressing mice were transduced with either Thy1.1 control or integrin virus and cultured for 2–3 days in TCPM plus 10 ng/ml mouse IL-7 (R&D Systems) then FACS stained for CD4, β1 integrin, α4 integrin, and α4β7 integrin as above.
Quantitative real-time RT-PCR
1–3×10⁶ purified CD4 T cells were homogenized using QIAshredder and RNA was isolated with an RNeasy kit (QIAGEN, Valencia, CA). cDNA was produced from equivalent amounts of RNA with the SuperscriptIII Platinum Two-Step qRT-PCR kit (Invitrogen) and the PCR products were amplified with the Fast Start SYBR Green Master mix (Roche). Samples were detected on ABI PRISM 7000 (Applied Biosystems, Foster City, CA). Hypoxanthine-guanine phosphoribosyl transferase (HPRT) was used to normalize samples and the comparative CT method was used to quantify relative mRNA expression (34). Primers were designed using Primer Express (Applied Biosystems). The primer sets used were: HPRT (forward primer 5′-CTTCCTCCTCAGACCGCTTT-3′, reverse primer 5′-ACCTGGTTCATCATCGCTAA-3′); α4 integrin (forward primer 5′-AATTGGACCAAGTGAGGGACAA-3′, reverse primer 5′-TCGCTAGATCCATACACAAATGAAGT-3′); β1 integrin (forward primer 5′-AATGCCAAATCTTGCGGAGAA-3′, reverse primer 5′-TCTAAATCATCACATCGTGCAGAAGTA-3′); β2 integrin (forward primer 5′-GATAACATGTACAAGAGGAGCAATGAGT-3′, reverse primer 5′-CGCAAAGATGGGCTGGAT-3′); β7 integrin (forward primer 5′-TGCAGCTCATCATGGATGCTTA-3′, reverse primer 5′-CCGTCTTCTCAGGACCCTTACA-3′).
Listeria infections and pMHCII-tetramer enrichments
Mice were infected intravenously (i.v.) with 1×10⁷ CFUs of ActA-deficient Listeria monocytogenes expressing 2W1S (A−Lm-2W1S) (35). 2W1S:I-Ab tetramer production, staining, and T cell enrichment were completed as previously described (36, 37). The enriched fraction of cells was FACS stained with an antibody cocktail for CD3ε, CD4, CD8α, and CD44. B220, CD11b, CD11c and F4/80 were used in a dump gate to exclude cells binding tetramer nonspecifically. CD11b and F4/80 were not used in the dump gate for the PP. Some samples were additionally labeled with anti-β7 integrin (Fib504-PE) (Biolegend) alone or anti-β1 integrin (HMβ1.1-PB) (eBioscience) and anti-α4β7 (DATK32-PE) (eBioscience). Total tetramer positive events were enumerated using CALTAG Counting Beads (Invitrogen). Assuming that only 20% of total body BM cells are resident in the hindlimb (38), the number of tetramer positive cells in the BM was multiplied by five to obtain total BM cell numbers (14). The steady state percentage of cells in the BM and PP was calculated on a per mouse basis by dividing the number of 2W1S-specific CD4 T cells recovered from these tissues by the number recovered from the spleen of the same mouse.
Statistical analysis
All statistical analysis was performed using GraphPad Prism software 5.0 (La Jolla, CA). Two-tailed t-test or 1 way-ANOVA followed by Tukey’s multiple comparison test were used to assess significance.
RESULTS
Loss of β1 integrin on CD4 T cells results in increased surface expression of α4β7
To evaluate the function of β1 integrin on T cells, we crossed mice with a “floxed” β1 integrin gene (β1fl/fl) (26) with transgenic mice expressing Cre recombinase under the control of the CD4 promoter (CD4-Cre) (27). In β1fl/flCD4-Cre+ mice (β1−/− mice), there is a complete loss of β1 integrin on the majority of CD4 T cells collected from peripheral lymph nodes when compared to β1wt/wtCD4-Cre+ controls (Fig. 1A). However, the surface expression of α4 integrin, a major pairing partner for β1 integrin, remained unchanged on β1−/− CD4 T cells. As intracellular α/β subunit pairing is required for cell surface integrin expression, this suggests that enhanced cell surface expression of β7 integrin, the other known pairing partner for α4 integrin, is responsible for maintaining α4 integrin expression on β1−/− T cells. Using an antibody that specifically recognizes the α4β7 integrin, we found that α4β7 was significantly elevated on β1−/−CD4 T cells (Figs. 1A and 1B). The loss of β1 integrin did not result in changes in mRNA levels for either the α4 integrin subunit or the β7 integrin subunit (Fig. 1C), consistent with the idea that enhanced α4β7 expression is occurring at the level of α/β subunit pairing. The enhanced surface expression of α4β7 observed on β1−/− T cells suggests that wild-type CD4 T cells may contain intracellular stores of β7 integrin that are capable of pairing with unpaired α4 integrin. We utilized pronase to remove cell surface proteins from naïve CD4 T cells, followed by permeabilization and staining with anti-integrin antbodies to assess expression of intracellular integrin subunits. Wild-type CD4 T cells had clearly detectable levels of intracellular β7 integrin subunit (Fig. 1D).
Figure 1. Loss of β1 integrin on mouse CD4 T cells results in increased surface expression of α4β7.

(A) Representative FACS staining of inguinal lymph node cells from β1wt/wtCD4-Cre+ (wt) and β1fl/flCD4-Cre+ (β1−/−) mice gated on Thy1.2 and CD4 double positive cells using anti-β1 integrin, anti-α4 integrin, and anti-α4β7 integrin antibodies. Light gray histograms represent appropriate isotype control (Iso) staining. (B) Median fluorescence intensity of α4β7 expression on CD4 T cells from wt or β1−/− lymph nodes. Bars show mean with s.e.m. (n=5 separate mice;*p=0.0009, two-tailed paired t-test). (C) Comparison of relative abundance of α4, β7 and β2 integrin mRNA levels between β1−/− and wt CD4 T cells. Real-time RT-PCR data is presented as fold change between groups based on the comparative CT method. Bars represent mean with s.e.m. (n=3). (D) Intracellular β1 and β7 integrin staining on purified, wt CD4 T cells. The samples in the top panel were treated with pronase (to strip cell surface proteins), fixed and stained for β1 and β7 integrin as a control for the effectiveness of pronase treatment. Samples in the bottom panel were permeabilized after pronase treatment and stained again to identify intracellular stores of integrin. β1−/− and β7−/− (β7KO) CD4 T cells were used as a control for non-specific staining. (E) Representative FACS histograms of lymph node cells from wild-type and β7−/− (β7KO) mice.
In contrast to the results obtained with loss of β1 integrin expression, CD4 T cells from β7 integrin-deficient mice showed no increase in β1 integrin and did not maintain α4 integrin expression at wild-type level (Fig. 1E). These results predict that the majority of β1 integrin is cell surfaced expressed, leaving excess unpaired α4 integrin without a pairing partner for cell surface expression when β7 integrin is lost. This is in agreement with the minimal levels of intracellular β1 integrin observed in wild-type CD4 T cells (Fig. 1D). Overall, these results suggest that through competition for α4 integrin pairing, β1 integrin expression limits the amount of α4β7 that is expressed on the surface of naïve CD4 T cells.
β1−/− CD4 T cells have altered adhesion to α4 integrin ligands and trafficking to the bone marrow and Peyer’s patches
To determine the functional consequence of loss of β1 integrin, we analyzed the adhesion of control and β1−/− T cells to VCAM-1 and MAdCAM-1. Control T cells showed low basal levels of adhesion to VCAM-1 that were dramatically enhanced by T cell receptor stimulation (Fig. 2A). Adhesion to VCAM-1 was inhibited by a blocking anti-β1 integrin antibody. In contrast, β1−/− T cells did not adhere to VCAM-1 under any tested stimulation condition. β7 deficient CD4 T cells had normal adhesion to VCAM-1, further supporting that the loss of β7 integrin does not result in enhanced expression or function of α4β1 integrin (Fig. S1). The elevated expression of α4β7 on β1−/− T cells did result in enhanced adhesion to MAdCAM-1 compared to control T cells (Fig. 2A). Adhesion of both control and β1−/− T cells to MAdCAM-1 was inhibited by a β7 integrin-specific antibody. The loss of β1 integrin on CD4 T cells did not alter mRNA transcript for β2 integrin, expression of LFA-1 (αLβ2), or adhesion to ICAM-1 (Fig. 1C and S2).
Figure 2. T cells lacking β1 integrin have altered adhesion to α4 integrin ligands and trafficking to the bone marrow and Peyer’s patches.

(A) Adhesion of wild-type (wt) and β1−/−purified T cells to plate bound VCAM-1 or MAdCAM-1 following stimulation with soluble anti-CD3ε (2C11) antibody. Integrin blocking antibodies were used to demonstrate the specificity of T cell-ligand interactions. The bars represent mean values from 4 replicates in 1 representative experiment of 3–4. (B) β1wt/wtCD4-Cre+ (wt) and β1fl/flCD4-Cre+ (β1−/−) CD4 T cells were differentially labeled, equally mixed and transferred into recipient mice. Recipient organs were harvested at 2 and 24 hours post-transfer and the ratio of CD4 transferred cells recovered was normalized to the transfer ratio from the mixed sample prior to injection (Input). Values greater than 1 indicate that β1−/− CD4 T cells were present in higher numbers than wt. Bars represent mean with s.e.m. (n = 3–5 mice from 2 independent experiments) (C) Percentage of β1−/−CD4+CD44low T cells recovered from the lymphoid organs of wt:β1−/− mixed chimeric mice. All samples are normalized to the percentage of splenic β1−/− CD4+CD44low T cells, which was set to 50%. The values represent altered steady state distribution of β1−/− CD4+CD44low T cells compared to the percentage recovered in the spleen. All experimental groups were compared against input or normalized spleen, ns > 0.05, * p = 0.01–0.05 and ** p = 0.001–0.01, *** p > 0.001, 1-way ANOVA followed by Tukey’s multiple comparison test.
We next performed short-term in vivo co-homing assays to determine how the loss of β1 integrin expression alters CD4 T cell homing. Control and β1−/− CD4 T cells were differentially labeled with intravital dyes, mixed in equal numbers and transferred into recipient mice. At 2 hours, equivalent numbers of control and β1−/− transferred CD4 T cells were recovered from the spleen, inguinal lymph nodes (iLN), and mLN (Fig. 2B). In contrast, a significantly higher number of β1−/− CD4 T cells were isolated from the PP of the small intestine. This result is consistent with the elevated levels of α4β7 integrin on β1−/− T cells and the high levels of MAdCAM-1 expressed on venules in the PP. Expression of the gut-homing chemokine receptor CCR9 was not different between β1−/− and control CD4 T cell (Fig. S3). Fewer β1−/− CD4 T cells were recovered from the BM, an area rich in the β1 integrin ligand VCAM-1. Transferred CD4 T cell numbers were also examined at 24 hours in order to assess retention (14) at these sites. Differences in the localization of control and β1−/− T cells to the PP and BM that were observed at 2 hours were maintained at 24 hours (Fig. 2B).
To examine the long-term steady state distribution of naïve β1−/− CD4 T cells, we generated mixed bone marrow chimeras. The percentage of control and β1−/− CD4 T cells in various tissues was examined 8–15 weeks following marrow transplant. No gross defect in CD4 T cell development was noted with the loss of β1 integrin in these mice (Fig. S4). When compared to normalized T cell ratios from the spleen, there were similar numbers of control and β1−/− naïve CD4 T cells in the iLN (Fig. 2C). In contrast, there was an increased percentage of β1−/− naïve CD4 T cells in both the PP and mLN and a decreased percentage in the BM. These results suggest that loss of β1 integrin on CD4 T cells results in decreased localization and retention in the BM, and enhanced localization and retention in the intestinal compartment.
T cell activation enhances α4β7 integrin expression in the absence of β1 integrin
We next examined changes in α4β7 expression following in vitro stimulation of β1−/− CD4 T cells with anti-CD3 and anti-CD28 antibodies. Control and β1−/− CD4 T cells showed an equivalent number of cell divisions and percentage of CFSE dilute cells following 3 days of stimulation in vitro (Fig. 3A and S5A). Anti-CD3/CD28 stimulation of control CD4 T cells resulted in the upregulation of β1 integrin and concurrent loss of α4β7 expression (Fig. 3A). These changes in integrin expression began during blastogenesis even prior to the first cell division (non-blasting (0-NB) to blasting (0-B)) (Fig. 3B and S5B). The increase in β1 integrin expression peaked by the second cell division, which corresponds to the same point at which α4β7 expression is completely lost. In contrast, stimulation of β1−/− CD4 T cells resulted in dramatically enhanced expression of α4β7 during blastogenesis that reached a peak of expression by the second cell division. Surface expression of α4 integrin on control CD4 T cells also increased prior to the first cell division and peaked by the second cell division. Similar results were observed with β1−/− CD4 T cells, although the peak of α4 integrin expression was lower when compared to control. These results indicate that β1 integrin expression following CD4 T cell activation is required to suppress α4β7 expression.
Figure 3. β1 integrin-deficient T cells express high levels of α4β7 following stimulation in vitro.

(A) Purified naïve β1wt/wtCD4-Cre+ (wt) and β1fl/flCD4-Cre+ (β1−/−) CD4 T cells labeled with CFSE were stimulated for three days with plate bound anti-CD3/CD28 antibodies. Histograms show CFSE dilution profiles of wt (white) and β1−/− (gray) CD4 T cells overlaid on unstimulated control CD4 T cells (black). Stimulated cells were additionally stained for integrin expression. (B) Median florescence intensities (MFI) of wt and β1−/− CD4 T cells based on CFSE division peaks from one representative experiment of three. Gate 0 (undivided) is separated into non-blasting (0-NB) and blasting (0-B) CD4 T cells (Fig. S4B). Dotted lines represent isotype control staining on stimulated samples. The isotype control for α4β7 overlays the x-axis.
Elevated levels of β1 integrin results in loss of α4β7 expression and function
Following T cell activation, the induction of β1 integrin expression directly correlates with suppression of α4β7 expression. To determine if high expression of β1 integrin is sufficient to suppress α4β7 expression, we over-expressed β1 integrin in naïve CD4 T cells. We utilized recombinant adenovirus expressing a Thy1.1 expression marker and transduced resting naïve CD4 T cells isolated from transgenic mice expressing the human coxsackie adenovirus receptor (hCAR) (29, 33). Non-tranduced cells (no virus) have no Thy1.1 expression and express β1 integrin, α4 integrin and α4β7 integrin at wild-type levels (Fig. 4A). Transduction of CD4 T cell with a Thy1.1 control virus did not alter the expression of β1 integrin, α4 integrin or α4β7 integrin regardless of the level of Thy1.1 expression. Strikingly, CD4 T cells transduced with adenovirus expressing Thy1.1 and β1 integrin exhibited a dramatic loss of α4β7 integrin expression that correlated with increasing β1 integrin expression (Fig. 4A). This finding replicates the alterations in β1 integrin and α4β7 integrin expression observed following anti-CD3/CD28 stimulation of wild-type CD4 T cells (Fig. 3A). Over-expression of β1 integrin did not alter the level of the α4 integrin on the T cell surface. Unlike wild-type T cells (Fig. 1D), CD4 T cells over-expressing β1 integrin contained clearly detectable levels of intracellular β1 integrin (Fig. 4B). This indicates that not all exogenously expressed β1 integrin is able to be surface expressed. The amount of intracellular β7 integrin was not increased by over-expression of the β1 integrin subunit (Fig 4B and 1D). While β1 integrin mRNA levels were elevated ~20 fold in T cells over-expressing β1 integrin, mRNA levels for α4, β7 and β2 integrin were unaltered (Fig. 4C). These results indicate that β1 integrin subunit out-competes β7 integrin for α4 integrin pairing at the protein level, resulting in the suppression of α4β7 expression.
Figure 4. High expression of β1 integrin results in loss of α4β7 expression and function.

(A) Integrin staining on hCAR+ CD4 T cells transduced with no virus, a Thy1.1 control virus, or virus expressing Thy1.1 and β1 integrin (β1 virus). Gates define the Thy1.1 high population. (B) Intracellular β1 and β7 integrin staining on purified CD4 T cells transduced with β1 virus for two days. Cells treated with pronase alone then stained (Pronase) are compared to cells that underwent additional permeabilization and staining to identify intracellular stores of integrin (Pronase + Perm). (C) Comparison of relative abundance of β1, α4, β7 and β2 integrin mRNA levels between β1 virus and Thy1.1 control transduced CD4 T cells. Real-time RT-PCR data presented as fold change between groups based on the comparative CT method. Bars represent the mean. (D) Adhesion of Thy1.1 high expressing Thy1.1 control or β1 virus transduced CD4 T cells to plate bound VCAM-1 or MAdCAM-1 following stimulation with PMA. Bars represent mean values with s.e.m. (n=4 independent experiments;* p < 0.05, two-tailed paired t-test). (E) Co-homing of adenovirus transduced CD4 T cells labeled with Cell Tracker Orange (CTO) (Thy1.1 virus) or Cell Tracker Green (CTG) (β1 virus). Representative FACS dot plots show the percentage of Thy1.1 control and β1 virus transduced Thy1.1 high CD4+ cells recovered from each sample at two hours post-transfer. The ratio of Thy1.1 high CD4+ transferred cells recovered was normalized to the ratio of Thy1.1 high CD4 T cells transferred (Input). Values greater than 1 indicate that β1 virus transduced CD4 T cells were present in higher numbers than Thy1.1 virus control. Bars represent mean with s.e.m. (n = 4 mice in 2 independent experiments). Experimental groups were compared against input, * p = 0.01–0.05, ** p < 0.001, 1-way ANOVA followed by Tukey’s multiple comparison test.
In vitro adhesion assays demonstrated that CD4 T cells over-expressing β1 integrin exhibited enhanced activation-dependent adhesion to VCAM-1 and reduced adhesion to MAdCAM-1 when compared to control T cells (Fig. 4D). In short-term in vivo co-homing assays, over-expression of β1 integrin did not alter CD4 T cell localization to the spleen or iLN at both time points examined (Fig. 4E). However, localization of CD4 T cells over-expressing β1 integrin to the PP was reduced and localization to the BM was enhanced at 2 hours and even more dramatically at 24 hours post-transfer. A reduced number of T cells over-expressing β1 integrin were also observed in the mLN at both time points, but this difference was not statistically significant.
Abundance of α4 integrin determines expression of α4β7
Our findings predict that high β1 integrin expression in T cells suppresses α4β7 integrin expression via competition for pairing with the α4 subunit. To create a situation where the amount of the α4 integrin expressed in T cells is not limiting, we over-expressed α4 integrin in naïve CD4 T cells. Increasing α4 integrin expression resulted in increased expression of α4β7 integrin without altering β1 integrin expression (Fig. 5A). These results are consistent with our finding that there are high amounts of intracellular β7, but not β1 integrin, in naïve CD4 T cells (Fig. 1D). mRNA transcript for α4 integrin was increased ~5 fold following over-expression of α4 integrin while mRNA for β1 and β7 integrin was not affected (Fig. 5C). Over-expression of both β1 and α4 integrin resulted in suppression of α4β7 similar to that seen with over-expression of just the β1 integrin subunit (Fig. 5B). Overall, these findings indicate that an increase in α4 integrin subunit expression can result in increased α4β7 expression, but a relative abundance of β1 integrin to α4 integrin can suppress this effect.
Figure 5. Abundance of α4 integrin controls α4β7 integrin expression.

(A) Representative FACS histograms showing α4, α4β7, and β1 integrin staining on Thy1.1 control and α4 virus transduced CD4 T cells. Light gray histograms represent appropriate isotype (Iso) control staining. (B) Representative FACS histograms showing α4, α4β7, and β1 integrin staining on Thy1.1 control, β1 virus and β1 + α4 virus co-transduced CD4 T cells. Light gray histograms represent appropriate isotype (Iso) control staining. (C) Comparison of relative β1, α4 and β7 integrin levels between α4 virus and Thy1.1 control transduced CD4 T cells. Real-time RT-PCR data presented as fold change between groups based on the comparative CT method. Bars represent the mean with s.e.m. (n=3)
Retinoic acid enhances α4β7 expression by increasing α4 integrin abundance
The presence of RA during T cell activation promotes increased expression of α4β7 integrin (21). To determine if RA-induced α4β7 expression is mediated by suppression of β1 integrin or enhancement of α4 integrin, we stimulated naïve CD4 T cells with anti-CD3/CD28 antibodies for two days in the presence of RA. RA treatment resulted in enhanced α4 integrin expression compared to CD4 T cells stimulated without RA (Fig. 6A). The increased α4 integrin expression with RA treatment was accompanied by a ~4 fold increase in α4 integrin mRNA levels, while mRNA levels for β1 and β7 integrin remained unchanged (Fig. 6B). CD3/CD28 stimulation resulted in increased β1 integrin expression that was little affected by the addition of RA (Fig. 6C). In contrast, ~20% of the RA-treated CD4 T cells at 48 hours after stimulation expressed high levels of α4β7 (Fig. 6C). Thus, RA-induced α4β7 integrin expression is likely mediated by upregulation of α4 integrin.
Figure 6. Retinoic acid enhances α4β7 expression by increasing α4 integrin abundance.

(A) Representative histogram of α4 integrin staining on naïve CD4 T cells or CD4 T cells stimulated (anti-CD3/CD28) with or without 1000 nM retinoic acid (RA) for two days. (B) Comparison of relative abundance of β1, α4, and β7 integrin mRNA levels between purified CD4 T cells stimulated with or without RA for two days. Real-time RT-PCR data presented as fold change between groups based on the comparative CT method. Bars represent the mean with s.e.m. (n=3) (C) Representative dot plots showing β1 integrin vs. α4β7 integrin expression on naïve CD4 T cells or CD4 T cells stimulated without or with RA for two days. The percentage of cells in the α4β7-high, β1 integrin high gate is displayed in the plots. (D) Representative dot plots showing β1 integrin vs. α4β7 integrin on Thy1.1 control and β1 virus transduced CD4 T cells stimulated without or with RA for two days. The percentage of cells in the α4β7 high, β1 integrin high gate is displayed in the plots.
To directly test the ability of β1 integrin to suppress α4β7 integrin upregulation following RA treatment, we stimulated CD4 T cells over-expressing β1 integrin. CD4 T cells transduced with control adenovirus demonstrated similar upregulation of α4β7 as wild-type cells following stimulation for two days (Fig. 6D). In contrast, activated T cells transduced with β1 integrin adenovirus demonstrated no induction of α4β7 expression in the presence of RA. This mirrors our findings with co-expression of α4 and β1 integrin in naïve CD4 T cells (Fig. 5B) and demonstrates that high abundance of β1 integrin can suppress RA-induced enhancement in α4β7. These results highlight the importance of α4 and β1 integrin stoichiometry in the control of α4β7 expression.
Antigen-specific activation of polyclonal endogenous β1−/− CD4 T cells results in enhanced α4β7
To determine if β1 integrin expression is critical for regulating α4β7 expression following antigen challenge in vivo, we intravenously infected control and β1−/− mice with an ActA-deficient strain of Listeria monocytogenes expressing the 2W1S variant of peptide 52–68 from the I-E α chain (A−Lm-2W1S) (35, 39). At various time points after challenge, the number of 2W1S-specific CD4 T cells was determined using recently described peptide:I-Ab MHC class II tetramer-based enrichment and flow cytometry gating approaches (Fig. S6) (36, 37). Endogenous populations of naïve 2W1S-specific CD4 T cells from the spleens of uninfected control and β1−/− mice were equivalent in number (n=7, wt:238 ± 29; β1−/−: 234 ± 39 (mean ± s.e.m.)) (Fig. 7A). Infection of control and β1−/− mice with A−Lm-2W1S resulted in a comparable expansion, contraction, and long-term maintenance of 2W1S-specific CD4 T cells in the spleen out to 120 days (Fig. 7A). However, the expression of α4 integrins on these activated T cells was dramatically different. At the peak of the response (day 5), a surprisingly high percentage of 2W1S-specific control CD4 T cells (50 ± 3%, n=4) in the spleen expressed high levels of β7 integrin (Fig. 7B). By day 18, the majority of 2W1S-specific CD4 T cells remaining in the spleen had low β7 integrin compared to naïve CD4 T cells but a population of α4β7-high cells (8 ± 2%, n=5) was maintained. These control 2W1S-specific CD4 T cells demonstrated a reciprocal relationship between β1 integrin and α4β7 integrin expression (Fig. 7C). This population of α4β7-high cells resembles a circulating population of “gut homing” memory CD4 T cells previously identified in humans that is β1 integrin low and α4β7-high (4, 11). This β7-high T cell population was maintained long-term and represented ~15% of the total splenic population by 60 days post-infection. In contrast, 2W1S-specific CD4 T cells from the spleens of β1−/− mice became uniformly β7-high (98 ± 0.2% n=4) rapidly following infection and maintained high level expression of β7 integrin out to day 120 (Fig. 7B and 7C). Thus, the vast majority of 2W1S-specific β1−/− CD4 T cells in the spleen resemble the small population of α4β7-high CD4 T cells observed in control mice.
Figure 7. Polyclonal endogenous β1−/− CD4 T cells in the spleen have enhanced α4β7 expression following intravenous infection.
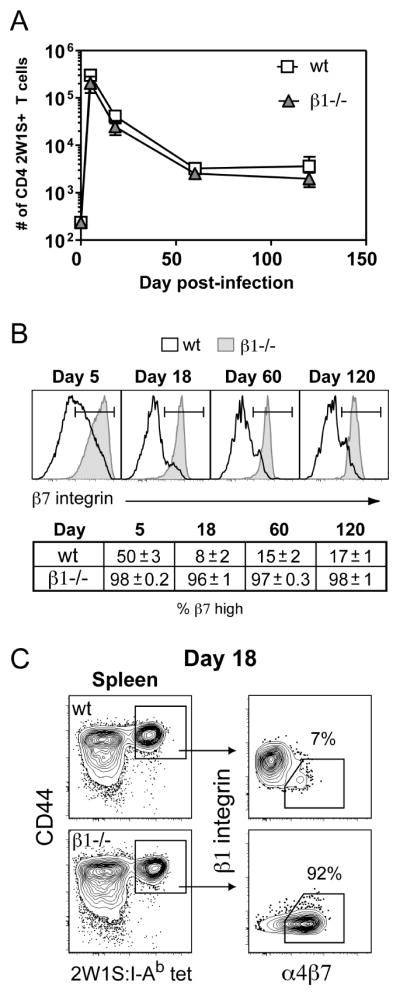
(A) pMHC-II tetramer enrichment was used to quantify the number of endogenous 2W1S-specific CD4 T cells in control β1wt/wtCD4-Cre+ (wt) and β1fl/flCD4-Cre+ (β1−/−) mouse spleens following i.v. infection with A−Lm-2W1S. Time 0 represents the number of 2W1S-specific recovered from naïve wild-type or β1−/− mice. Symbols represent mean with s.e.m. (n = 4–11 mice/time point except wt day 120, n = 2). (B) Representative histograms of β7 integrin expression on splenic 2W1S-specific CD4 T cells from wt and β1−/− mice. The table indicates mean percentage (+/− s.e.m.) of β7-high splenic 2W1S-specific CD4 T cells (n=2–5 mice). (C) Representative 2W1S:I-Ab tetramer staining of splenic CD4+ T cells from wt and β1−/− mice 18 days post-infection. β1 integrin vs. α4β7 integrin expression is shown on the gated CD44high 2W1S:I-Ab tetramer+ cells.
Altered maintenance of β1−/− early memory CD4 T cells in the bone marrow and Peyer’s patches
To determine if loss of β1 integrin and the resulting aberrant upregulation of α4β7 results in altered early memory CD4 T cell localization, we assessed the number of 2W1S-specific T cells in the BM and PP of control and β1−/− mice 18 days following A−Lm-2W1S infection. This is a time point where we observed similar numbers of 2W1S-specific CD4 T cells in the spleen (Fig. 7A). Yet, in the BM there was a reduced number of 2W1S-specific CD4 T cells in infected β1−/− mice compared to control mice (Fig. 8A and 8B). In contrast, there were increased numbers of 2W1S-specific CD4 T cells in the PP of infected β1−/− mice compared to control mice. All of the 2W1S-specific CD4 T cells in the BM and PP expressed high levels of CD44, a marker of antigen experience. As a measure of the steady state maintenance of antigen-specific CD4 T cells in the BM and PP, we also analyzed the percentage of 2W1S-specific CD4 T cells in these tissues relative to the number of 2W1S-specific CD4 T cells in the spleen. This analysis revealed that relative to the spleen, ~8% of the 2W1S-specific CD4 T cells were found in the BM and only ~0.1% were found in the PP after infection of control mice (Fig. 8C). In contrast, after infection of β1−/− mice, only ~2% of 2W1S-specific CD4 T cells were found in the BM relative to the spleen, while there was a 15-fold enhancement in antigen-specific CD4 T cells in the PP (~1.5%). Thus, the high level of α4β7 aberrantly expressed by β1−/− CD4 T cells following activation is associated with decreased steady state numbers of early memory CD4 T cells in the BM and increased numbers in intestinal sites.
Figure 8. β1 integrin-deficient early memory CD4 T cells have enhanced localization to the Peyer’s patches and reduced maintenance in the bone marrow.
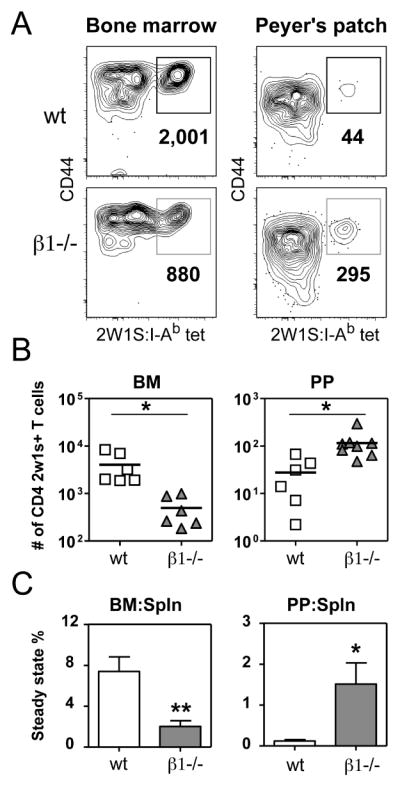
(A) Representative 2W1S:I-Ab tetramer staining of CD4+ T cells isolated from BM and PP 18 days following i.v. infection with A−Lm-2W1S. The bold numbers below the gate are the total calculated 2W1S-specific CD4 T cells recovered from each sample. (B) Individual replicates of 2W1S-specific CD4 T cell numbers recovered from the BM and PP 18 days post-infection. Line represents mean value (* p < 0.02, two-tailed unpaired t-test). (C) The steady state percentage represents the number of 2W1S-specific CD4 T cells recovered in the BM or PP compared to the spleen of the same mouse. Bars represent mean with s.e.m. (n = 3–7 mice, * p < 0.04, ** p < 0.006, two-tailed unpaired t-test).
DISCUSSION
T cells express two distinct integrin heterodimers that contain the α4 integrin subunit,α4β7 and α4β1. It is critical to define the mechanisms that control the expression of α4β7 and α4β1 on T cells, as these integrins promote homing to the gut (α4β7) and to extra-intestinal sites, such as the BM and brain (α4β1) (3, 17). In this study, we demonstrate that changes in the expression of β1 integrin reciprocally alter α4β7 expression on CD4 T cells. We show that this regulation occurs at the protein level, where the α4 integrin subunit preferentially pairs with the β1 integrin subunit when both β1 and β7 integrin are present. We identify the abundance of α4 integrin as the major driver of α4β7 expression on CD4 T cells and demonstrate its importance in RA-induced α4β7 upregulation. Finally, by tracking an endogenous antigen-specific population of CD4 T cells following infection, we demonstrate that the absence of β1 integrin results in enhanced α4β7 expression and altered localization of early memory CD4 T cells.
Naïve CD4 T cells express low levels of both the α4β1 and α4β7 integrins. When we crossed mice with “floxed” alleles of the β1 integrin gene with CD4-Cre transgenic mice, the loss of β1 integrin on naïve CD4 T cells was associated with increased expression of α4β7. These results are similar to recent findings from an independently derived line of conditional β1-deficient mice (10). We show that this change in α4β7 expression has functional significance, as β1−/− T cells exhibit enhanced adhesion to MAdCAM-1 in vitro and increased localization to PP in vivo. Since successful cell surface integrin expression requires intracellular α/β heterodimer formation, we suggest that the availability of the α4 integrin subunit for pairing regulates α4β7 integrin expression on T cells. Several lines of evidence suggest that the α4 integrin preferentially pairs with β1 integrin. First, we do not observe increased β1 integrin expression or function on β7-deficient CD4 T cells. Instead, loss of β7 integrin expression results in decreased cell surface expression of α4 integrin. This suggests that all available β1 integrin associates with α4 integrin, even when β7 integrin is present. Staining of permeabilized cells further supports this hypothesis, as there are abundant levels of intracellular β7 integrin, but not β1 integrin, in naïve CD4 T cells. The inability of β7 integrin over-expression to reduce β1 integrin expression in another system is also consistent with this model (4). Second, over-expression of β1 integrin on naïve CD4 T cells results in a dose-dependent decrease in α4β7 integrin expression without altering α4 integrin expression. Thus, increased levels of β1 integrin can effectively out-compete β7 integrin for association with the limiting amount of the α4 subunit expressed in CD4 T cells. Thus, there is a hierarchy of β subunit pairing to the α4 integrin, with a “dominant” β1 integrin subunit that modulates the expression of the other heterodimer, α4β7.
The functional relevance of this integrin subunit pairing hierarchy is revealed by our analysis of β1 and α4β7 integrin expression following CD4 T cell activation. Activation of control T cells with anti-CD3/CD28 antibodies for 3 days resulted in increased β1 integrin expression and loss of α4β7 integrin expression even before the first cell division. These results are consistent with our over-expression data demonstrating β1 integrin as the dominant α4 integrin pairing partner. In contrast, β1−/− T cells exhibit dramatically elevated levels of α4β7 expression. Expression of α4 integrin on T cells is also increased following activation, although the level of surface α4 integrin was slightly lower on β1−/− T cells. This is likely due to the overall lower levels of β subunits available for pairing with α4 integrin in β1−/− T cells. These findings suggest that the preferential pairing of β1 integrin with α4 integrin is critical for the suppression of α4β7 expression following T cell activation.
Our work supports a model where β1 integrin expression modulates α4β7 expression by controlling the abundance of α4 integrin available to pair with β7 integrin. In a naïve T cell, all available β1 integrin pairs with α4 integrin and is expressed on the cell surface as α4β1. Any remaining free α4 integrin is then available for pairing with β7 integrin, resulting in a low level of α4β7 integrin expression on the cell surface. The identification of an intracellular pool of β7 integrin in naïve CD4 T cells suggests that β7 integrin is expressed in excess of the available α4 integrin. We also demonstrate that α4β7 cell surface expression is enhanced when the α4 integrin subunit is over-expressed in naïve T cells, even though mRNA levels for β7 integrin are not altered. This suggests that intracellular β7 integrin serves as a reservoir of β7 integrin available for pairing with free α4 integrin. Our model is consistent with microarray data that shows human, β7-high memory CD4 T cells have an increase in mRNA transcript for α4 integrin but not β7 integrin (40). The relative abundance of β1 integrin to α4 integrin is critical, as over-expression of both α4 and β1 integrin results in suppression, rather than induction, of α4β7 expression. In this situation, the excess β1 integrin subunits likely associate with the free α4 integrin subunits, thereby suppressing α4β7 heterodimer formation. Overall, our model predicts that the precise ratio of β1 to α4 subunit is critical for controlling the expression of α4β7. A ratio favoring β1 integrin results in suppression of α4β7, while a ratio favoring α4 integrin results in increased α4β7 expression.
Previous work has shown that RA produced by intestinal DCs induces α4β7 expression on T cells (21, 22), but the exact cellular mechanism for how this occurs is unknown. CD8 T cells activated by intestinal DCs are reported to have increased mRNA transcript for α4 integrin but not β1 or β7 integrin (41). We find that RA-treated, activated CD4 T cells have a similar pattern of enhanced α4 integrin protein and mRNA without alterations in β1 or β7 integrin mRNA. Thus, RA-induced α4β7 expression is driven by increased abundance of α4 integrin. As a result, the β1 to α4 subunit ratio favors the α4 integrin. Under these conditions, α4 integrin is no longer a limiting pairing partner. Thus, β7 integrin can pair with excess α4 integrin not bound to β1, resulting in increased α4β7 cell surface expression. Our finding that over-expression of α4 integrin mimics the effects of RA treatment on α4β7 expression supports this model. The precise balance between the β1 and α4 subunits remains critical, as the over-expression of β1 integrin in RA-treated CD4 T cells suppresses the induction of α4β7. Here, the addition of excess β1 integrin elevates the β1 to α4 subunit ratio, resulting in suppression of α4β7 expression. These results highlight the importance of the stoichiometry of the α4, β1 and β7 integrin subunits in determining the relative levels of α4β1 and α4β7 that are expressed on the surface of a T cell. This mechanism of regulation of integrin expression may also be applicable to other T cell subsets that express integrin subunits that share a common integrin subunit binding partner (42–45).
To examine changes in integrin expression following T cell activation in vivo, we utilized peptide:MHCII tetramer-based enrichment approaches to monitor changes in integrin expression on a polyclonal population of antigen-specific CD4 T cells following Listeria monocytogenes infection (36). This approach avoids possible alterations in activation kinetics, homing molecule expression, and memory generation and maintenance that have been reported when using high cell number adoptive transfer (46–49). In the spleen, we unexpectedly detected high levels of α4β7 on ~50% of activated control CD4 T cells at the peak of the response (day 5). Although splenic DCs have been reported to induce α4β7 on CD8 T cells in vitro, this has not been reported for CD4 T cells in vivo (50). A transient increase in the availability of the α4 subunit following T cell activation in the spleen may explain the high percentage of β1 integrin expressing α4β7-high CD4 T cells recovered 5 days following infection. By day 18, the majority of activated control CD4 T cells expressed high levels of β1 integrin and low levels of α4β7, while a smaller subpopulation had a β1-low α4β7-high “gut-homing” phenotype (~8%). Our results suggests that CD4 T cells with this “gut-homing” phenotype have a mechanism to suppress β1 integrin abundance at the protein and/or mRNA level. In contrast to the results obtained with control CD4 T cells, activation of antigen-specific β1−/− CD4 T cells resulted in uniformly elevated expression of α4β7 at all time points examined. This is consistent with our model that β1 integrin expression is critical for suppressing α4β7 expression and modulating cell surface α4β7 following CD4 T cell activation.
Control and β1−/− T cells exhibited comparable kinetics of CD4 T cell expansion, contraction, and maintenance in the spleen following Listeria monocytogenes infection. Although the number of β1−/− 2W1S-specific CD4 T cells was lower at all time points examined than controls, this difference was not statistically significant. Overall, this indicates that β1 integrin expression is not essential for the expansion or maintenance of a polyclonal population of CD4 T cells in the spleen following antigen challenge. However, there were clear differences in the localization of activated CD4 T cells, with lower numbers of β1−/− T cells in the BM and higher numbers in the PP. As a source of IL-7 and IL-15, the BM appears to function as a reservoir for the long-term maintenance of CD8 T cells (14, 51, 52). IL-7 and IL-15 are also important for memory CD4 T cell survival (53, 54) and recent work suggests that CD4 memory T cells reside in the BM and associate with stromal cells that produce IL-7 (55). Although less memory β1−/− CD4 T cells are maintained in the BM, we do not detect a significant loss of peptide-specific CD4 T cells in the spleen out to day 120 post-infection. It is possible that enhanced α4β7 expression on β1−/− T cells promotes aberrant entry into other sites where similar survival signals could be relayed.
In summary, we have identified a novel mechanism of integrin regulation based on pairing hierarchy, where β1 integrin dominates β7 integrin pairing with their common α4 subunit. This mechanism of regulation is critical for controlling the level of α4β7 integrin on naïve CD4 T cells, the changes in α4β7 expression that occur during the course of T cell activation, and the subsequent localization of early memory CD4 T cells. Our findings present a means for the intentional modulation of α4β7 integrin expression on CD4 T cells. The targeted modulation of α4β7 integrin is of clinical interest with its known involvement in the progression of IBD(19) and, more recently, as a co-receptor for HIV (56).
Supplementary Material
Acknowledgments
We thank Dr. M. Jenkins for critical discussion and input, Dr. S.S. Way for the ActA-deficient Listeria monocytogenes-2W1S, M. Weinreich for assistance with mixed bone marrow chimeras, G. Hart for assistance with primer design and real-time RT-PCR, and T. Lee, M. Schwartz, D. Loughran, N. Rahman for mouse genotyping and colony maintenance.
Footnotes
Publisher's Disclaimer: This is an author-produced version of a manuscript accepted for publication in The Journal of Immunology (The JI). The American Association of Immunologists, Inc. (AAI), published of The JI, holds the copyright to this manuscript. This manuscript has not yet been copyedited or subjected to editorial proofreading by The JI; hence it may differ from the final version published in The JI (online and in print). AAI (The JI) is not liable for errors or omissions in this author-produced version of the manuscript or in any version derived from it by the United States National Institutes of Health or any other third party. The final, citable version of record can be found at www.jimmunol.org.
Abbreviations. BM: bone marrow; DC: dendritic cell; hCAR: human coxsackie adenovirus receptor; IBD: inflammatory bowel disease; iLN: inguinal lymph node; mLN: mesenteric lymph node; PP: Peyer’s patches; RA: retinoic acid
This work is supported by NIH grants AI031126 (Y.S.), F30 DK082139 (C.C.D.), T32 AI007313 (A.J.P.), and T32 CA009138 (J.S.M.). Y.S. is supported in part by the Harry Kay Chair in Biomedical Research at the University of Minnesota.
References
- 1.Hynes RO. Integrins: bidirectional, allosteric signaling machines. Cell. 2002;110:673–687. doi: 10.1016/s0092-8674(02)00971-6. [DOI] [PubMed] [Google Scholar]
- 2.von Andrian UH, Mackay CR. T-cell function and migration. Two sides of the same coin. N Engl J Med. 2000;343:1020–1034. doi: 10.1056/NEJM200010053431407. [DOI] [PubMed] [Google Scholar]
- 3.DeNucci CC, Mitchell JS, Shimizu Y. Integrin function in T cell homing and non-lymphoid sites: getting there and staying there. Crit Rev Immunol. 2009;29:87–109. doi: 10.1615/critrevimmunol.v29.i2.10. [DOI] [PMC free article] [PubMed] [Google Scholar]
- 4.Schweighoffer T, Tanaka Y, Tidswell M, Erle DJ, Horgan KJ, Luce GE, Lazarovits AI, Buck D, Shaw S. Selective expression of integrin α4β7 on a subset of human CD4+ memory T cells with hallmarks of gut-trophism. J Immunol. 1993;151:717–729. [PubMed] [Google Scholar]
- 5.Masopust D, Vezys V, Wherry EJ, Barber DL, Ahmed R. Cutting edge: gut microenvironment promotes differentiation of a unique memory CD8 T cell population. J Immunol. 2006;176:2079–2083. doi: 10.4049/jimmunol.176.4.2079. [DOI] [PubMed] [Google Scholar]
- 6.Lehmann J, Huehn J, de la RM, Maszyna F, Kretschmer U, Krenn V, Brunner M, Scheffold A, Hamann A. Expression of the integrin αEβ7 identifies unique subsets of CD25+ as well as CD25− regulatory T cells. Proc Natl Acad Sci USA. 2002;99:13031–13036. doi: 10.1073/pnas.192162899. [DOI] [PMC free article] [PubMed] [Google Scholar]
- 7.Evans R, Patzak I, Svensson L, De FK, Jones K, McDowall A, Hogg N. Integrins in immunity. J Cell Sci. 2009;122:215–225. doi: 10.1242/jcs.019117. [DOI] [PubMed] [Google Scholar]
- 8.Mittelbrunn M, Molina A, Escribese MM, Yanez-Mo M, Escudero E, Ursa A, Tejedor R, Mampaso F, Sanchez-Madrid F. VLA-4 integrin concentrates at the peripheral supramolecular activation complex of the immune synapse and drives T helper 1 responses. Proc Natl Acad Sci USA. 2004;101:11058–11063. doi: 10.1073/pnas.0307927101. [DOI] [PMC free article] [PubMed] [Google Scholar]
- 9.Nguyen K, Sylvain NR, Bunnell SC. T cell costimulation via the integrin VLA-4 inhibits the actin-dependent centralization of signaling microclusters containing the adaptor SLP-76. Immunity. 2008;28:810–821. doi: 10.1016/j.immuni.2008.04.019. [DOI] [PubMed] [Google Scholar]
- 10.Bauer M, Brakebusch C, Coisne C, Sixt M, Wekerle H, Engelhardt B, Fassler R. β1 integrins differentially control extravasation of inflammatory cell subsets into the CNS during autoimmunity. Proc Natl Acad Sci USA. 2009;106:1920–1925. doi: 10.1073/pnas.0808909106. [DOI] [PMC free article] [PubMed] [Google Scholar]
- 11.Erle DJ, Briskin MJ, Butcher EC, Garcia-Pardo A, Lazarovits AI, Tidswell M. Expression and function of the MAdCAM-1 receptor, integrin α4β7, on human leukocytes. J Immunol. 1994;153:517–528. [PubMed] [Google Scholar]
- 12.Rott LS, Briskin MJ, Andrew DP, Berg EL, Butcher EC. A fundamental subdivision of circulating lymphocytes defined by adhesion to mucosal addressin cell adhesion molecule-1. Comparison with vascular cell adhesion molecule-1 and correlation with β7 integrins and memory differentiation. J Immunol. 1996;156:3727–3736. [PubMed] [Google Scholar]
- 13.Koni PA, Joshi SK, Temann UA, Olson D, Burkly L, Flavell RA. Conditional vascular cell adhesion molecule 1 deletion in mice: impaired lymphocyte migration to bone marrow. J Exp Med. 2001;193:741–754. doi: 10.1084/jem.193.6.741. [DOI] [PMC free article] [PubMed] [Google Scholar]
- 14.Mazo IB, Honczarenko M, Leung H, Cavanagh LL, Bonasio R, Weninger W, Engelke K, Xia L, McEver RP, Koni PA, Silberstein LE, von Andrian UH. Bone marrow is a major reservoir and site of recruitment for central memory CD8+ T cells. Immunity. 2005;22:259–270. doi: 10.1016/j.immuni.2005.01.008. [DOI] [PubMed] [Google Scholar]
- 15.Berlin C, Berg EL, Briskin MJ, Andrew DP, Kilshaw PJ, Holzmann B, Weissman IL, Hamann A, Butcher EC. α4β7 integrin mediates lymphocyte binding to the mucosal vascular addressin MAdCAM-1. Cell. 1993;74:185–195. doi: 10.1016/0092-8674(93)90305-a. [DOI] [PubMed] [Google Scholar]
- 16.Briskin M, Winsor-Hines D, Shyjan A, Cochran N, Bloom S, Wilson J, McEvoy LM, Butcher EC, Kassam N, Mackay CR, Newman W, Ringler DJ. Human mucosal addressin cell adhesion molecule-1 is preferentially expressed in intestinal tract and associated lymphoid tissue. Am J Pathol. 1997;151:97–110. [PMC free article] [PubMed] [Google Scholar]
- 17.Agace WW. Tissue-tropic effector T cells: generation and targeting opportunities. Nat Rev Immunol. 2006;6:682–692. doi: 10.1038/nri1869. [DOI] [PubMed] [Google Scholar]
- 18.Steinman L. Blocking adhesion molecules as therapy for multiple sclerosis: natalizumab. Nat Rev Drug Discov. 2005;4:510–518. doi: 10.1038/nrd1752. [DOI] [PubMed] [Google Scholar]
- 19.Feagan BG, Greenberg GR, Wild G, Fedorak RN, Pare P, McDonald JW, Dube R, Cohen A, Steinhart AH, Landau S, Aguzzi RA, Fox IH, Vandervoort MK. Treatment of ulcerative colitis with a humanized antibody to the α4β7 integrin. N Engl J Med. 2005;352:2499–2507. doi: 10.1056/NEJMoa042982. [DOI] [PubMed] [Google Scholar]
- 20.Johansson-Lindbom B, Agace WW. Generation of gut-homing T cells and their localization to the small intestinal mucosa. Immunol Rev. 2007;215:226–242. doi: 10.1111/j.1600-065X.2006.00482.x. [DOI] [PubMed] [Google Scholar]
- 21.Iwata M, Hirakiyama A, Eshima Y, Kagechika H, Kato C, Song SY. Retinoic acid imprints gut-homing specificity on T cells. Immunity. 2004;21:527–538. doi: 10.1016/j.immuni.2004.08.011. [DOI] [PubMed] [Google Scholar]
- 22.Johansson-Lindbom B, Svensson M, Pabst O, Palmqvist C, Marquez G, Forster R, Agace WW. Functional specialization of gut CD103+ dendritic cells in the regulation of tissue-selective T cell homing. J Exp Med. 2005;202:1063–1073. doi: 10.1084/jem.20051100. [DOI] [PMC free article] [PubMed] [Google Scholar]
- 23.Hammerschmidt SI, Ahrendt M, Bode U, Wahl B, Kremmer E, Forster R, Pabst O. Stromal mesenteric lymph node cells are essential for the generation of gut-homing T cells in vivo. J Exp Med. 2008;205:2483–2490. doi: 10.1084/jem.20080039. [DOI] [PMC free article] [PubMed] [Google Scholar]
- 24.Sigmundsdottir H, Pan J, Debes GF, Alt C, Habtezion A, Soler D, Butcher EC. DCs metabolize sunlight-induced vitamin D3 to ‘program’ T cell attraction to the epidermal chemokine CCL27. Nat Immunol. 2007;8:285–293. doi: 10.1038/ni1433. [DOI] [PubMed] [Google Scholar]
- 25.Mora JR, Iwata M, von Andrian UH. Vitamin effects on the immune system: vitamins A and D take centre stage. Nat Rev Immunol. 2008;8:6865–698. doi: 10.1038/nri2378. [DOI] [PMC free article] [PubMed] [Google Scholar]
- 26.Raghavan S, Bauer C, Mundschau G, Li Q, Fuchs E. Conditional ablation of β1 integrin in skin. Severe defects in epidermal proliferation, basement membrane formation, and hair follicle invagination. J Cell Biol. 2000;150:1149–1160. doi: 10.1083/jcb.150.5.1149. [DOI] [PMC free article] [PubMed] [Google Scholar]
- 27.Lee PP, Fitzpatrick DR, Beard C, Jessup HK, Lehar S, Makar KW, Perez-Melgosa M, Sweetser MT, Schlissel MS, Nguyen S, Cherry SR, Tsai JH, Tucker SM, Weaver WM, Kelso A, Jaenisch R, Wilson CB. A critical role for Dnmt1 and DNA methylation in T cell development, function, and survival. Immunity. 2001;15:763–774. doi: 10.1016/s1074-7613(01)00227-8. [DOI] [PubMed] [Google Scholar]
- 28.Wagner N, Lohler J, Kunkel EJ, Ley K, Leung E, Krissansen G, Rajewsky K, Muller W. Critical role for β7 integrins in formation of the gut-associated lymphoid tissue. Nature. 1996;382:366–370. doi: 10.1038/382366a0. [DOI] [PubMed] [Google Scholar]
- 29.Hurez V, Dzialo-Hatton R, Oliver J, Matthews RJ, Weaver CT. Efficient adenovirus-mediated gene transfer into primary T cells and thymocytes in a new coxsackie/adenovirus receptor transgenic model. BMC Immunol. 2002;3:4. doi: 10.1186/1471-2172-3-4. [DOI] [PMC free article] [PubMed] [Google Scholar]
- 30.Romzek NC, Harris ES, Dell CL, Skronek J, Hasse E, Reynolds PJ, Hunt SW, III, Shimizu Y. Use of a β1 integrin-deficient human T cell to identify β1 integrin cytoplasmic domain sequences critical for integrin function. Mol Biol Cell. 1998;9:2715–2727. [PMC free article] [PubMed] [Google Scholar]
- 31.Weninger W, Crowley MA, Manjunath N, von Andrian UH. Migratory properties of naïve, effector, and memory CD8+ T cells. J Exp Med. 2001;194:953–966. doi: 10.1084/jem.194.7.953. [DOI] [PMC free article] [PubMed] [Google Scholar]
- 32.Burbach BJ, Srivastava R, Medeiros RB, O’Gorman WE, Peterson EJ, Shimizu Y. Distinct regulation of integrin-dependent T cell conjugate formation and NF-κB activation by the adapter protein ADAP. J Immunol. 2008;181:4840–4851. doi: 10.4049/jimmunol.181.7.4840. [DOI] [PMC free article] [PubMed] [Google Scholar]
- 33.Medeiros RB, Burbach BJ, Mueller KL, Srivastava R, Moon JJ, Highfill S, Peterson EJ, Shimizu Y. Regulation of NF-κB activation in T cells via association of the adapter proteins ADAP and CARMA1. Science. 2007;316:754–758. doi: 10.1126/science.1137895. [DOI] [PubMed] [Google Scholar]
- 34.Schmittgen TD, Livak KJ. Analyzing real-time PCR data by the comparative C(T) method. Nat Protoc. 2008;3:1101–1108. doi: 10.1038/nprot.2008.73. [DOI] [PubMed] [Google Scholar]
- 35.Ertelt JM, Rowe JH, Johanns TM, Lai JC, McLachlan JB, Way SS. Selective priming and expansion of antigen-specific Foxp3- CD4+ T cells during Listeria monocytogenes infection. J Immunol. 2009;182:3032–3038. doi: 10.4049/jimmunol.0803402. [DOI] [PMC free article] [PubMed] [Google Scholar]
- 36.Moon JJ, Chu HH, Pepper M, McSorley SJ, Jameson SC, Kedl RM, Jenkins MK. Naïve CD4+ T cell frequency varies for different epitopes and predicts repertoire diversity and response magnitude. Immunity. 2007;27:203–213. doi: 10.1016/j.immuni.2007.07.007. [DOI] [PMC free article] [PubMed] [Google Scholar]
- 37.Moon JJ, Chu HH, Hataye J, Pagan AJ, Pepper M, McLachlan JB, Zell T, Jenkins MK. Tracking epitope-specific T cells. Nat Protoc. 2009;4:565–581. doi: 10.1038/nprot.2009.9. [DOI] [PMC free article] [PubMed] [Google Scholar]
- 38.Boggs DR. The total marrow mass of the mouse: a simplified method of measurement. Am J Hematol. 1984;16:277–286. doi: 10.1002/ajh.2830160309. [DOI] [PubMed] [Google Scholar]
- 39.Pepper M, Linehan JL, Pagan AJ, Zell T, Dileepan T, Cleary PP, Jenkins MK. Different routes of bacterial infection induce long-lived TH1 memory cells and short-lived TH17 cells. Nat Immunol. 2010;11:83–89. doi: 10.1038/ni.1826. [DOI] [PMC free article] [PubMed] [Google Scholar]
- 40.Rodriguez MW, Paquet AC, Yang YH, Erle DJ. Differential gene expression by integrin beta 7+ and beta 7− memory T helper cells. BMC Immunol. 2004;5:13-. doi: 10.1186/1471-2172-5-13. [DOI] [PMC free article] [PubMed] [Google Scholar]
- 41.Mora JR, Cheng G, Picarella D, Briskin M, Buchanan N, von Andrian UH. Reciprocal and dynamic control of CD8 T cell homing by dendritic cells from skin-and gut-associated lymphoid tissues. J Exp Med. 2005;201:303–316. doi: 10.1084/jem.20041645. [DOI] [PMC free article] [PubMed] [Google Scholar]
- 42.Kilshaw PJ, Murant SJ. Expression and regulation of β7(βp) integrins on mouse lymphocytes: relevance to the mucosal immune system. Eur J Immunol. 1991;21:2591–2597. doi: 10.1002/eji.1830211041. [DOI] [PubMed] [Google Scholar]
- 43.Suzuki R, Nakao A, Kanamaru Y, Okumura K, Ogawa H, Ra C. Localization of intestinal intraepithelial T lymphocytes involves regulation of αEβ7 expression by transforming growth factor-β. Int Immunol. 2002;14:339–345. doi: 10.1093/intimm/14.4.339. [DOI] [PubMed] [Google Scholar]
- 44.El-Asady R, Yuan R, Liu K, Wang D, Gress RE, Lucas PJ, Drachenberg CB, Hadley GA. TGF-β-dependent CD103 expression by CD8+ T cells promotes selective destruction of the host intestinal epithelium during graft-versus-host disease. J Exp Med. 2005;201:1647–1657. doi: 10.1084/jem.20041044. [DOI] [PMC free article] [PubMed] [Google Scholar]
- 45.Conrad C, Boyman O, Tonel G, Tun-Kyi A, Laggner U, de FA, Kotelianski V, Gardner H, Nestle FO. α1β1 integrin is crucial for accumulation of epidermal T cells and the development of psoriasis. Nat Med. 2007;13:836–842. doi: 10.1038/nm1605. [DOI] [PubMed] [Google Scholar]
- 46.Marzo AL, Klonowski KD, Le BA, Borrow P, Tough DF, Lefrancois L. Initial T cell frequency dictates memory CD8+ T cell lineage commitment. Nat Immunol. 2005;6:793–799. doi: 10.1038/ni1227. [DOI] [PMC free article] [PubMed] [Google Scholar]
- 47.Hataye J, Moon JJ, Khoruts A, Reilly C, Jenkins MK. Naïve and memory CD4+ T cell survival controlled by clonal abundance. Science. 2006;312:114–116. doi: 10.1126/science.1124228. [DOI] [PubMed] [Google Scholar]
- 48.Blair DA, Lefrancois L. Increased competition for antigen during priming negatively impacts the generation of memory CD4 T cells. Proc Natl Acad Sci USA. 2007;104:15045–15050. doi: 10.1073/pnas.0703767104. [DOI] [PMC free article] [PubMed] [Google Scholar]
- 49.Badovinac VP, Haring JS, Harty JT. Initial T cell receptor transgenic cell precursor frequency dictates critical aspects of the CD8+ T cell response to infection. Immunity. 2007;26:827–841. doi: 10.1016/j.immuni.2007.04.013. [DOI] [PMC free article] [PubMed] [Google Scholar]
- 50.Svensson M, Johansson-Lindbom B, Zapata F, Jaensson E, Austenaa LM, Blomhoff R, Agace WW. Retinoic acid receptor signaling levels and antigen dose regulate gut homing receptor expression on CD8+ T cells. Mucosal Immunol. 2008;1:38–48. doi: 10.1038/mi.2007.4. [DOI] [PMC free article] [PubMed] [Google Scholar]
- 51.Becker TC, Coley SM, Wherry EJ, Ahmed R. Bone marrow is a preferred site for homeostatic proliferation of memory CD8 T cells. J Immunol. 2005;174:1269–1273. doi: 10.4049/jimmunol.174.3.1269. [DOI] [PubMed] [Google Scholar]
- 52.Parretta E, Cassese G, Barba P, Santoni A, Guardiola J, Di RF. CD8 cell division maintaining cytotoxic memory occurs predominantly in the bone marrow. J Immunol. 2005;174:7654–7664. doi: 10.4049/jimmunol.174.12.7654. [DOI] [PubMed] [Google Scholar]
- 53.Kondrack RM, Harbertson J, Tan JT, McBreen ME, Surh CD, Bradley LM. Interleukin 7 regulates the survival and generation of memory CD4 cells. J Exp Med. 2003;198:1797–1806. doi: 10.1084/jem.20030735. [DOI] [PMC free article] [PubMed] [Google Scholar]
- 54.Purton JF, Tan JT, Rubinstein MP, Kim DM, Sprent J, Surh CD. Antiviral CD4+ memory T cells are IL-15 dependent. J Exp Med. 2007;204:951–961. doi: 10.1084/jem.20061805. [DOI] [PMC free article] [PubMed] [Google Scholar]
- 55.Tokoyoda K, Zehentmeier S, Hegazy AN, Albrecht I, Grun JR, Lohning M, Radbruch A. Professional memory CD4+ T lymphocytes preferentially reside and rest in the bone marrow. Immunity. 2009;5:721–730. doi: 10.1016/j.immuni.2009.03.015. [DOI] [PubMed] [Google Scholar]
- 56.Arthos J, Cicala C, Martinelli E, Macleod K, Van RD, Wei D, Xiao Z, Veenstra TD, Conrad TP, Lempicki RA, McLaughlin S, Pascuccio M, Gopaul R, McNally J, Cruz CC, Censoplano N, Chung E, Reitano KN, Kottilil S, Goode DJ, Fauci AS. HIV-1 envelope protein binds to and signals through integrin α4β7, the gut mucosal homing receptor for peripheral T cells. Nat Immunol. 2008;9:301–309. doi: 10.1038/ni1566. [DOI] [PubMed] [Google Scholar]
Associated Data
This section collects any data citations, data availability statements, or supplementary materials included in this article.