Abstract
Purpose
Genetic factor is an important predisposing element influencing the susceptibility to osteoporosis and related complications. The purpose of the present study is to investigate whether genetic polymorphisms of farnesyl diphosphate synthase (FDPS) or geranylgeranyl diphosphate synthase (GGPS) genes were associated with the response to bisphosphonate therapy.
Materials and Methods
In the present study, 144 Korean women with osteoporosis were included. Among 13 genetic polymorphisms found within the FDPS and GGPS1 gene, 4 genetic polymorphisms with frequencies > 5% were selected for further study. Bone mineral density (BMD) response after 1 year treatment of bisphosphonate therapy was analyzed according to the genotypes.
Results
Women with 2 deletion allele of GGPS1 -8188A ins/del (rs3840452) had significantly higher femoral neck BMD at baseline compared with those with one or no deletion allele (0.768 ± 0.127 vs. 0.695 ± 0.090 respectively; p = 0.041). The response rate of women with 2 deletion allele of GGPS1 -8188A ins/del (28.6%) was significantly lower than the rate of women with one (81.4%) or no deletion allele (75.0%) (p = 0.011). Women with 2 deletion allele of GGPS1 -8188A ins/del had 7-fold higher risk of non-response to bisphosphonate therapy compared with women with other genotypes in GGPS1 -8188 after adjusting for baseline BMD (OR = 7.48; 95% CI = 1.32-42.30; p = 0.023). Other polymorphisms in FDPS or GGPS1 were not associated with lumbar spine BMD or femoral neck BMD.
Conclusion
Our study suggested that GGPS1 - 8188A ins/del polymorphism may confer susceptibility to femoral neck BMD response to bisphosphonate therapy in Korean women. However, further study should be done to confirm the results in a larger population.
Keywords: Polymorphism, osteoporosis, bisphosphonate
INTRODUCTION
Osteoporosis is a common disease that affects the majority of older women and men. The pathophysioloy of osteoporosis involves a broad spectrum of endogenous and environmental factors. At any particular age, about 70% of the bone phenotype variance is explained by genetic factors.1 Although no single major determinant has been established, polymorphisms in vitamin D receptor gene,2 collagen type I alpha 1 gene,3,4 estrogen receptor gene,5 interleukin-1 receptor antagonist gene,6 interleukin-6 gene,7 transforming growth factor receptor gene,8 transforming growth factor beta 1 gene,9 insulin-like growth factor-1 pathway,10 calcitonin receptor gene,11 apolipoprotein E gene12 and chromosomal loci 11q 12-1313 have been shown to be associated with bone mineral density (BMD).
Recent clinical trials have shown that response rates to bisphosphonate therapy, range from approximately 70% to 75% based on changes in BMD.14,15 Although bisphosphonate is known as a potent inhibitor of bone resorption and used for the treatment and prevention of osteoporosis, non-responders to bisphosphonate therapy is of potential concern to clinicians and patients.16 Several studies have been conducted to identify high risk groups of non-responder(s), based on baseline characteristics,14 early changes in biochemical markers of bone turnover17 and early changes in BMD.18 However, little is known about the common characteristics of non-responder(s) to help clinicians decide whether to initiate bisphosphonates or not. Variability in therapeutic response may reflect complex genetic factors. Indeed, several lines of evidence demonstrated that genetic factors were associated with response of treatment with bisphosphonate. For instance, Qureshi, et al.19 have identified signi-ficant associations between genetic polymorphisms of collagen type I alpha 1 gene and BMD response to alendro-nate treatment. In addition, femoral neck BMD response to cyclic etidronate therapy has been shown to be associated with vitamin D receptor gene polymorphism.20,21
Farnesyl diphosphate synthase (FDPS) and geranylgeranyl diphosphate synthase (GGPS) belong to the target enzymes in isoprenoid biosynthesis pathway, which are inhibited by bisphosphonate. Treatment with bisphosphonate results in reduction of geranylgeranyl diphosphate levels and induction of osteoclast apoptosis.22,23 Based on these, we hypothesized that genetic polymorphisms of FDPS and GGPS are good candidate for variable responses of BMD to bisphosphonate treatment. We, therefore, undertook this study to examine whether genetic polymorphisms of FDPS and GGPS1 were associated with response rate to bisphosphonate treatment among Korean women with osteoporosis.
MATERIALS AND METHODS
Subjects
The study group comprised pre- and post-menopausal women with newly diagnosed osteoporosis, who were given treatment with bisphosphonate therapy for the first time, and were admitted to two teaching hospitals located in Korea (Seoul National University Hospital and Ajou University Hospital) between September 1998 and January 2005. Clinical, laboratory and radiological studies were performed to exclude secondary causes of osteoporosis, such as hypogonadism, hyperthyroidism, multiple myeloma, and endogenous or exogenous hypercortisolism. Diagnosis of osteoporosis was made using manufacturer-provided reference values for Koreans and World Health Organization T-score criteria (T-score ≤ -2.5 at any site). Among total 182 patients, 38 patients dropped out during study period and 144 patients were finally analyzed, based on per protocol. The study was approved by the committee on human research of Seoul National University Hospital and written informed consent from all subjects was obtained at the time of blood sampling.
Treatment and diagnosis
All women received alendronate (Fosamax, Merck Sharp) at a dose of 10 mg/day or risedronate (Actonel, Sanofiaventis) at a dose of 5 mg/day. Patients were instructed to take the medication orally in the morning at least 30 min before breakfast with abundant water and on an empty stomach after an overnight fast, and to remain upright for at least 30 min after dosing. All patients were supplemented with calcium (200-600 mg elementary calcium per day) and vitamin D (200-800 IU per day).
BMD (g/cm2) of lumbar spine and femoral neck was measured at baseline by dual energy X-ray absorptiometry (DXA) using Lunar Prodigy Densitometer or Lunar Expert-XL densitometer (GE Medical. Systems, Madison, WI, USA). After 12 months of treatment, participants were followed up for BMD measurements.
Genotyping
From all subjects, 10 mL of peripheral blood was obtained. The genomic DNA was extracted from peripheral blood samples with using a PUREGENE blood DNA kit (Gentra Inc. Minneapolis, MN, USA) following the manufacturer's protocol.
For the SNP discovery, we screened for genetic variations in the FDPS and GGPS1 gene, including 2kb promoter region, using direct sequencing of 24 control samples and sequences were analyzed using an Applied Biosystems (Foster City, CA, USA) 3730xl DNA Analyzer. All SNPs and sequence alignments were analyzed by the Polyphred 5.04 (University of Washington, Seattle, WA, USA; http://droog.mbt.washington.edu/PolyPhred.html). Then, to investigate common polymorphisms, 4 single nucleotide polymorphisms with frequencies > 5% were selected among the 13 polymorphisms (Table 1).
Table 1.
Results of Discovery of Genetic Polymorphisms among 48 Control Samples
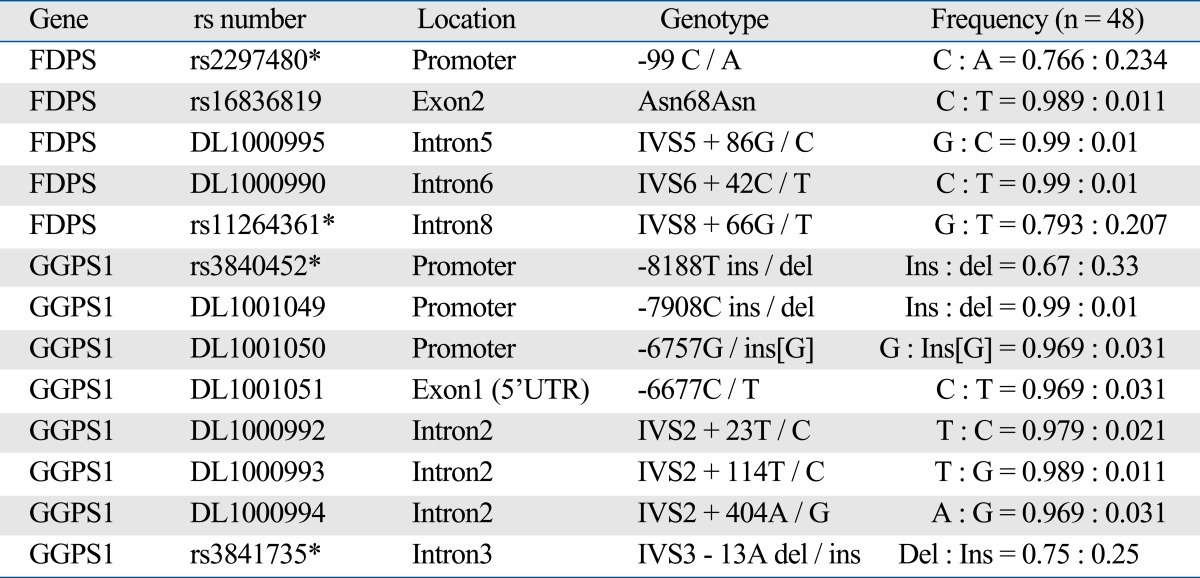
DL number represents Korean specific SNP.
*Selected SNPs for further analysis.
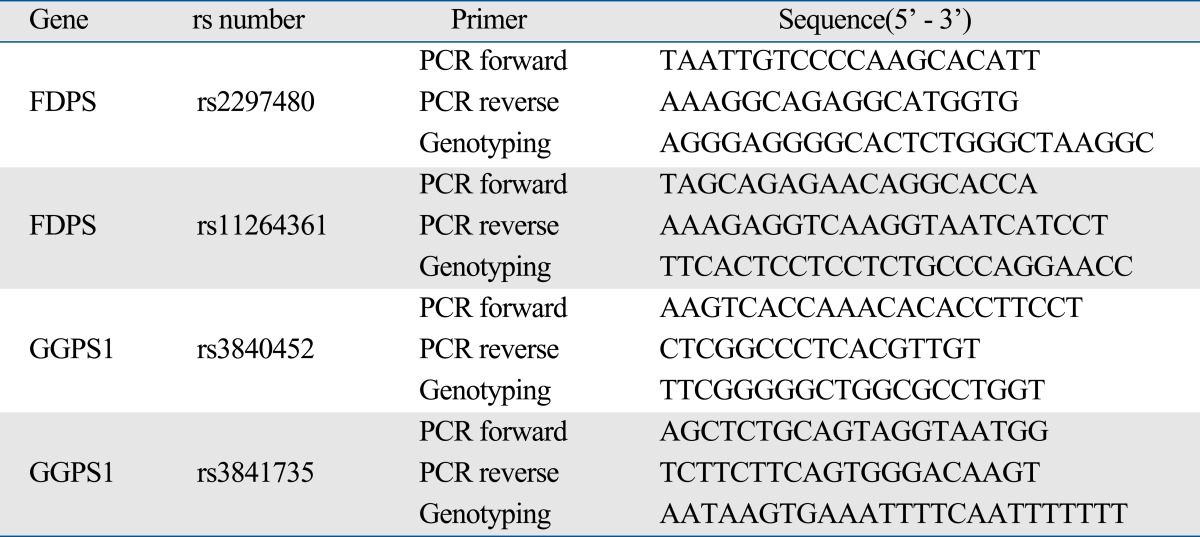
The FDPS gene polymorphisms were determined by SNP-ITTM assays with the SNPstream 25KTM System (Orchid Biosciences, Princeton, NJ, USA). Briefly, the genoemic DNA region spanning the polymorphic site was amplified using one each of phosphotiolated primer and regular PCR primer (Table 2). The genotypes of GGPS1 gene were assayed by single base primer extension assay by using an ABI PRISM SNaPShot Multiplex kit and ABI Prism 3730xl DNA analyzer (ABI, Foster City, CA, USA) according to the manufacturer's recommendation.
Table 2.
Primer Sequence for PCR and SNP-ITTM assay and / or SNaPShot
Statistical analysis
Genotype distributions were tested for Hardy-Weinberg equilibrium using χ2 analysis. Difference in variables between responders and non-responders were tested using t-test for independent samples. Differences in continuous variables were assessed by linear regression analyses with or without adjusting for baseline BMD. Age and body mass index (BMI) were tested as covariates in the model, however, the association between genetic polymorphisms and BMD were not significantly changed. Therefore, they were omitted in the final model for statistical stability. Results are presented as mean ± standard deviation (SD). A p value of < 0.05 was considered statistically significant.
Non-responder(s) to treatment were defined as subjects who experienced any decrease in first one year following BMD measurements. Non-responders in respect of lumbar spine BMD or femoral neck were analyzed separately. Association between response rate and genotype was calculated using Fisher's exact test. The risk of non-response to treatment was estimated with odds ratios (ORs) and 95% confidence intervals (95% CIs), using logistic regression models adjusting for baseline BMD. Statistical analyses were performed using SPSS 12.0 (SPSS Inc., Chicago, IL, USA).
RESULTS
General characteristics and results of measurements of the 144 participants are shown in Table 3. The average age, height, weight and BMI were 61.5 ± 9.9 yrs, 153.6 ± 5.6 cm, 55.5 ± 8.6 kg, and 23.5 ± 3.3 kg/m2, respectively. The average baseline and 1 year follow-up BMD of lumbar spine were 0.789 ± 0.122 g/cm2 and 0.839 ± 0.126 g/cm2, respectively. The average percent change of lumbar spine was 6.7 ± 7.0%. The average baseline and 1 year follow-up BMD of femoral neck were 0.698 ± 0.093 g/cm2 and 0.724 ± 0.097 g/cm2, respectively. The average percent change of lumbar spine was 3.7 ± 7.2%. Responders at lumbar spine BMD were older than non-responder(s) (62.5 ± 9.8 vs. 55.6 ± 9.1; p < 0.05). At femoral neck, the age between responders and non-responder(s) was not significantly different. There were no significant differences in the height, weight and BMI between responders and non-responder(s), at lumbar spine and femoral neck.
Table 3.
Characteristics of Study Subjects before and after 12 Months of Treatment with Bisphophonate (n = 144)
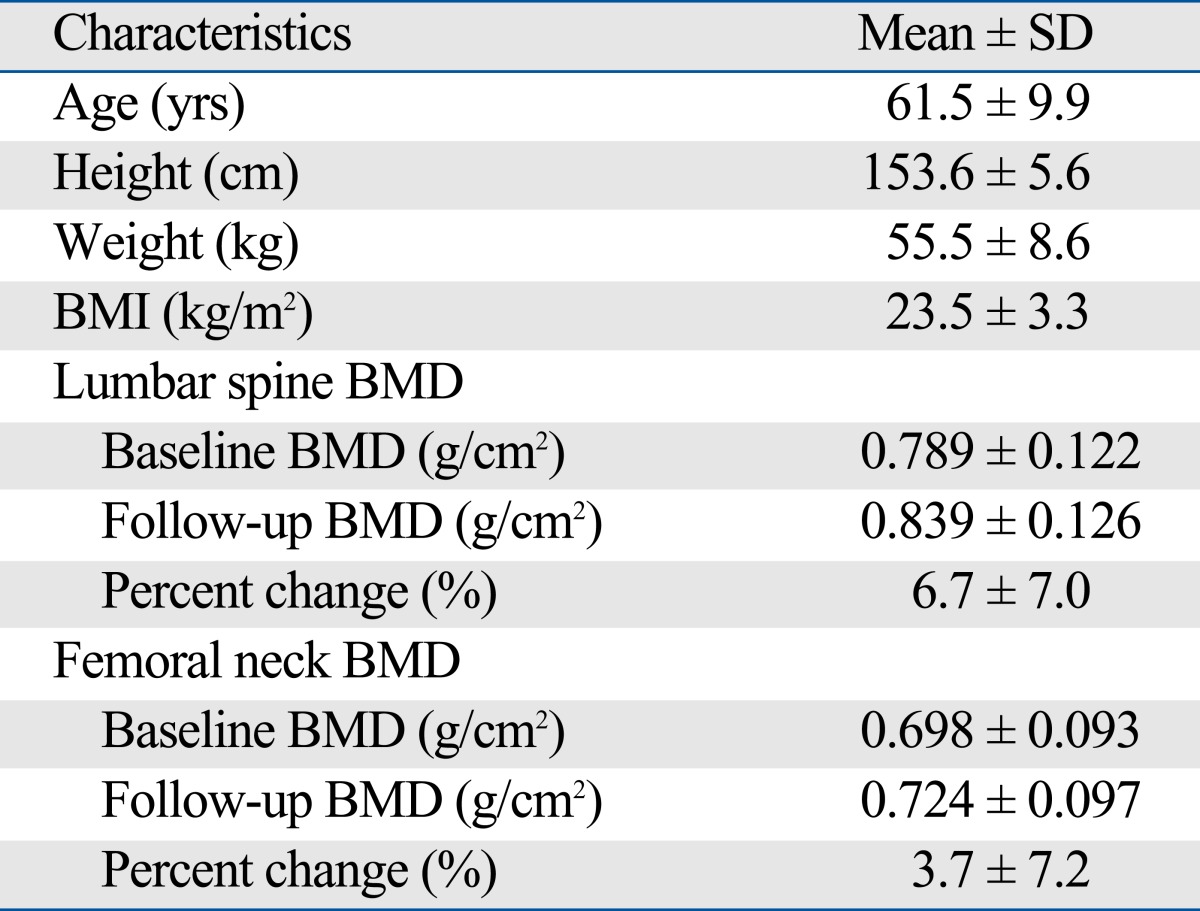
BMD, bone mineral density.
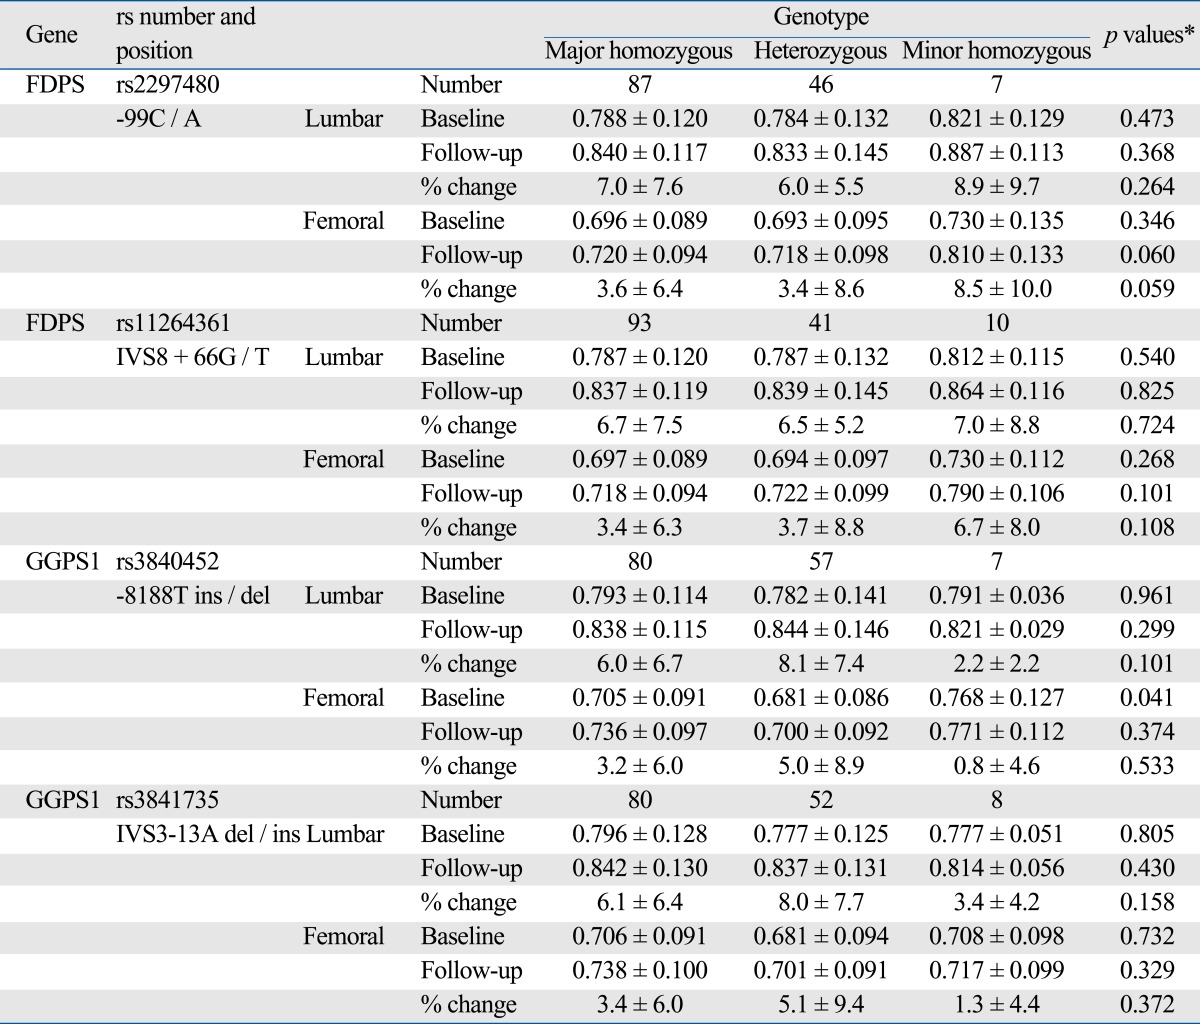
All genotype frequencies of FDPS and GGPS1 were in Hardy-Weinberg equilibrium. For FDPS rs2297480, FDPS rs11264361, GGPS1 rs3840452 and GGPS1 rs3841735, Hardy-Weinberg equilibrium χ2 (p-value) were 0.08 (0.96), 3.12 (0.21), 0.62 (0.73) and 0.01 (0.99), respectively. Height and weight were significantly associated with the genetic polymorphisms of FDPS and GGPS1. Women with FDPS AA genotype (rs2297480) or TT genotypes (rs11264361) had higher weight than women with other genotypes (p < 0.01). Women with GGPS1 -8188A two del alleles (rs3840452) had higher height than women with other genotypes (p = 0.017) (data not shown). Associations between BMD and genetic polymorphisms of GGPS1 and FDPS are shown in Table 4. Participants with two deletion allele of GGPS1 -8188A ins/del had significantly higher baseline femoral neck BMD than those with one or no deletion allele (0.768 ± 0.127 vs 0.695 ± 0.090; p = 0.041 recessive model). This association remained significant after adjusting for age and BMI (p = 0.018), but not significant after adjustment for either height or weight (data not shown).
Table 4.
Association between FDPS and GGPS1 Genetic Polymorphisms and Bone Mineral Density (BMD) before and after 12 months of Treatment with Bisphosphonate (10 mg/day) (mean ± SD)
BMD, bone mineral density.
*p values were calculated by linear regression analysis (recessive model, major homozygous + heterozygous vs. minor homozygous); p-values of follow-up and % changes were adjusted for baseline BMD.
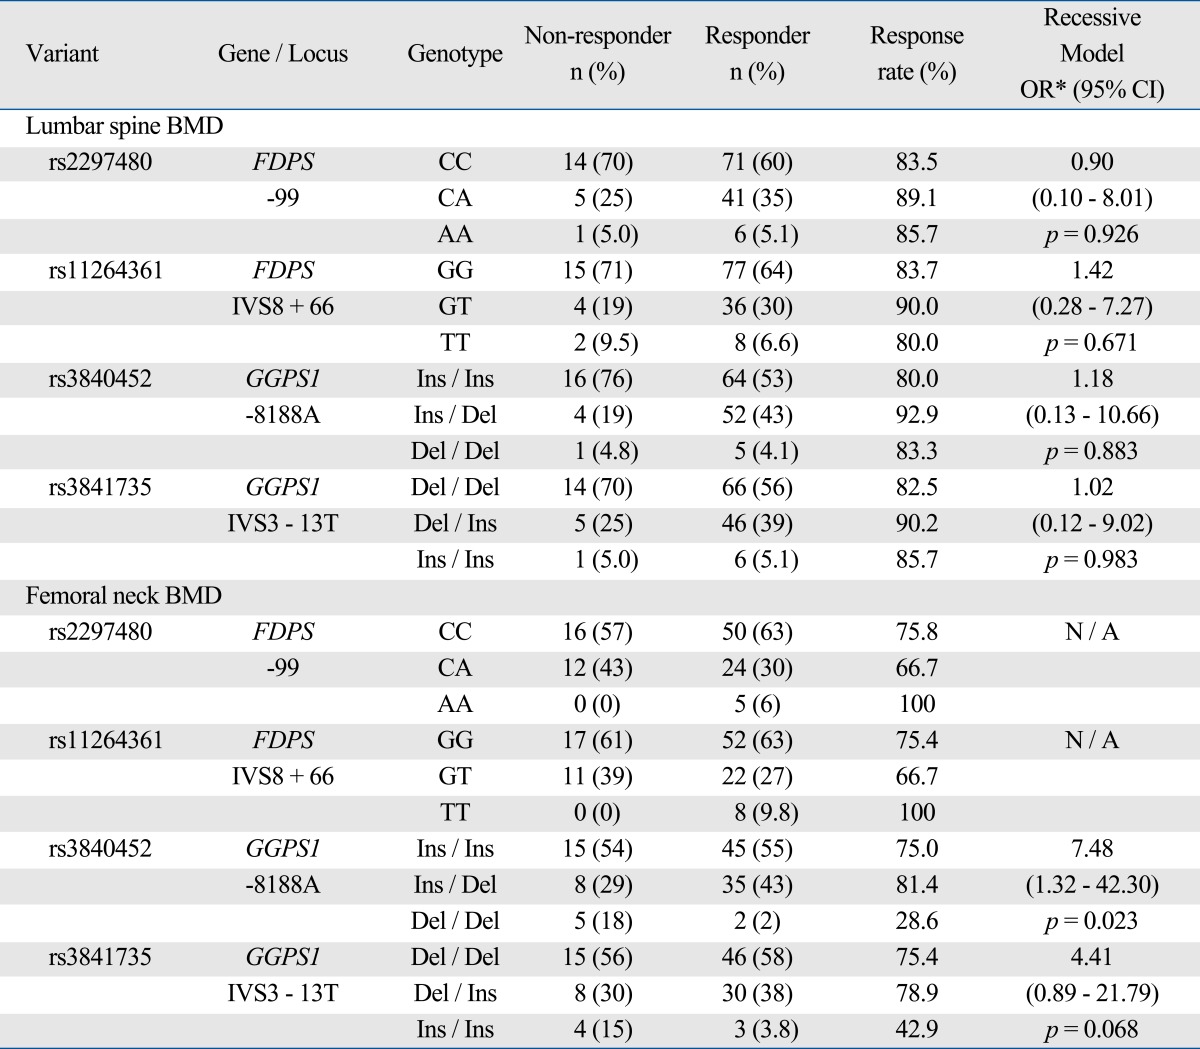
Based on the response criteria at femoral neck BMD, the response rate of women with two deletion allele of GGPS1 -8188A ins/del (28.6%) was significantly lower than the rate of women with one deletion allele (81.4%) or subjects with no deletion allele (75.0%) (p = 0.011) (Table 5). Women with two deletion allele of GGPS1 -8188A ins/del had 7-fold higher risk of non-response to bisphosphonate therapy compared with women with other genotypes in GGPS1 -8188 (OR = 7.48; 95% CI = 1.32-42.30; p = 0.023) after adjusting for baseline BMD. This association between GGPS1 -8188A ins/del and response rate remained significant after adjusting for a covariate (age, height, weight or BMI) or adjusting for multiple covariates (baseline BMD, age and BMI) (p < 0.05). The sensitivity of GGPS1 - 8188A ins/del polymorphism genotyping for predicting responder at the femoral neck for the "ins/ins" or "ins/del" genotype was 97.6% (80/82) with a specificity of 17.9% (5/28), and a positive predictive value of 77.7% (80/103).
Table 5.
Association between FDPS and GGPS1 Genetic Polymorphisms and Treatment Response with Bisphosphonate after 12 Months Follow Up
BMD, bone mineral density.
*ORs were calculated by logistic regression model (recessive model, major homozygous + heterozygous vs. minor homozygous) adjusting for baseline BMD. Nonresponders to treatment was defined as subjects who have any decrease in the 1 year following BMD measurements. N / A, not applicable.
Analyses with additive or dominant models did not show significant results. Other polymorphisms in FDPS or GGPS1 were not associated with either baseline BMD or response to treatment.
DISCUSSION
We found five and eight genetic polymorphisms of FDPS and GGPS1, respectively, in Korean women and investigated whether the genetic factors were associated with BMD as well as the response to bisphosphonate treatment. Among Korean women, GGPS1 -8188A ins/del genetic polymorphism was associated with BMD at baseline and the response rate to bisphosphonate therapy at femoral neck.
FDPS and GGPS are important enzymes in the isoprenoid biosynthesis pathway, which is important target of bisphosphonate treatment. In this study, we were not able to provide mechanistic insight into the functional consequences of the GGPS1 -8188A ins/del polymorphism. However, since GGPS1 -8188A ins/del polymorphism is located at the promoter region of GGPS1 gene, it may be plausible to expect that the polymorphism could alter GGPS1 gene transcription level and alter the GGPS concentration in turn. The efficacy of bisphosphonate to induce apoptosis of osteoclasts could be changed when GGPS concentration changes, since GGPS is one of the target molecules for bisphosphonate treatment.23
Even though the association between GGPS1 -8188A ins/del and response rate was significant after adjusting for covariates (baseline BMD, age and BMI), there could be other influence or confounding factors. Due to the study design and limitation to obtain patient information, further analyses including other phenotypes or lifestyle factors such as serum bone turnover markers, vitamin D status, PTH level, fracture history, smoking or alcohol history, dietary characteristics, or compliance to medication were not feasible. Future study including these factors could enhance the knowledge regarding the pharmacogenetic effect of FDPS and GGPS1 polymorphisms on bisphosphonate therapy. In addition, given that multiple comparison testing was performed in small number of participants, this study may have high risk of type I error (false positive).
GGPS1 -8188A ins/del was significantly associated with response rate at femoral neck, but not at lumbar spine. Similar to the result at femoral neck, the response rate of subjects with rare homozygote (del/del) at lumbar spine (83.3%) was also lower than that of subject with common homozygote (ins/ins) or heterozygote (ins/del) (85.3%), although not statistically significant. Small sample size might be the cause of insignificant statistical result regarding lumbar spine. The effect of this polymorphism on cortical bone and trabecular bone might be different, as many previous studies have suggested that cortical bone and trabecular bone have different drug effect and different regulating genes.24,25 Further study with larger sample size and mechanism analyses could clarify this issue.
No gene-dose effect was found regarding the association between GGPS1 -8188A ins/del and response rate at femoral neck. This lack of gene-dose effect could result from mechanism by which this polymorphism influences the bisphosphonate response. Since the GGPS1 gene encodes an enzyme, haploinsufficiency might not have enough effect to alter the response rate. Further study regarding the GGPS enzyme activity and the substrate levels would reveal the mechanism.
GGPS1 -8188A ins/del was significantly associated with response rate at femoral neck and baseline femoral neck BMD, but no significant difference was found in the % change in BMD at femoral neck. In accordance with the response rate, the % change in BMD at femoral neck of subject with two del allele was lower than that of subject with one or no del allele, although not statistically significant. This might also be due to small sample size, and further studies with larger sample size are needed for the verification.
The baseline BMD of subject with two del allele of GGPS1 -8188A ins/del polymorphism was significantly higher than those with one or no deletion allele. However, this association was not significant when height was included as a covariate. And GGPS1 -8188A ins/del polymorphism was significantly associated with height. Also, FDPS polymorphisms were significantly associated with weight. Since isoprenoid biosynthesis pathway including FDPS and GGPS enzyme is essential in the steroid synthesis, genetic difference in FDPS or GGPS gene could alter the height and weight. However this association regarding height and weight is beyond the scope of present study and further study is needed to investigate this issue.
Since the effect of bisphosphonate appears slowly in the course of treatment, more than two years follow-up BMD data could be adequate enough to determine a true response rate to bisphosphonate. However, a well designed study to predict subsequent BMD response to bisphosphonate from early BMD response suggested that any improvement in BMD at 6 or 12 months is strongly indicative of subsequent BMD response.18 Therefore, we assumed that one year follow-up BMD would be sufficient to classify "non-responder(s)" and "responders".
In the present study, we used "0%" (any decrease in BMD) as a cut-off value for identifying "non-responder(s)", consistent with previous studies.15,19 Other investigators also used "3% increase" as a cut-off value for significant BMD increase (least significant change) due to innate precision error of the test,14,26 and suggested that a "0-3% increase" should be considered as an "indeterminable response" rather than a significant response". We chose 0% as our cut-off value for two reasons. First, as the main objective of the present study was to identify definite "non-responder(s)" (any decrease in BMD) in the early course of therapy, the use of 0% as a cut-off value would be more reasonable to separate "indeterminable response" patients (0-3% increase in BMD) from the definite "non-responder(s)" (any decrease in BMD). Second, in light of the fact that more than 1 year is often required for bisphosphonate to sufficiently increase BMD by more than 3%, the use of cut-off value of 3% would underestimate the response rates in our short-term follow-up study design (1 year).
There are several limitations to the present study. Considerably small sample size does limit the statistical power of the present study. In particular, the number of subjects with two del/del allele of GGPS1 -8188A ins/del polymorphism was too small to make a firm conclusion. Lack of information regarding the risk factors for osteoporosis (level of physical activity, serum bone turnover markers, PTH level, fracture history, smoking or alcohol history, dietary characteristics, or compliance to medication) is an another important limitation to the present study. Other limitations include multiple testing issue and lack of biochemical results to support the underlying mechanisms. Future studies with larger population and functional mechanisms are needed and we are in a process to pursue this project.
In conclusion, our present study indicates that GGPS1 -8188A ins/del polymorphism is associated with the femoral neck BMD response rate to bisphosphonate therapy, although the strength of association was weak due to small sample size. These results could be used to build a basis of genotype-tailored guidelines for osteoporosis treatment, such as genotype screening before initiation of bisphosphonate therapy to prevent potential "non-responder(s)" from taking unnecessary medications.
ACKNOWLEDGEMENTS
This work was supported by a grant from Ministry of Health, Welfare and Family of Korea (03-PJ10-PG13-GD01-0002).
Footnotes
The authors have no financial conflicts of interest.
References
- 1.Eisman JA. Genetics of osteoporosis. Endocr Rev. 1999;20:788–804. doi: 10.1210/edrv.20.6.0384. [DOI] [PubMed] [Google Scholar]
- 2.Sainz J, Van Tornout JM, Loro ML, Sayre J, Roe TF, Gilsanz V. Vitamin D-receptor gene polymorphisms and bone density in prepubertal American girls of Mexican descent. N Engl J Med. 1997;337:77–82. doi: 10.1056/NEJM199707103370202. [DOI] [PubMed] [Google Scholar]
- 3.Uitterlinden AG, Burger H, Huang Q, Yue F, McGuigan FE, Grant SF, et al. Relation of alleles of the collagen type Ialpha1 gene to bone density and the risk of osteoporotic fractures in postmenopausal women. N Engl J Med. 1998;338:1016–1021. doi: 10.1056/NEJM199804093381502. [DOI] [PubMed] [Google Scholar]
- 4.Mann V, Hobson EE, Li B, Stewart TL, Grant SF, Robins SP, et al. A COL1A1 Sp1 binding site polymorphism predisposes to osteoporotic fracture by affecting bone density and quality. J Clin Invest. 2001;107:899–907. doi: 10.1172/JCI10347. [DOI] [PMC free article] [PubMed] [Google Scholar]
- 5.Mizunuma H, Hosoi T, Okano H, Soda M, Tokizawa T, Kagami I, et al. Estrogen receptor gene polymorphism and bone mineral density at the lumbar spine of pre- and postmenopausal women. Bone. 1997;21:379–383. doi: 10.1016/s8756-3282(97)00178-6. [DOI] [PubMed] [Google Scholar]
- 6.Keen RW, Woodford-Richens KL, Lanchbury JS, Spector TD. Allelic variation at the interleukin-1 receptor antagonist gene is associated with early postmenopausal bone loss at the spine. Bone. 1998;23:367–371. doi: 10.1016/s8756-3282(98)00109-4. [DOI] [PubMed] [Google Scholar]
- 7.Tsukamoto K, Yoshida H, Watanabe S, Suzuki T, Miyao M, Hosoi T, et al. Association of radial bone mineral density with CA repeat polymorphism at the interleukin 6 locus in postmenopausal Japanese women. J Hum Genet. 1999;44:148–151. doi: 10.1007/s100380050132. [DOI] [PubMed] [Google Scholar]
- 8.Langdahl BL, Knudsen JY, Jensen HK, Gregersen N, Eriksen EF. A sequence variation: 713-8delC in the transforming growth factor-beta 1 gene has higher prevalence in osteoporotic women than in normal women and is associated with very low bone mass in osteoporotic women and increased bone turnover in both osteoporotic and normal women. Bone. 1997;20:289–294. doi: 10.1016/s8756-3282(96)00363-8. [DOI] [PubMed] [Google Scholar]
- 9.Keen RW, Snieder H, Molloy H, Daniels J, Chiano M, Gibson F, et al. Evidence of association and linkage disequilibrium between a novel polymorphism in the transforming growth factor beta 1 gene and hip bone mineral density: a study of female twins. Rheumatology (Oxford) 2001;40:48–54. doi: 10.1093/rheumatology/40.1.48. [DOI] [PubMed] [Google Scholar]
- 10.Kurland ES, Rosen CJ, Cosman F, McMahon D, Chan F, Shane E, et al. Insulin-like growth factor-I in men with idiopathic osteoporosis. J Clin Endocrinol Metab. 1997;82:2799–2805. doi: 10.1210/jcem.82.9.4253. [DOI] [PubMed] [Google Scholar]
- 11.Masi L, Becherini L, Colli E, Gennari L, Mansani R, Falchetti A, et al. Polymorphisms of the calcitonin receptor gene are associated with bone mineral density in postmenopausal Italian women. Biochem Biophys Res Commun. 1998;248:190–195. doi: 10.1006/bbrc.1998.8880. [DOI] [PubMed] [Google Scholar]
- 12.Shiraki M, Shiraki Y, Aoki C, Hosoi T, Inoue S, Kaneki M, et al. Association of bone mineral density with apolipoprotein E phenotype. J Bone Miner Res. 1997;12:1438–1445. doi: 10.1359/jbmr.1997.12.9.1438. [DOI] [PubMed] [Google Scholar]
- 13.Johnson ML, Gong G, Kimberling W, Reckér SM, Kimmel DB, Recker RB. Linkage of a gene causing high bone mass to human chromosome 11 (11q12-13) Am J Hum Genet. 1997;60:1326–1332. doi: 10.1086/515470. [DOI] [PMC free article] [PubMed] [Google Scholar]
- 14.Gallagher JC, Rosen CJ, Chen P, Misurski DA, Marcus R. Response rate of bone mineral density to teriparatide in postmenopausal women with osteoporosis. Bone. 2006;39:1268–1275. doi: 10.1016/j.bone.2006.06.007. [DOI] [PubMed] [Google Scholar]
- 15.Bonnick S, Saag KG, Kiel DP, McClung M, Hochberg M, Burnett SM, et al. Comparison of weekly treatment of postmenopausal osteoporosis with alendronate versus risedronate over two years. J Clin Endocrinol Metab. 2006;91:2631–2637. doi: 10.1210/jc.2005-2602. [DOI] [PubMed] [Google Scholar]
- 16.Lewiecki EM. Nonresponders to osteoporosis therapy. J Clin Densitom. 2003;6:307–314. doi: 10.1385/jcd:6:4:307. [DOI] [PubMed] [Google Scholar]
- 17.Kim SW, Park DJ, Park KS, Kim SY, Cho BY, Lee HK, et al. Early changes in biochemical markers of bone turnover predict bone mineral density response to antiresorptive therapy in Korean postmenopausal women with osteoporosis. Endocr J. 2005;52:667–674. doi: 10.1507/endocrj.52.667. [DOI] [PubMed] [Google Scholar]
- 18.Crilly RG, Sebaldt RJ, Hodsman AB, Adachi JD, Brown JP, Goldsmith CH, et al. Predicting subsequent bone density response to intermittent cyclical therapy with etidronate from initial density response in patients with osteoporosis. Osteoporos Int. 2000;11:607–614. doi: 10.1007/s001980070082. [DOI] [PubMed] [Google Scholar]
- 19.Qureshi AM, Herd RJ, Blake GM, Fogelman I, Ralston SH. COLIA1 Sp1 polymorphism predicts response of femoral neck bone density to cyclical etidronate therapy. Calcif Tissue Int. 2002;70:158–163. doi: 10.1007/s00223-001-1035-9. [DOI] [PubMed] [Google Scholar]
- 20.Palomba S, Numis FG, Mossetti G, Rendina D, Vuotto P, Russo T, et al. Effectiveness of alendronate treatment in postmenopausal women with osteoporosis: relationship with BsmI vitamin D receptor genotypes. Clin Endocrinol (Oxf) 2003;58:365–371. doi: 10.1046/j.1365-2265.2003.01724.x. [DOI] [PubMed] [Google Scholar]
- 21.Palomba S, Orio F, Jr, Russo T, Falbo A, Tolino A, Manguso F, et al. BsmI vitamin D receptor genotypes influence the efficacy of antiresorptive treatments in postmenopausal osteoporotic women. A 1-year multicenter, randomized and controlled trial. Osteoporos Int. 2005;16:943–952. doi: 10.1007/s00198-004-1800-5. [DOI] [PubMed] [Google Scholar]
- 22.Bergstrom JD, Bostedor RG, Masarachia PJ, Reszka AA, Rodan G. Alendronate is a specific, nanomolar inhibitor of farnesyl diphosphate synthase. Arch Biochem Biophys. 2000;373:231–241. doi: 10.1006/abbi.1999.1502. [DOI] [PubMed] [Google Scholar]
- 23.Guo RT, Cao R, Liang PH, Ko TP, Chang TH, Hudock MP, et al. Bisphosphonates target multiple sites in both cis- and transprenyltransferases. Proc Natl Acad Sci U S A. 2007;104:10022–10027. doi: 10.1073/pnas.0702254104. [DOI] [PMC free article] [PubMed] [Google Scholar]
- 24.Turner CH. Biomechanics of bone: determinants of skeletal fragility and bone quality. Osteoporos Int. 2002;13:97–104. doi: 10.1007/s001980200000. [DOI] [PubMed] [Google Scholar]
- 25.Silverman SL. Management of corticosteroid-induced osteoporosis: a clinician's perspective. Calcif Tissue Int. 1992;50:101–103. doi: 10.1007/BF00298781. [DOI] [PubMed] [Google Scholar]
- 26.Bonnick SL, Shulman L. Monitoring osteoporosis therapy: bone mineral density, bone turnover markers, or both? Am J Med. 2006;119(4 Suppl 1):S25–S31. doi: 10.1016/j.amjmed.2005.12.020. [DOI] [PubMed] [Google Scholar]


