

Abstract
The time taken to transcribe most metazoan genes is significant because of the substantial length of introns. Developmentally regulated gene networks, where timing and dynamic patterns of expression are critical, may be particularly sensitive to intron delays. We revisit and comment on a perspective last presented by Thummel 16 years ago: transcriptional delays may contribute to timing mechanisms during development. We discuss the presence of intron delays in genetic networks. We consider how delays can impact particular moments during development, which mechanistic attributes of transcription can influence them, how they can be modeled, and how they can be studied using recent technological advances as well as classical genetics.
Presence of Introns
Only 5% of the average, 27-kilobase (kb) human gene encodes protein; the majority is intronic sequence (Venter et al., 2001). Thus, transcription represents a significant commitment of both energy and time (Figure 1). At one end of the spectrum, highly expressed genes tend to have short introns (Castillo-Davis et al., 2002). This correlation has been used to suggest selection for transcriptional economy on genes with very high expression. In the opposite extreme, such as the 2400 kb human dystrophin gene that is 99% intronic, transcription can take more than 16 hr (Tennyson et al., 1995). Others have discussed roles for introns as the framework for alternative splicing, sites of transcriptional regulation, influencers of nuclear export and translation, and sites of chromatin structural elements. Because introns comprise such a large portion of metazoan genes, we ask how the self-evident time delays of introns contribute to developmental gene networks (Thummel, 1992)
Figure 1. Cartoon Depicting Great Length of pre-mRNA in Relation to Processed mRNA.

As currently annotated, the average human gene is 95% intronic, and the time it takes to transcribe the considerable length of introns contributes to the time delay during gene expression.
Gene Expansion through Introns
In general, cumulative intron lengths are considerably greater in human and mouse genes compared with those of Arabidopsis thaliana, Ciona intestinalis, Drosophila melanogaster, Anopheles gambiae, and Caenorhabditis elegans (Hong et al., 2006; Yandell et al., 2006). This raises the questions of how and why gene length by intron expansion occurs during evolution. Interestingly, comparative studies between Drosophila species suggest that intron lengths can be indicative of the time period to a last common ancestor between orthologous genes (Yandell et al., 2006). Additionally, introns present within 5′ untranslated regions (UTRs) are significantly larger than both introns that interrupt protein coding sequence and introns within 3′ UTRs (Hong et al., 2006). This finding supports the idea that 5′ UTRs are under less evolutionary pressure for conservation of length than coding sequences are (Hong et al., 2006).
The mechanism by which introns have expanded during evolution remains unclear. The overall increase of intron size may be attributed to smaller population sizes that allow introns to expand by genetic drift, escaping natural selection for economy in the absence of immediate adaptive roles (Lynch and Conery, 2003). Additional explanations include inherent differences in recombination or transposition mechanisms (Roy and Gilbert, 2006). A mechanistic bias for expanding genes instead of reducing genes could combine with genetic drift to increase gene sizes. High-throughput approaches for identifying genomic variation based on large insertions and deletions found that, among humans, large insertions and deletions are potentially common sources of genetic diversity (Korbel et al., 2007; Redon et al., 2006; Tuzun et al., 2005). Between two humans, 243 large insertions or deletions out of 1297 identified structural variations were found to map to annotated introns (Korbel et al., 2007). Eighty-six percent of all identified structural variations arose by either nonhomologous end-joining or retrotransposition (Korbel et al., 2007). To determine how structural variety arises and gene size increases will require more detailed analyses of genome architecture variation within species and between related species.
Heterochronic Changes
Development of an embryo occurs with the coordinated spatial and temporal production of gene products. Heterochrony is evolutionary change caused by the altered timing or kinetics of developmental processes (for an excellent review see Smith, 2003). Despite the many successes of developmental genetics, screens have had limited success in identifying the genetic basis of heterochronic changes. Although mutant alleles altering transcriptional kinetics have not emerged for specific genes, or are perhaps under-characterized, transcriptional delays have been shown to contribute to developmental timing. Thus, the corresponding transcriptional delay may potentially contribute to heterochronic changes. The extension of introns within a gene would delay either complete activation or complete repression until later in a developmental program (Figures 2A and 2B). Conversely, removal of introns, in extreme instances by retro-transposition, could shift expression or loss of the gene product to a much earlier time in development.
Figure 2. Schematic Depictions of the Behavior Exhibited by Four Genetic Network Motifs Sensitive to Transcriptional Time Delays.
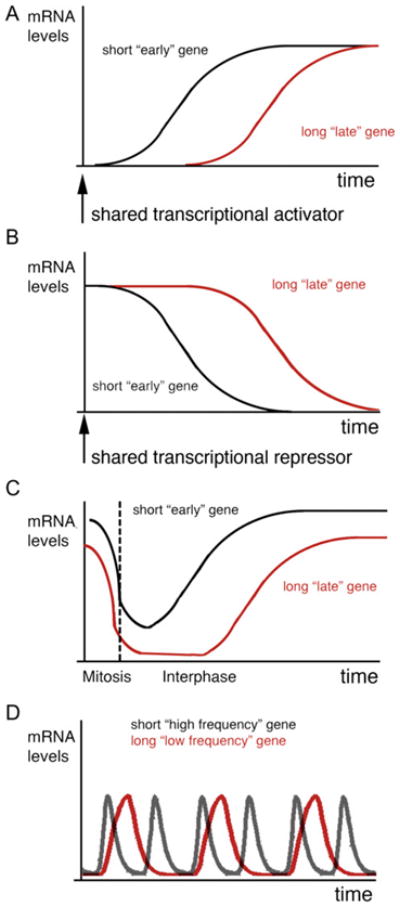
(A) In response to a shared transcriptional activator, a longer gene with more intron length will take more time to reach a steady-state expression level than a shorter gene because of the greater time delay during the transcription of its length.
(B) In response to a shared transcriptional repressor, the nascent polymerases along a longer gene will take longer to clear, and therefore the duration of expression will be extended. The behavior of this network motif is very dependent on the stabilities of mRNA and proteins.
(C) During the cell cycle, RNA polymerase II disengages from chromatin during prophase to late anaphase. Therefore, longer genes will take more time to resume steady-state expression levels during the subsequent cell cycle. (Steady-state expression levels are depicted as being different for visualization purposes).
(D) Within an autoinhibitory transcriptional network, the presence of long time periods between transcription initiation and repression by a folded, nuclear repressor destabilizes the system. When the protein and mRNAs are suitably unstable and there exists some cooperativity in how the repressor binds its own promoter, oscillations in expression can occur. The frequency of the oscillations depends on the length of the time delay; therefore, intron length can determine the time interval between expressions.
Temporal Accuracy of Gene Expression
The unfolding of genetic networks during development depends on temporal organization, and therefore the addition of time delays may have significant effects on how an egg becomes an animal. Transcriptional delays were first invoked in 1970 while discussing biological timing for lambda phage and their use of long, late operons (Watson, 1970). Recognizing correlations between gene size and developmental timing, David Gubb later noted that the Drosophila Antennapedia (Antp) and Ultrabithorax (Ubx) genes owe their extreme lengths to large introns and formally introduced the intron delay hypothesis (Gubb, 1986). With the knowledge that the development of the fly’s body plan is sensitive to the proper expression of these genes in space and time, Gubb proposed that intron length could function as a time delay and aid the orchestration of gene expression patterns.
The intron delay hypothesis encompasses two intuitive scenarios. Different genes could respond in temporal waves to a single transcription activator or repressor due to hard-wired, genetic differences in transcriptional delays implemented by intron length (Figures 2A and 2B). When embedded in genetic cascades, transcriptional delays would be expected to accumulate along with the time involved in other aspects of gene expression. As the proper context will be necessary for both studying delays and understanding their influence, we present several lines of evidence where roles for intron delays become more apparent in biological contexts.
Ubx-Effect and the Slowing Down of Transcription
While easily overlooked as pleiotropic effects, the phenotypes associated with mutations that alter global transcriptional kinetics may take root in the inappropriate realization of intron delays. A Drosophila selection for mutants resistant to α-amanitin, which inhibits transcription elongation by RNA polymerase II, identified several mutant alleles that map to the large subunit of RNA polymerase II (Greenleaf et al., 1979; Mortin and Lefevre, 1981). In addition to α-amanitin resistance, many of these alleles mimic the Ubx mutant phenotype where the third thoracic segment is transformed to the fate of the second thoracic segment (Voelker et al., 1985). Additional biochemical characterization revealed that transcription complexes in these mutants transcribe at approximately half the rate of wild-type transcription elongation complexes (Coulter and Greenleaf, 1985). How slow transcription alters some phenotypes and not others remains unknown. Additional questions emerge with regards to whether network timing scales linearly with transcription kinetics.
Transcription Elongation Defects in Vertebrates
If intron delays have critical roles during developmental programs, then expression networks that depend on intron delays should be sensitive to perturbation of transcription elongation rates. Phenomena supporting this logic emerged in the genetic system of Danio rerio. The foggy and pandora mutants were identified for defects in both heart and neural development with the additional phenotype of shorter tails (Guo et al., 1999; Stainier et al., 1996). The mutants were mapped to the transcription elongation factors Spt5 and Spt6 (Cooper et al., 2005; Guo et al., 2000; Keegan et al., 2002). The nature of these mutants suggests critical roles for transcription elongation rates in the development of particular tissues and cell types. In the pandora (Spt6) background, researchers found that the transcripts of tbx20 (hrT), which encodes a protein required for heart development, are expressed inappropriately late during development and in the incorrect location when compared with wild-type (Griffin et al., 2000). While the molecular mechanism underlying this correlation might entail transcription initiation, elongation, RNA processing, or some combination thereof, the line of evidence suggests that transcriptional kinetics have important roles during vertebrate development.
Cell-Cycle Constraint Entrains Intron Delays in Early Development
An additional context relevant for the intron delay hypothesis is the interruption of transcription. From early prophase to late anaphase a cell’s chromatin condenses and RNA polymerase II disengages, and transcription is thus repressed (Shermoen and O’Farrell, 1991; Taylor, 1960). Additional evidence exists for active repression of transcription in the absence of nucleosomes and chromatin condensation during mitosis (Spencer et al., 2000). For most genes whose products are stable or expressed in cells with long cell cycles, this is an insignificant perturbation. However, work in Drosophila suggested a role for intron delays within the context of rapid, embryonic cell cycles. Using detailed knowledge of early cell divisions that are as short as 8 min in Drosophila, Shermoen and O’Farrell (1991) examined the transcription of the 77 kb Ubx gene by in situ hybridization. They observed initiation of Ubx transcription in the 13th cell cycle, but found that the nascent transcripts were prematurely aborted by mitosis cycles 14 and 15.
The reinitiation of transcription during the early G1 phase of the cell cycle introduces a delay time proportional to a gene’s length. During this delay, the protein product remains below steady-state levels, or even decreases due to degradation and dilution from cell growth (Figure 2C). A study of a duplicated pair of gap genes, kni and knrl, exposed a broader significance for the cell-cycle constraint (Rothe et al., 1992). Since they encoded identical proteins with ostensibly identical expression patterns that begin during the 13th cell cycle of fly development, kni and knrl appeared to be redundant. However, mutants of the kni gene were unable to segment their abdomens, while knrl was not required for abdominal segmentation. Surprisingly, ectopic expression of either kni or knrl mRNA rescued the abdominal defect of kni mutants. However, the genes differed in length: kni is 3 kb in size, while knrl is 23 kb in size because of larger introns. The short length of the fly’s 13th cell cycle was shown to act as an interruption preventing the complete transcription of knrl’s gene length. This is an example of how a change in gene length might lead to a change in expression timing, and to potential morphological changes during evolution consistent with heterochronic change.
The Maternal-Zygotic Transition and Minimal Delays
During the course of embryonic development, transcriptional timing first becomes important during the maternal-zygotic transition when the genome is initially activated. To investigate genes activated during the maternal-zygotic transition, De Renzis et al. (2007) used chromosomal deletions in Drosophila to identify the genes that are first transcribed during this transition. The study identified 59 genes activated during the maternal-zygotic transition—41 of which are annotated to be intronless (a significant enrichment given that only 20% of Drosophila genes are intronless). The implication of this enrichment is that early genes would have been under pressure to stay short by being intronless. While certainly a conspicuous and understandable enrichment in light of the cell-cycle constraint, this finding raises additional questions with regards to how initiation events are coordinated with embryogenesis. It is possible that during activation of the zygotic genome, many longer genes are also initiated by the same activation cues that turn on intronless genes. However, because of the combined impact of transcriptional delays and disruption from the cell-cycle constraint, early rounds of transcription are incomplete. Coregulated genes (particularly longer ones) may be missed because of the focus on the levels of poly-adenylated mRNA; aborted transcription or slow elongation events are thereby overlooked.
Modular Use of Intron Delays
Functional genomic analyses implicate introns as important regulated modules. Of interest is the recent finding in Drosophila of prevalent distal transcription start sites induced throughout development to introduce large intron modules (Manak et al., 2006). During the first 24 hr of fly development, 1118 genes were identified to have previously unannotated transcription at distal 5′ sites. Together, these putative transcriptional start sites increased gene space by 16 megabases (a 21% increase) while increasing the average first intron from 1.6 kb to 18.4 kb. With these extensions in gene length come implicit increases in the time delay between transcription initiation and protein production. Mutagenic P elements map to these distal start sites and emphasize their importance during development.
If intron delays modulate heterochronic change, then their alteration could affect some aspects of morphological evolution. Directing us toward this potential, recent findings have identified cis-regulatory elements upstream of the fly shavenbaby (svb, also known as ovo) gene responsible for different patterns of expression between D. melanogaster and D. sechellia that underlie morphological differences in fly hairiness (McGregor et al., 2007). Svb/ovo is a transcription factor required cell-autonomously for trichome development and its expression begins in stage 13 epidermal cells. In D. melanogaster the medial and distal cis-regulatory elements map 27 and 45 kb upstream of the annotated transcriptional start site of svb/ovo. In D. sechellia, differences in medial and distal cis-regulatory elements exclude expression of svb/ovo in cells that later fail to form trichomes in the hairless regions of the fly. Interestingly, the D. melanogaster loci are among the putative distal transcription starts identified by Manak et al. (2006). It remains to be tested whether these cis-regulatory sequences function as switches, modular intron delays, or both to determine the accurate activation of the hair-inducing developmental program.
After embryonic development, distal transcription start sites and their intron modules have been observed in humans. These may have roles in the dynamics of tissue-specific expression and in the genetic responses to stimuli such as hormone signaling, stress, and challenges to the immune system (Denoeud et al., 2007). On the whole, the prevalence of modular intron lengths from alternative promoters has gone unnoticed until recently and it will be exciting to learn how they are used in different networks.
Delayed Autoinhibition and Somitogenesis
Autoinhibition can occur when a transcription factor represses the transcription initiation of its own gene. This is a common genetic network motif that has been shown in Escherichia coli to stabilize gene expression levels, to reduce the distribution of protein levels, and to reduce the time needed by a strong promoter to reach a steady state (Becskei and Serrano, 2000; Dublanche et al., 2006; Rosenfeld et al., 2002). Autoinhibition is also a common network motif in eukaryotes, where its functional roles are less characterized (Lee et al., 2002). When time delays in the transcription of long metazoan genes are explicitly accounted for, different expression dynamics become possible. Like the time delay imparted by distances and diffusivity in Turing models, transcriptional delays may drive multiple waves of periodic expression, as proposed for the genetic networks underlying somitogenesis, p53 expression, and NF-kappaB expression (Giudicelli et al., 2007; Goodwin, 1965; Lewis, 2003; Mahaffy and Pao, 1984; Monk, 2003). In the context of development, Julian Lewis has proposed that expression delays in clock genes determine the period by which somites are formed in vertebrates such as zebrafish (qualitative behavior depicted in Figure 2D; Lewis, 2003). At the center of this clock is a single gene for a transcription factor that inhibits its own transcription after delays in its expression. As transcription of introns likely dominates the temporal delay between transcription initiation and the presence of translation-competent mRNA for the majority of metazoan genes, the intron delay becomes increasingly important for determining the period of this network’s oscillations.
Transcription Elongation Rates
The transcription elongation rate of RNA polymerase II across a gene determines the conversion of intron length to delay time. The first measurements of RNA polymerase II transcription rates in mammalian cells were performed in the 1970s, when the average rate of increase in length of total, metabolically labeled pre-mRNA was found to be 50–100 nucleotides per second (Sehgal et al., 1976). Since then, other studies have measured transcription speeds, by several techniques and in different conditions, at 18–72 nucleotides per second (Darzacq et al., 2007; Femino et al., 1998; O’Brien and Lis, 1993; Tennyson et al., 1995). It is unclear exactly why this broad range of velocities has been observed. Future studies will need to examine what impact variables such as organism, cell type, developmental stage, gene structure, and the conditions under which the measurements are made have on transcription elongation rates.
RNA polymerase II pauses, and this can affect when a gene’s expression occurs. Pausing is considered to be a distinct configuration for transcription elongation complexes. While pausing presents another target for regulation during transcription, its prevalence also extends the time taken to transcribe long genes. Current views on the structural basis underlying pausing have been discussed elsewhere (Landick, 2006). In brief, pauses initiate when the active site of the transcription complex rearranges in response to nucleic acid sequences, additional elongation factors, or both. This transition can occur stochastically, but at a greater frequency along particular sequences (Adelman et al., 2002; Davenport et al., 2000; Herbert et al., 2006; Neuman et al., 2003). Once in the pause state, longer pausing has been observed to occur in response to inherent polymerase backtracking, cofactor activity, RNA structures, or mediation by downstream DNA sequences (Landick, 2006). With regards to pausing during development, a recent study revealed many instances of pausing during Drosophila development (Zeitlinger et al., 2007). How mechanistic aspects of pausing influence transcriptional timing during development is unknown.
Recent advances provide the first view of transcription kinetics in vivo (Darzacq et al., 2007). Over a 2.3 kb region of a reporter gene, cumulative pausing residence times of 204–307 s were observed by measuring the bleaching and accumulation of fluorescent labels of mRNA and RNA polymerase II (Darzacq et al., 2007). Because of this pausing time, maximal transcription rates of 72 nucleotides per second appear as an average 6.3 nucleotides per second (Darzacq et al., 2007). It remains unclear what lengths of time elongation complexes spend in individual stabilized pauses.
With respect to the unique genome architecture of metazoans, evidence for pausing exists in promoter proximal locations, in exons (particularly alternative exons), and at sites of 3′ processing (Andrulis et al., 2000; Brodsky et al., 2005; Gromak et al., 2006; Muse et al., 2007; Plant et al., 2005; Swinburne et al., 2006; Ujvari and Luse, 2004; Zeitlinger et al., 2007). Coincidental pausing at sites of RNA processing presents the possibility that, in vivo, these processes are coregulated. Alternatively, the loading of the large masses of processing machinery may decelerate a transcription elongation complex that produces a constant force.
Heterogeneity in Elongation Rates
A striking finding of the single-molecule studies of RNA polymerase II performed in cell-free systems is that individual enzymes have characteristic constant velocities. However, within the population of enzymes, the transcription velocities span a broad Gaussian distribution with an average velocity of 12.7 nucleotides per second and a standard deviation of 4.9 nucleotides per second (Adelman et al., 2002; Davenport et al., 2000; Neuman et al., 2003). It is unclear whether this heterogeneity is unique to the in vitro assay and short timescales used, or whether it has significance in vivo in the presence of posttranslation regulation, cofactors, and obstacles unique to chromatin templates (Neuman et al., 2003). The potential implications for this heterogeneity will be discussed as we review the conversion of mechanistic knowledge into mathematical models.
Introducing Intron Delays into Network Models
While the ultimate goal of quantitative modeling of biological networks may be to predict accurate as well as nonintuitive behavior in response to change, the approach can also force one to consider how to treat particular biochemical events and how to judge which parameters are important and which can be ignored without sacrificing understanding. Discussion of the epistemology of modeling as it relates to biology has already been skillfully presented elsewhere (Hasty et al., 2001; Mogilner et al., 2006). With respect to transcriptional delays and intron lengths, quantitative experimental data does not exist for how they impact developmental networks. Nonetheless, the exercise of modeling their impact forces one to consider how to translate mechanistic knowledge into mathematical relationships. As discussed herein, expression delays, when introduced into models of delayed autoinhibition, can potentially produce oscillatory behavior (Goodwin, 1965; Lewis, 2003; Mahaffy and Pao, 1984; Monk, 2003). In one model of somitogenesis, the time delays of expression are treated as sharp and fixed periods of time (Lewis, 2003). This treatment of delays allows one to use available algorithms to solve delay differential equations and determine their impact on the network of interest. The relevance of this type of modeling to developmental gene networks, however, remains unclear because it is unknown how transcriptional delays behave in vivo.
Heterogeneity: Distributed Delays and Traffic Jams
In light of the prevalence of pausing and the heterogeneity of transcription rates among a population of polymerases, one alternative approach is to treat expression delays as a distribution of times. With regards to genetic networks containing delayed autoinhibition, a distributed delay imparts the same behavior as a sharp delay—with the period responding to the mean delay time (Monk, 2003). When one considers the potential for a distributed delay, questions are raised with regards to when a delayed process becomes just a slow or lagging process. Compartmentalization of the metazoan cell prevents translation from initiating before transcription, splicing, and nuclear export have occurred. Therefore, there will be a sharp lower limit to how quickly a gene can be transcribed and mRNA delivered for translation in the cytosol. As such, the impact of this delay depends on the relative timescales of the processes involved in a network of interest. Quantitative studies on a variety of network architectures containing intron delays of various magnitudes will be necessary to reveal the intron delay’s true impact.
The frequency of transcription initiation determines both the density of RNA polymerase traffic volume and distribution of polymerases on a gene. Due to the polarity and single dimension of template-dependent transcription, transcription may take on characteristics of a single-lane highway. If a fast enzyme cannot pass a slow enzyme, the heterogeneity of polymerase velocities forces one to reconsider the treatment of transcriptional delays (theoretical framework for blocking and boundaries first presented for polymerases in MacDonald et al., 1968). The collective behavior of polymerases along a gene may become sensitive to the slow polymerases present within the population’s velocity distribution. This situation has been modeled to describe traffic jams and chemical phase transitions (Nagatani, 2000a, 2000b). Ultimately, at high traffic volumes jams would be relieved in bursts at frequencies determined by slow leading enzymes amidst faster enzymes. It is unknown whether the concept of traffic jams is relevant to the behavior of polymerase enzymes across long genes. However, a related phenomenon exists for the penetrance of particular fly mutants. Careful genetic analysis of the aforementioned RNA polymerase II slow mutant alleles revealed that only heterozygotes, and not homozygotes, for the slow alleles display the Ubx phenotype (Burke et al., 1996; Mortin and Lefevre, 1981). One possible interpretation is that there is a greater tendency for traffic jams due to the broader distribution of velocities in the heterozygote. The question remains whether the collective behavior of RNA polymerases must be considered when gene length becomes a time delay.
How to Study Intron Delays
Until recently, the inability to track transcription kinetics in individual live cells hindered the quantitative study of elongation kinetics. The approach developed by Robert Singer’s group allows the quantitative study of the relationship between promoter strength and elongation rates, the impact of pause sites, the influence of putative elongation factors, the effect of cotranscriptional RNA processing on elongation velocities, and the time invested in 3′ processing of transcripts (Darzacq et al., 2007). Additional influences include nucleosome displacement, posttranslational modifications of RNA polymerase II’s C-terminal domain, and RNA looping (Buratowski, 2003; Jenuwein and Allis, 2001; Luna et al., 2005). Future studies that combine quantitative in vivo measurement tools with perturbations of transcriptional elongation factors will yield valuable insights into the nature of intron delays. Additionally, future single-molecule measurements made in the context of developmental gene networks should provide great insights into the mechanisms of timing during embryogenesis
Alternatively, the field of synthetic biology allows one to perform reconstruction of a system by introducing modular intron lengths, transcription pause sites, and splice sites into artificial networks. Synthetic biology should allow one to study the impact of elongation kinetics and reveal the potential of introns as contributors to precise timing or capacitors for nonlinear dynamics.
How to Study the Roles of Intron Delays during Development
Drosophila is an ideal organism for studying the intron delays within the context of development because it allows precise staging of developmental activities in conjunction with genetic analysis and comparative genomics. First, the distal transcription start sites identified by Manak et al. represent potential modular time delays. Second, mutant alleles with known phenotypes exist that map to these distal starts. Third, developmental programs are well studied in D. melanogastar and efforts are underway to annotate the genomes of and study the development of other Drosophila species with equivalent precision (Clark et al., 2007; Luengo Hendriks et al., 2006; McGregor et al., 2007; Stark et al., 2007). Fourth, the cell-division times during Drosophila embryogenesis are fast and well characterized, allowing one to determine the augmenting influence of the cell-cycle constraint, as in the example of the kni and knrl genes. Considering the many tools available for studies in Drosophila, it should be possible to contextualize the potential for intron delays within the networks that coordinate fly embryogenesis.
Introns in Context
Edmund Husserl was a philosopher who conceived the conceptual approach of phenomenological reduction, by which one judges something divorced from all context in order to evoke meaning or achieve better understanding (Husserl, 1931). In the preceding commentary, we have attempted to apply this type of reductionism to conceptualize temporal aspects of development and to focus on the attribute of gene length. Outside of time delays, introns have many well-documented functions that have been extensively studied and commented on elsewhere. Additionally, developing embryos have many different mechanisms by which they coordinate the appropriate timing of processes. After reducing transcriptional timing to the attribute of intron lengths, we commented on the potential influence of this metric during development. As intron lengths are a ubiquitous feature of metazoan genes, understanding how timing and the dynamics of developmental networks are organized requires a better understanding of intron delays.
Acknowledgments
We thank D. Landgraff, A.E. McKee, S.J. Swinburne, and M.J. Moore for discussions and critical reading of the manuscript, and the support of grants from the US National Institutes of Health.
References
- Adelman K, La Porta A, Santangelo TJ, Lis JT, Roberts JW, Wang MD. Proc Natl Acad Sci USA. 2002;99:13538–13543. doi: 10.1073/pnas.212358999. [DOI] [PMC free article] [PubMed] [Google Scholar]
- Andrulis ED, Guzman E, Doring P, Werner J, Lis JT. Genes Dev. 2000;14:2635–2649. doi: 10.1101/gad.844200. [DOI] [PMC free article] [PubMed] [Google Scholar]
- Becskei A, Serrano L. Nature. 2000;405:590–593. doi: 10.1038/35014651. [DOI] [PubMed] [Google Scholar]
- Brodsky AS, Meyer CA, Swinburne IA, Hall G, Keenan BJ, Liu XS, Fox EA, Silver PA. Genome Biol. 2005;6:R64. doi: 10.1186/gb-2005-6-8-r64. [DOI] [PMC free article] [PubMed] [Google Scholar]
- Buratowski S. Nat Struct Biol. 2003;10:679–680. doi: 10.1038/nsb0903-679. [DOI] [PubMed] [Google Scholar]
- Burke LP, Jones T, Mortin MA. Biochem Genet. 1996;34:45–59. doi: 10.1007/BF02396239. [DOI] [PubMed] [Google Scholar]
- Castillo-Davis CI, Mekhedov SL, Hartl DL, Koonin EV, Kondrashov FA. Nat Genet. 2002;31:415–418. doi: 10.1038/ng940. [DOI] [PubMed] [Google Scholar]
- Clark AG, Eisen MB, Smith DR, Bergman CM, Oliver B, Markow TA, Kaufman TC, Kellis M, Gelbart W, Iyer VN, et al. Nature. 2007;450:203–218. doi: 10.1038/nature06341. [DOI] [PubMed] [Google Scholar]
- Cooper KL, Armstrong J, Moens CB. Dev Dyn. 2005;234:651–658. doi: 10.1002/dvdy.20584. [DOI] [PMC free article] [PubMed] [Google Scholar]
- Coulter DE, Greenleaf AL. J Biol Chem. 1985;260:13190–13198. [PubMed] [Google Scholar]
- Darzacq X, Shav-Tal Y, de Turris V, Brody Y, Shenoy SM, Phair RD, Singer RH. Nat Struct Mol Biol. 2007;14:796–806. doi: 10.1038/nsmb1280. [DOI] [PMC free article] [PubMed] [Google Scholar]
- Davenport RJ, Wuite GJ, Landick R, Bustamante C. Science. 2000;287:2497–2500. doi: 10.1126/science.287.5462.2497. [DOI] [PubMed] [Google Scholar]
- De Renzis S, Elemento O, Tavazoie S, Wieschaus EF. PLoS Biol. 2007;5:e117. doi: 10.1371/journal.pbio.0050117. [DOI] [PMC free article] [PubMed] [Google Scholar]
- Denoeud F, Kapranov P, Ucla C, Frankish A, Castelo R, Drenkow J, Lagarde J, Alioto T, Manzano C, Chrast J, et al. Genome Res. 2007;17:746–759. doi: 10.1101/gr.5660607. [DOI] [PMC free article] [PubMed] [Google Scholar]
- Dublanche Y, Michalodimitrakis K, Kummerer N, Foglierini M, Serrano L. Mol Syst Biol. 2006;2:41. doi: 10.1038/msb4100081. [DOI] [PMC free article] [PubMed] [Google Scholar]
- Femino AM, Fay FS, Fogarty K, Singer RH. Science. 1998;280:585–590. doi: 10.1126/science.280.5363.585. [DOI] [PubMed] [Google Scholar]
- Giudicelli F, Ozbudak EM, Wright GJ, Lewis J. PLoS Biol. 2007;5:e150. doi: 10.1371/journal.pbio.0050150. [DOI] [PMC free article] [PubMed] [Google Scholar]
- Goodwin BC. Adv Enzyme Regul. 1965;3:425–438. doi: 10.1016/0065-2571(65)90067-1. [DOI] [PubMed] [Google Scholar]
- Greenleaf AL, Borsett LM, Jiamachello PF, Coulter DE. Cell. 1979;18:613–622. doi: 10.1016/0092-8674(79)90116-8. [DOI] [PubMed] [Google Scholar]
- Griffin KJ, Stoller J, Gibson M, Chen S, Yelon D, Stainier DY, Kimelman D. Dev Biol. 2000;218:235–247. doi: 10.1006/dbio.1999.9571. [DOI] [PubMed] [Google Scholar]
- Gromak N, West S, Proudfoot NJ. Mol Cell Biol. 2006;26:3986–3996. doi: 10.1128/MCB.26.10.3986-3996.2006. [DOI] [PMC free article] [PubMed] [Google Scholar]
- Gubb D. Dev Genet. 1986;7:119–131. [Google Scholar]
- Guo S, Wilson SW, Cooke S, Chitnis AB, Driever W, Rosenthal A. Dev Biol. 1999;208:473–487. doi: 10.1006/dbio.1999.9204. [DOI] [PubMed] [Google Scholar]
- Guo S, Yamaguchi Y, Schilbach S, Wada T, Lee J, Goddard A, French D, Handa H, Rosenthal A. Nature. 2000;408:366–369. doi: 10.1038/35042590. [DOI] [PubMed] [Google Scholar]
- Hasty J, McMillen D, Isaacs F, Collins JJ. Nat Rev Genet. 2001;2:268–279. doi: 10.1038/35066056. [DOI] [PubMed] [Google Scholar]
- Herbert KM, La Porta A, Wong BJ, Mooney RA, Neuman KC, Landick R, Block SM. Cell. 2006;125:1083–1094. doi: 10.1016/j.cell.2006.04.032. [DOI] [PMC free article] [PubMed] [Google Scholar]
- Hong X, Scofield DG, Lynch M. Mol Biol Evol. 2006;23:2392–2404. doi: 10.1093/molbev/msl111. [DOI] [PubMed] [Google Scholar]
- Husserl E. Ideas: General Introduction to Pure Phenomenology. London: G. Allen & Unwin; 1931. [Google Scholar]
- Jenuwein T, Allis CD. Science. 2001;293:1074–1080. doi: 10.1126/science.1063127. [DOI] [PubMed] [Google Scholar]
- Keegan BR, Feldman JL, Lee DH, Koos DS, Ho RK, Stainier DY, Yelon D. Development. 2002;129:1623–1632. doi: 10.1242/dev.129.7.1623. [DOI] [PubMed] [Google Scholar]
- Korbel JO, Urban AE, Affourtit JP, Godwin B, Grubert F, Simons JF, Kim PM, Palejev D, Carriero NJ, Du L, et al. Science. 2007;318:420–426. doi: 10.1126/science.1149504. [DOI] [PMC free article] [PubMed] [Google Scholar]
- Landick R. Biochem Soc Trans. 2006;34:1062–1066. doi: 10.1042/BST0341062. [DOI] [PubMed] [Google Scholar]
- Lee TI, Rinaldi NJ, Robert F, Odom DT, Bar-Joseph Z, Gerber GK, Hannett NM, Harbison CT, Thompson CM, Simon I, et al. Science. 2002;298:799–804. doi: 10.1126/science.1075090. [DOI] [PubMed] [Google Scholar]
- Lewis J. Curr Biol. 2003;13:1398–1408. doi: 10.1016/s0960-9822(03)00534-7. [DOI] [PubMed] [Google Scholar]
- Luengo Hendriks CL, Keranen SV, Fowlkes CC, Simirenko L, Weber GH, DePace AH, Henriquez C, Kaszuba DW, Hamann B, Eisen MB, et al. Genome Biol. 2006;7:R123. doi: 10.1186/gb-2006-7-12-r123. [DOI] [PMC free article] [PubMed] [Google Scholar]
- Luna R, Jimeno S, Marin M, Huertas P, Garcia-Rubio M, Aguilera A. Mol Cell. 2005;18:711–722. doi: 10.1016/j.molcel.2005.05.001. [DOI] [PubMed] [Google Scholar]
- Lynch M, Conery JS. Science. 2003;302:1401–1404. doi: 10.1126/science.1089370. [DOI] [PubMed] [Google Scholar]
- MacDonald CT, Gibbs JH, Pipkin AC. Biopolymers. 1968;6:1–5. doi: 10.1002/bip.1968.360060102. [DOI] [PubMed] [Google Scholar]
- Mahaffy JM, Pao CV. J Math Biol. 1984;20:39–57. doi: 10.1007/BF00275860. [DOI] [PubMed] [Google Scholar]
- Manak JR, Dike S, Sementchenko V, Kapranov P, Biemar F, Long J, Cheng J, Bell I, Ghosh S, Piccolboni A, et al. Nat Genet. 2006;38:1151–1158. doi: 10.1038/ng1875. [DOI] [PubMed] [Google Scholar]
- McGregor AP, Orgogozo V, Delon I, Zanet J, Srinivasan DG, Payre F, Stern DL. Nature. 2007;448:587–590. doi: 10.1038/nature05988. [DOI] [PubMed] [Google Scholar]
- Mogilner A, Wollman R, Marshall WF. Dev Cell. 2006;11:279–287. doi: 10.1016/j.devcel.2006.08.004. [DOI] [PubMed] [Google Scholar]
- Monk NA. Curr Biol. 2003;13:1409–1413. doi: 10.1016/s0960-9822(03)00494-9. [DOI] [PubMed] [Google Scholar]
- Mortin MA, Lefevre G., Jr Chromosoma. 1981;82:237–247. doi: 10.1007/BF00286108. [DOI] [PubMed] [Google Scholar]
- Muse GW, Gilchrist DA, Nechaev S, Shah R, Parker JS, Grissom SF, Zeitlinger J, Adelman K. Nat Genet. 2007;39:1507–1511. doi: 10.1038/ng.2007.21. [DOI] [PMC free article] [PubMed] [Google Scholar]
- Nagatani T. Phys Rev E Stat Phys Plasmas Fluids Relat Interdiscip Topics. 2000a;61:3564–3570. doi: 10.1103/physreve.61.3564. [DOI] [PubMed] [Google Scholar]
- Nagatani T. Phys Rev E Stat Phys Plasmas Fluids Relat Interdiscip Topics. 2000b;61:3534–3540. doi: 10.1103/physreve.61.3534. [DOI] [PubMed] [Google Scholar]
- Neuman KC, Abbondanzieri EA, Landick R, Gelles J, Block SM. Cell. 2003;115:437–447. doi: 10.1016/s0092-8674(03)00845-6. [DOI] [PubMed] [Google Scholar]
- O’Brien T, Lis JT. Mol Cell Biol. 1993;13:3456–3463. doi: 10.1128/mcb.13.6.3456. [DOI] [PMC free article] [PubMed] [Google Scholar]
- Plant KE, Dye MJ, Lafaille C, Proudfoot NJ. Mol Cell Biol. 2005;25:3276–3285. doi: 10.1128/MCB.25.8.3276-3285.2005. [DOI] [PMC free article] [PubMed] [Google Scholar]
- Redon R, Ishikawa S, Fitch KR, Feuk L, Perry GH, Andrews TD, Fiegler H, Shapero MH, Carson AR, Chen W, et al. Nature. 2006;444:444–454. doi: 10.1038/nature05329. [DOI] [PMC free article] [PubMed] [Google Scholar]
- Rosenfeld N, Elowitz MB, Alon U. J Mol Biol. 2002;323:785–793. doi: 10.1016/s0022-2836(02)00994-4. [DOI] [PubMed] [Google Scholar]
- Rothe M, Pehl M, Taubert H, Jackle H. Nature. 1992;359:156–159. doi: 10.1038/359156a0. [DOI] [PubMed] [Google Scholar]
- Roy SW, Gilbert W. Nat Rev Genet. 2006;7:211–221. doi: 10.1038/nrg1807. [DOI] [PubMed] [Google Scholar]
- Sehgal PB, Derman E, Molloy GR, Tamm I, Darnell JE. Science. 1976;194:431–433. doi: 10.1126/science.982026. [DOI] [PubMed] [Google Scholar]
- Shermoen AW, O’Farrell PH. Cell. 1991;67:303–310. doi: 10.1016/0092-8674(91)90182-x. [DOI] [PMC free article] [PubMed] [Google Scholar]
- Smith KK. Int J Dev Biol. 2003;47:613–621. [PubMed] [Google Scholar]
- Spencer CA, Kruhlak MJ, Jenkins HL, Sun X, Bazett-Jones DP. J Cell Biol. 2000;150:13–26. doi: 10.1083/jcb.150.1.13. [DOI] [PMC free article] [PubMed] [Google Scholar]
- Stainier DY, Fouquet B, Chen JN, Warren KS, Weinstein BM, Meiler SE, Mohideen MA, Neuhauss SC, Solnica-Krezel L, Schier AF, et al. Development. 1996;123:285–292. doi: 10.1242/dev.123.1.285. [DOI] [PubMed] [Google Scholar]
- Stark A, Lin MF, Kheradpour P, Pedersen JS, Parts L, Carlson JW, Crosby MA, Rasmussen MD, Roy S, Deoras AN, et al. Nature. 2007;450:219–232. doi: 10.1038/nature06340. [DOI] [PMC free article] [PubMed] [Google Scholar]
- Swinburne IA, Meyer CA, Liu XS, Silver PA, Brodsky AS. Genome Res. 2006;16:912–921. doi: 10.1101/gr.5211806. [DOI] [PMC free article] [PubMed] [Google Scholar]
- Taylor JH. Ann N Y Acad Sci. 1960;90:409–421. doi: 10.1111/j.1749-6632.1960.tb23259.x. [DOI] [PubMed] [Google Scholar]
- Tennyson CN, Klamut HJ, Worton RG. Nat Genet. 1995;9:184–190. doi: 10.1038/ng0295-184. [DOI] [PubMed] [Google Scholar]
- Thummel CS. Science. 1992;255:39–40. doi: 10.1126/science.1553530. [DOI] [PubMed] [Google Scholar]
- Tuzun E, Sharp AJ, Bailey JA, Kaul R, Morrison VA, Pertz LM, Haugen E, Hayden H, Albertson D, Pinkel D, et al. Nat Genet. 2005;37:727–732. doi: 10.1038/ng1562. [DOI] [PubMed] [Google Scholar]
- Ujvari A, Luse DS. J Biol Chem. 2004;279:49773–49779. doi: 10.1074/jbc.M409087200. [DOI] [PubMed] [Google Scholar]
- Venter JC, Adams MD, Myers EW, Li PW, Mural RJ, Sutton GG, Smith HO, Yandell M, Evans CA, Holt RA, et al. Science. 2001;291:1304–1351. doi: 10.1126/science.1058040. [DOI] [PubMed] [Google Scholar]
- Voelker RA, Wisely GB, Huang SM, Gyurkovics H. Mol Genet Genomics. 1985;201:437–445. [Google Scholar]
- Watson JD. Molecular Biology of the Gene. 2. Menlo Park, CA: Benjamin; 1970. [Google Scholar]
- Yandell M, Mungall CJ, Smith C, Prochnik S, Kaminker J, Hartzell G, Lewis S, Rubin GM. PLoS Comput Biol. 2006;2:e15. doi: 10.1371/journal.pcbi.0020015. [DOI] [PMC free article] [PubMed] [Google Scholar]
- Zeitlinger J, Stark A, Kellis M, Hong JW, Nechaev S, Adelman K, Levine M, Young RA. Nat Genet. 2007;39:1512–1516. doi: 10.1038/ng.2007.26. [DOI] [PMC free article] [PubMed] [Google Scholar]