Abstract
Introduction
The goal of this study was to examine the effect of AC currents on a cardiac fiber. The study is the second in a series of two articles devoted to the subject. The initial study demonstrated that low-strength sinusoidal currents can cause hemodynamic collapse without inducing ventricular fibrillation. The present modeling study examines possible electrophysiologic mechanisms leading to such hemodynamic collapse.
Methods and Results
A strand of cardiac myocytes was subjected to an extracellular sinusoidal current stimulus. The stimulus was located 100 μm over one end. Membrane dynamics were described by the Luo-Rudy dynamic model. Examination of the interspike intervals (ISI) revealed that they were dependent on the phase of the stimulus and, as a result, tended to take on discrete values. The frequency dependency of the current threshold to induce an action potential in the cable had a minimum, as has been found experimentally. When a sinus beat was added to the cable, the sinus beat dominated at low-stimulus currents, whereas at high currents the time between action potentials corresponded to the rate observed in a cable without the sinus beat. In between there was a transition region with a wide dispersion of ISIs.
Conclusion
The following phenomena observed in the initial study were reproduced and explained by the present simulation study: insignificant effect of temporal summation of subthreshold stimuli, frequency dependency of the extrasystole threshold, discrete nature of the ISI, and increase in regularity of the ISI with increasing stimulus strength.
Keywords: sinusoidal stimulation, cardiac fiber, interspike interval
Introduction
This study is the second in a series of two articles devoted to the examination of the effect of AC currents on the heart. The first article by Malkin and Hoffmeister1 demonstrated that low-strength sinusoidal leakage currents can cause hemodynamic collapse of the heart without inducing ventricular fibrillation. These results are an extension of a recent observation that 60-Hz sinusoidal leakage currents below accepted safety thresholds result in hemodynamic collapse in humans,2 raising questions regarding the current safety standards for medical devices. The article by Malkin and Hoffmeister1 also focused on investigating the mechanisms by which hemodynamic collapse is induced. Although some of the underlying mechanisms were unraveled with the experimental protocol used in the study, several questions remained unanswered.
The goal of the present study was to examine the effect of AC currents in cardiac cells using the tools of modeling and simulation that can trace the causality of large-scale behavior to membrane-based mechanisms. The aim here was to first investigate the intrinsic response of cardiac tissue to AC stimulation and thus enrich our basic knowledge of cardiac electrophysiology. Although the effects of sinusoidal stimulation on nerves has been investigated in detail,3,4 research on the mechanisms of AC stimulation of the cardiac tissue is largely anecdotal.5–10 Another aim of this study was to attempt to mimic the experimental conditions in the accompanying article1 so that the modeling results can provide further explanation of the mechanisms involved in the induction of hemodynamic collapse of the heart by low-strength sinusoidal currents. By using modeling tools to address the questions posed initially,1 we underscore the complementary nature of experiment and simulation.
Methods
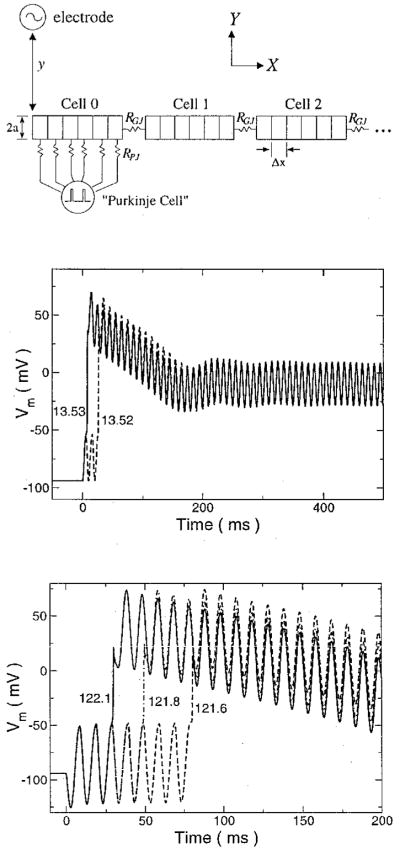
The simulations considered a cardiac fiber composed of abutting myocytes that started at the origin and ran along the x-axis (Fig. 1, top). The choice of model fell to the cardiac fiber because it allowed for spatial effects and was much less computationally demanding than two- or three-dimensional tissue preparations, an important consideration for the very long times (5 sec) that must be simulated to mimic the experimental protocol.1 The fiber was placed in a large conducting medium. A unipolar extracellular stimulating electrode, placed over the origin of the fiber at a distance y along the y-axis, produced an extracellular potential, φe, that was a function of distance along the fiber x and time t (Equation 1):
| (1) |
where I0 is the strength of the applied AC current; f is its frequency in hertz; and σe is the extracellular conductivity. A stimulating electrode in the volume conductor was chosen because the fibers on the endocardium are adjacent to the large conducting blood volume.
Figure 1.
(Top) Schematic diagram of cable showing the chain of myocytes of radius a, each discretized into segments Δx long, and connected to its neighbors by gap junctions of resistance RGJ. The stimulating electrode is placed above the end of the cable at a distance y. For simulations involving a sinus rhythm, a “Purkinje” cell is modeled as periodic voltage spike that is connected to the cell under the electrode by fixed resistances RPJ. (Middle) Transmembrane voltage responses of a membrane patch stimulated by sinusoidal extracellular currents. Source strengths are indicated in μA/cm2. The 100-Hz stimulus was applied at time zero. (Bottom) Gildemeister effect in a cable subject to a 100-Hz extracellular current source for various source strengths (μA). The transmembrane voltage of the cable segment directly under the stimulating electrode is shown. The stimulus was applied at time zero.
The intracellular potential φi, induced as a result of the extracellular stimulation, was described by the reaction-diffusion equation11 (Equation 2):
| (2) |
where σi is the intracellular resistivity; β is the ratio of the membrane surface to cell volume; Cm is the membrane capacitance per membrane area (1 μF/cm2); Vm is the transmembrane voltage, which is defined as the difference between intracellular and extracellular potentials (φi − φe); and iion is the ionic transmembrane current, which is described by the Luo-Rudy dynamic equations12 with an electroporation conductance13 added to properly model the high voltages that develop under the electrode. The electroporation conductance was adjusted to activate when the transmembrane voltage exceeded 300 mV, as was found experimentally.14 Each cell was discretized into 11 segments, and cells were coupled to each other through gap junctions whose resistance is denoted by RGJ. After discretization in time and space, Equation 2 was rewritten in a form to solve for φi semiimplicitly.
To determine the contribution of intrinsic membrane properties to any of the observed phenomena, the response of a membrane patch to sinusoidal extracellular stimulation also was simulated. In the model, this was equivalent to ignoring the spatial effects in Equation 2, i.e., setting the left-hand side to zero.
In accordance with the goal of this study to provide further mechanistic explanation of the phenomena observed in the initial study,1 it was necessary to introduce a sinus beat so that the model will be able to describe more accurately the interaction of the AC stimulus with the tissue. To account for this, “Purkinje” cell input was added to the model. This was represented as a 2-msec long, 100-mV voltage pulse delivered every 500 msec. The “Purkinje” cell was connected to every segment of the cell under the electrode through resistances RPJ. The value of these resistances, 24 MΩ, was chosen to deliver a current 20% above threshold when the fiber was at rest.
The nominal conditions for the fiber simulation were a radius a of 7 μm, intracellular conductivityσi of 10 mS/cm, and gap junctional resistance RGJ of 10 MΩ. The extracellular stimulating electrode was located 100 μm from the origin of the fiber. Cells were 100 μm long, resulting in a spatial discretization of 9.09 μm. The extracellular conductivity σe was 10 mS/cm. Because cells were assumed to be cylindrically shaped, the surface-to-volume ratio of the cell (β) was equal to 2/a. A constant time step of 15 μsec was used.
Results
Patch Stimulation
To determine the role of intrinsic membrane properties during AC stimulation, a simulation of a membrane patch subject to an extracellular sinusoidal current stimulus was performed. The results are shown in Figure 1, middle panel. If the stimulus current was below threshold, there was an oscillation in Vm about the resting level. If threshold was surpassed, the patch fired, and the voltage climbed to a peak and then fell to oscillate about the plateau level. The membrane potential did not drop from this plateau level for as long as the stimulus was applied. Unlike the experimental results,1 no further firings were observed.
At the firing threshold, the membrane voltage oscillated with the stimulus and then fired on the third oscillation. With an increase of < 1% in the stimulus strength, the membrane patch fired on the first oscillation. Thus, only in a very narrow current range did the patch not fire on the first positive phase of the stimulus and fire on a later cycle. Furthermore, the patch was only observed to fire after 1, 2, or 3 oscillations, even when attempts were made to finely alter the stimulus strength by making adjustments in the eighth decimal place.
Cable Stimulation: Overall Behavior
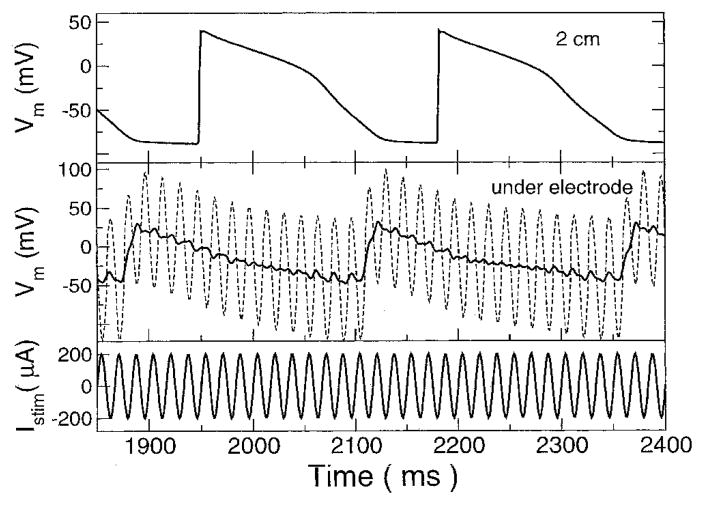
The response of the fiber to extracellular sinusoidal stimulation was much different than that of the membrane patch. Under the electrode, the peak transmembrane voltage increased with each successive stimulus oscillation (Fig. 1, bottom), although the increase was less with each oscillation and barely discernible after the second oscillation. This phenomenon of increasing voltage with stimulus oscillation is referred to as the Gildemeister effect.15 The window in the current strength over which the cell under the electrode did not fire on the first oscillation of the stimulus was quite small. Depending on the stimulus frequency, the minimum current to cause the cell to fire could do so on the 20th oscillation. Generally, higher-frequency stimuli were capable of causing firing after a greater number of stimulus cycles. Slightly increasing the current reduced the number of oscillations before firing. Furthermore, the voltage under the electrode did not remain elevated at the plateau level, as observed in the membrane patch simulations, but decreased to briefly oscillate about the resting level before firing again (Fig. 2, middle).
Figure 2.
A 60-Hz stimulating current and transmembrane voltages. (Top) Transmembrane voltage (Vm) at the far end of the cable, 2 cm away from electrode. (Middle) Transmembrane voltage under the electrode before filtering (dashed line) and after (solid line). See text for details. (Bottom) Stimulating current.
At a given moment in time, the polarity and magnitude of the transmembrane voltage induced by the extracellular current stimulus varied with position along the fiber in a manner similar to that found in simulations of nerve cells.16 Beneath the electrode, the induced voltage was greatest and of opposite polarity to the stimulus. This is observed in Figure 1, bottom panel, where the initial membrane response is hyperpolarization although the current is positive, i.e., the electrode is acting as an anode. The region of a cell with the highest transmembrane voltage amplitude was the cell end closest to the electrode. This reversed polarity was only observed in the first two cells. The magnitude of the transmembrane voltage decreased with distance from the origin, fell to zero in the second cell where the voltage polarity reversed, increased again to peak in the second cell, and then fell off more slowly with distance. For cells with induced voltages of the same polarity as the electrode, the end of the cell farthest away from the stimulus had a slightly greater magnitude than the nearer end.
Figure 2 shows the response of two sites along the fiber to a current that is slightly more than twice threshold. Under the electrode, Vm was dominated by the field of the stimulus and appeared as a sine wave whose baseline was modulated by an underlying action potential. By filtering Vm to eliminate the stimulating frequency and its harmonics with 2-Hz wide-notch filters, the underlying action potential could be discerned. Filtering was performed by applying a discrete Fourier transform on the signal, zeroing the real and imaginary components of the appropriate frequency band, and then performing the inverse discrete Fourier transform. Moving away from the electrode, the field effect decreased and the action potential became more prominent as the sinusoidal “ripples” superimposed on top of the action potential diminished. At the far end of the fiber, no field effects were discernible and the action potential propagated at a speed of approximately 0.26 m/sec.
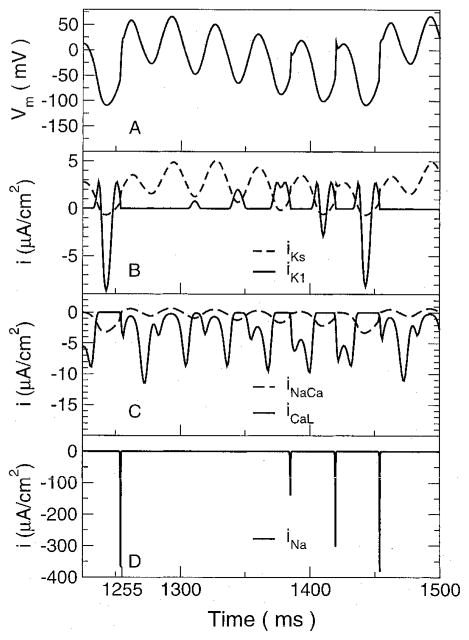
To understand the frequency of elicited action potentials, we must analyze the cell under the electrode, because it was this cell that determined whether or not an action potential would be elicited. The ionic currents under the electrode responsible for determining the course of the action potential there are shown in Figure 3 for a 30-Hz, 150-μA stimulus. Only the major currents are displayed for just over one action potential period. As previously described, the voltage under the electrode appears as a sine wave whose baseline follows an action potential. At 1,255 msec, the cell fires, as indicated by the rapid shift in Vm and a corresponding large sodium current. The slow inward K+ current iKs oscillated in phase with Vm. Its baseline increased during the initial portion of the action potential, then decreased as the baseline of the transmembrane voltage decreased, and was an inward current during the most negative portions of Vm.
Figure 3.
Transmembrane voltage and major currents in the cell directly under the electrode. (A) Transmembrane voltage. The cell fires an action potential at approximately 1,255 ms. (B) Potassium currents iKs and iK1. (C) Currents through the L-type calcium channel (iCaL) and the sodium/calcium exchanger (iNaCa). (D) Sodium current.
The behavior of the inward rectifier K+ current iK1 was very different. Because this is a rectifying current at large positive voltages but not large negative voltages, it served to initially decrease Vm at the beginning of the action potential and then later to increase it. During the initial portion of the action potential after the upstroke, iK1 was very small because the transmembrane voltage was highly elevated over the entire stimulus cycle. As the voltage baseline decreased, the iK1 current appeared as a very small positive-going bump that was out of phase with Vm. With each sinusoidal cycle, it grew in magnitude, as a result of the drop in Vm in which it played a role. As Vm dropped further, iK1 grew in magnitude until Vm dropped below the K+ Nernst potential. This was observed at 1,408 msec, where iK1 developed a downward deflection that eventually was much larger than the positive peaks. At this point, the net result of iK1 was to increase Vm and counteract the hyperpolarizing effect of the stimulus. It is the reversal of iK1 that leads to an increasing Na+ current.
The Na+ current was very small after the start of the action potential at 1,255 msec but started to grow larger as Vm returned to oscillating about the resting level. It grew in magnitude with each cycle (Fig. 3, bottom) until it was large enough to cause another action potential to fire. The L-type Ca2+ current is a rectifying current, allowing only inward current. During each positive phase of Vm, the current had a double-negative peaked appearance. The rise between the negative peaks was due to Vm approaching the Nernst potential for the channel that caused the current to decrease in magnitude. Although the number of peaks during each stimulus cycle varied as well as the relative magnitude of the peaks, the maximum L-type Ca2+ current during each stimulus cycle was fairly constant over the course of the entire action potential.
Interspike Interval and Action Potential Duration
The intervals between successive action potentials, denoted as the interspike interval (ISI), and the action potential duration (APD) were analyzed to determine if there was a relationship between them and the stimulus period. Different criteria had to be applied at the two ends of the fiber to determine when an action potential occurred due to the different effect of the stimulus at each end. Because the stimulus dominated the voltage under the electrode, Vm at that location was filtered as described earlier, and the start of an action potential was determined when a voltage threshold was crossed at a minimum rate of change. Choosing a voltage threshold of 0 mV and a rate of change of 5 mV/msec allowed action potentials to be detected reliably. At the far end of the fiber, the stimulus was not observable in Vm and the action potential start was determined by the maximum rate of change in Vm during the upstroke. ISIs were taken as the time between successive action potentials, and the APD was measured as the time from the action potential start until the cell returned to rest. Again, different criteria were used for each end because of the differing nature of the transmembrane voltages. Under the electrode, the membrane was considered returned to rest when the filtered Vm dropped below −50 mV; at the far end, the resting level was chosen to be −70 mV.
Histograms of the ISIs and APDs are shown in Figure 4 for points under the electrode and at the far end of the fiber away from the electrode. Both APD and ISI, at both ends of the fiber, showed a tendency to occur at discrete values that were separated by multiples of the stimulus period. For the ISIs, the intervals under the electrode and those at the far end were very similar. In both cases, intervals were predominantly centered around four stimulus periods, with smaller occurrences of five and six stimulus periods. Because action potentials were initiated under the electrode and propagated to the far end, the intervals would be expected to match very closely. Differences in propagation between successive action potentials were one source of discrepancy between the intervals measured under the electrode and those measured away from the electrode. Also, there was still a small ripple in Vm even after filtering, which made determining timings based on voltage levels difficult.
Figure 4.
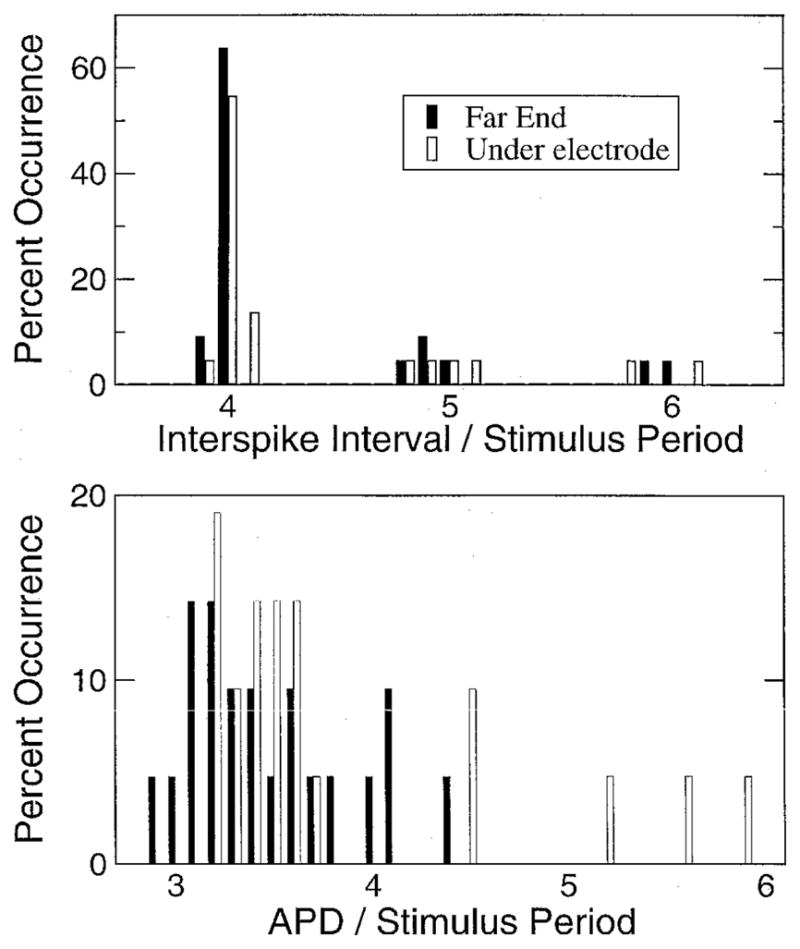
Histograms of interspike interval (ISI) and action potential duration (APD) for 20-Hz stimulus from the cell under the electrode and the cell at the opposite end of the cable. The percentage of occurrences are normalized with respect to the number of events at each location. (Top) Histogram of normalized ISIs. (Bottom) Histogram of normalized action potential durations.
The APDs under the electrode and away from the electrode were not as well clustered as the ISIs. Under the electrode, the APD mostly fell somewhere between three and four stimulus periods. Thus, the APD was one or fewer stimulus periods less than the ISI, as one would expect because the cell can only fire after it has returned to rest. At the far end, the APDs were much more dispersed than under the electrode. They were bunched around three stimulus periods but did not show a prominent duration. The APD away from the electrode was not directly under the influence of the stimulating electrode. Thus, APDs were not the same as those measured under the electrode. At the far end, Ca2+-induced Ca2+ release was a major factor in determining APD and resulted in the wider distribution of APDs.
Activation Threshold
The minimum current needed to elicit an action potential was determined for the fiber as a function of frequency (Fig. 5, top, solid line). The shape of the threshold curve was consistent with the findings in the nerve.4 The parameters of the fiber model were altered to determine whether they affected activation threshold (Fig. 5, top). The threshold curve for all conditions had the same shape. There was a minimum in the curves in the range from 5 to 10 Hz, and the threshold at 1,000 Hz was much higher than the threshold at 1 Hz. Altering gap junctional resistance or fiber radius had small effects on the curve, especially at low frequencies. Increasing intracellular resistance by a factor of two had the smallest effect, being hardly distinguishable from the nominal case.
Figure 5.
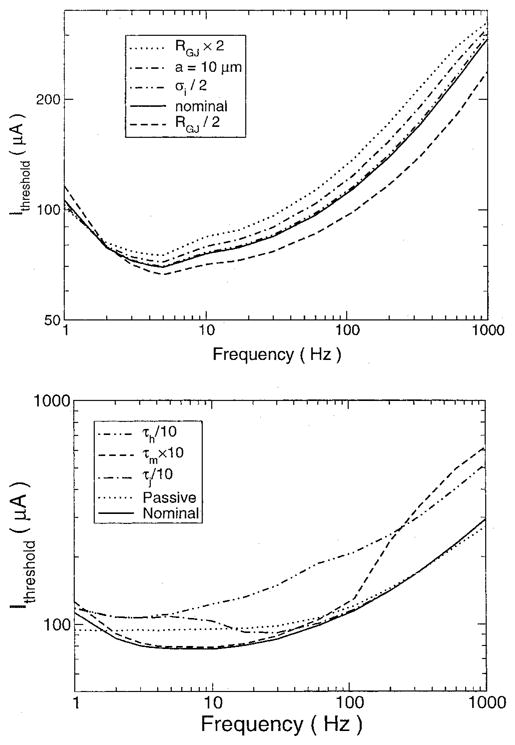
Firing threshold curves. (Top) Threshold current for action potential firing as a function of frequency for various values of model parameters. The nominal case was a cable with a radius of 7 μm, gap junctional resistances (RGJ) of 10 MΩ, and intracellular conductivity (σi) of 10 mS/cm. (Bottom) Effect of sodium channel manipulation on current threshold. The threshold to fire is plotted for conditions under which the m gate kinetics were decreased by 10 (τm × 10), the h gate kinetics were increased by 10 (τh/10), the j gate kinetics were increased by a factor of 10 (τj × 10), and a passive cable was used. See text for details.
To determine which ionic mechanisms were responsible for this frequency dependence of the threshold, the ionic currents were modified in several ways (Fig. 5, bottom). First, the active membrane was replaced with a passive one whose membrane resistance matched that of the active fiber at rest. The threshold was determined by examining the induced voltage in the cell under the electrode, where voltages were the greatest, to see if it reached the level needed for the active cell to fire, approximately −50 mV. For high frequencies, the current threshold was the same as for the nominal case with an active membrane. Thus, the passive membrane properties can account for the high-frequency behavior observed. For low frequencies, there was no frequency dependency and the current threshold was constant; there was no nadir in the graph.
Because activation is controlled by the sodium channel, the kinetics of the sodium channel gating variables were altered to determine how each impacted the threshold. The sodium channel is described by a product of three gating variables: m, h, and j. The m gate describes activation, being closed at rest and quickly opening when the membrane is depolarized. The h gate describes inactivation, being open at rest but closing during depolarization. The j gate models the slow inactivation of the channel, acting like the h gate but with a slower time constant. The sodium channel, therefore, conducts during the brief period when the m gate opens but before the h gate closes.
Increasing the m gate time constant to slow the m gate only affected the firing threshold for higher frequencies. The graph was unaffected for lower frequencies. At the higher frequencies, the channel could not open quickly enough before the stimulus changed phase, necessitating a larger current stimulus to get the cell to fire. Increasing the kinetics of the j gate only affected the curve at lower middle frequencies by causing an increase in the threshold current. At 1 Hz, the threshold was unaffected as it was for frequencies higher than 33 Hz. Increasing the kinetics of the h gate affected the entire threshold curve, with the higher frequencies affected more than the lower ones. By increasing the dynamics of the h gate, the channel inactivated sooner, reducing the channel current and preventing the fiber from firing. Thus, our simulation concluded that the j gate is not very important in determining the frequency dependence of the threshold, and it is the difference in kinetics of the h and m gates that is most important.
Stimulus Strength-Rate Relationship
The effect of stimulus current strength on ISI was investigated at the far end of the cable for three different stimulating frequencies: 15, 30, and 60 Hz. The ISI was measured during a 6-second stimulus for several stimulus strengths, starting from approximately 20% more than threshold to 15× threshold. The results were the same for all three frequencies (Fig. 6). Contrary to what might be expected, the average ISI increased with current strength. The ISI was not constant, and a standard deviation was measured that also increased with increasing stimulus current.
Figure 6.
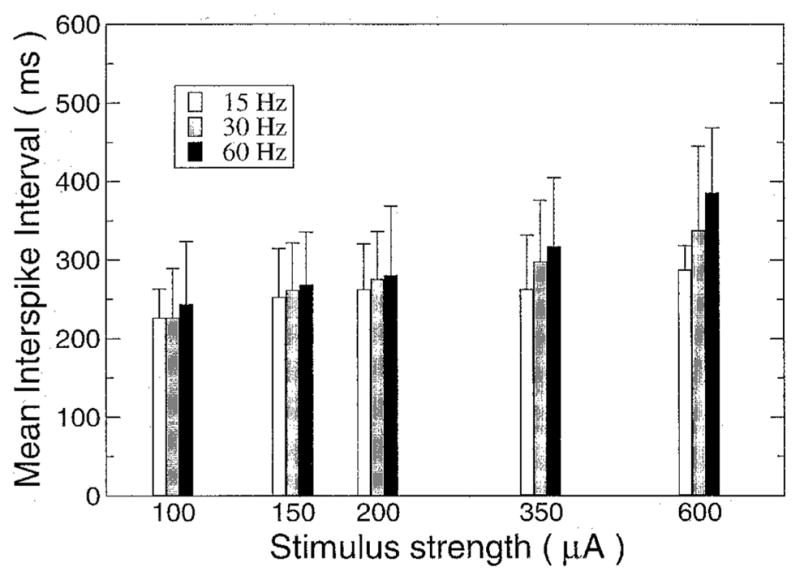
Average interspike interval as a function of current strength for various stimulation frequencies measured at the far end of the electrode. Error bars indicate standard deviation.
Cable with a Sinus Beat
To better mimic the effect of the AC stimulus in vivo and thus more faithfully represent the experimental protocol,1 a sinus beat was added to the fiber. The rate dependency on current strength was very different under these conditions than under the nonpaced conditions. The ISIs measured in the last cell of the fiber are shown in Figure 7 for various stimulation frequencies and currents. For low-current strengths, the predominant period was that of the sinus beat, 500 msec, with the stimulus occasionally inducing an action potential between the sinus beats. As the stimulus current was increased, more action potentials were produced by the stimulus current, disrupting the sinus rhythm more and increasing the percentage of shorter ISIs. The ISIs tended to shift from the sinus beat to the rate observed when the fiber was stimulated without a sinus beat. The shift in period was more gradual for the higher than the lower frequency stimuli. Altering the value of RPJ changed very little in the simulation results. Decreasing RPJ required that a slightly higher stimulating current had to be applied for the same effect.
Figure 7.
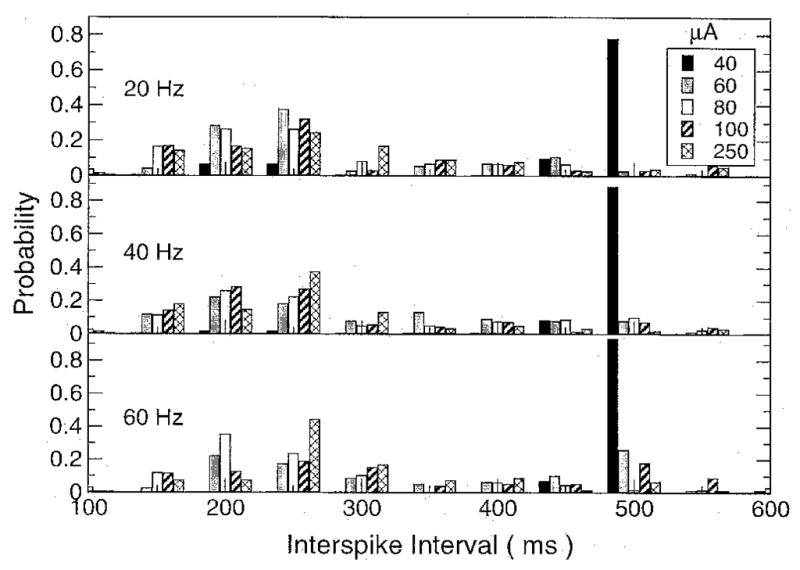
Histogram of the interspike interval (ISI) for three different stimulating frequencies (20, 40, and 60 Hz) and five different stimulating currents (40, 60, 80, 100, and 250 μA). The ISIs are grouped into 50-ms bins and normalized by the total number of action potential durations to express the counts as probabilities.
Extrasystole Threshold
The minimum sinusoidal current strength needed to produce an extrasystole is plotted in Figure 8. This curve was determined by looking for action potentials that did not coincide with the “Purkinje” input during 5 seconds of extracellular current stimulation. For comparison, the threshold current to produce an action potential in a fiber without the sinus pacing also is shown. Over the frequency range from 3 to 100 Hz, the threshold for eliciting an extrasystole was lower than the firing threshold in an un-paced fiber by almost a factor of two. At 100 Hz, the threshold abruptly increased and the trend reversed. For frequencies > 100 Hz, the extrasystole threshold was twice as high as the firing threshold. The nadir in the extrasystole threshold curve occurred at approximately 30 Hz, which is a higher frequency than the one at which the nadir occurred in the firing threshold curve. The extrasystole threshold curve nadir frequency and the overall behavior of the extrasystole threshold are consistent with the finding1 regarding the effect threshold. In other words, in order to understand the frequency dependence of the tissue to AC stimulation, the interaction with a sinus beat needs to be considered.
Figure 8.
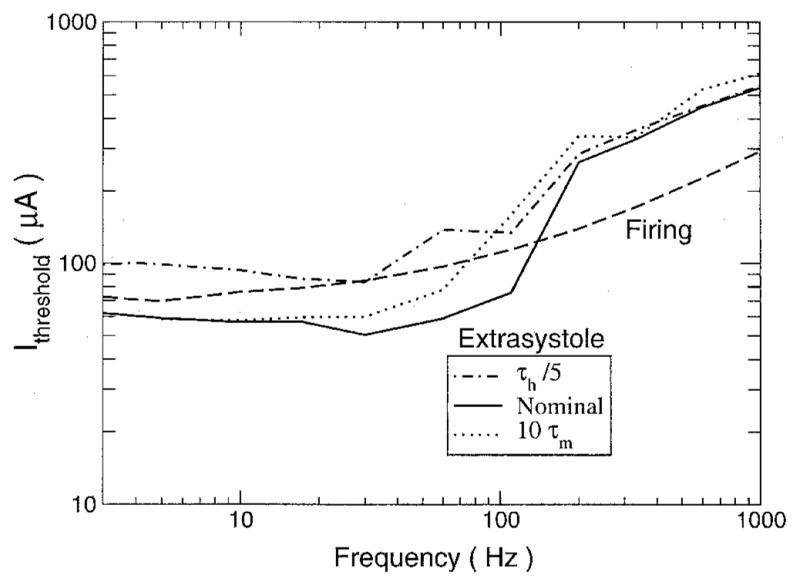
Threshold current needed to produce an extrasystole during sinus rhythm. The minimum stimulus current required to produce an action potential that was not the direct result of Purkinje input during 10 seconds of sinusoidal stimulation is plotted as a function of the sinusoidal stimulus frequency for the cases of the nominal model (Nominal), the h gate kinetics increased fivefold (τh/5), and the m gate kinetics decreased by a factor of 10(10τm). Also shown is the threshold current needed to cause an action potential to fire in a cable that was not paced by a sinus beat (Firing).
The time constants of the m and h gates of the Na+ were varied to determine their effect on the extrasystole threshold (Fig. 8), as was done with the firing threshold. Decreasing the kinetics of the m gate increased the extrasystole current threshold over the lower range of frequencies. Like the nominal case, there was an abrupt increase in the threshold as stimulus frequency was increased, but the frequency at which it occurred decreased from approximately 100 to 60 Hz. For frequencies > 100 Hz, the extrasystole threshold was relatively unaffected. Increasing the kinetics of the h gate significantly increased the threshold over all frequencies below the abrupt jump at 100 Hz. Again, above 100 Hz, the effect of altering the Na+ channel kinetics was rather small.
Discussion
This study had two goals: (1) to examine the intrinsic mechanisms that govern the general response of cardiac tissue to AC stimulation and (2) to provide further examination of the mechanisms involved in hemodynamic collapse of the heart induced by low-strength sinusoidal currents without the onset of ventricular fibrillation as observed in the accompanying article.1 The model provided mechanistic explanation of the following effects observed in the accompanying article1: (1) insignificant effect of temporal summation of subthreshold stimuli; (2) correlation between ISI and stimulus period; (3) frequency dependence of the extrasystole threshold, i.e., effect; and (4) increased regularity of ISI with increasing stimulus strength. Discussion of these as well as other phenomena associated with AC stimulation of the fiber is provided in the following.
Membrane Patch versus a Fiber
To understand the mechanisms that govern the tissue response to AC stimulation, one must first examine the contribution of the intrinsic membrane properties to this response. To do so, the present study examined extracellular AC stimulation of a membrane patch. Under AC stimulation, the membrane patch voltage remained at the plateau level and did not return to rest until the stimulus was turned off. This latter behavior is consistent with results of cardiac sucrose gap experiments where spatial effects are eliminated.17
Our results demonstrate that under extracellular AC stimulation, the behavior of the patch is different from that of the fiber; the membrane patch is insufficient to capture the complexity of the mechanisms involved. With a fiber, current will travel intracellularly because there is a spatial gradient in excitation, allowing the cells near the electrode to repolarize, whereas in a patch, any intracellular current must flow across the membrane and the constant excitation does not allow this to fully occur and repolarize the cell.
Another difference between the behavior of the patch and the fiber is that the Gildemeister effect is extremely small when a patch is considered, allowing at most three oscillations in Vm before firing an action potential. With a fiber, it is enhanced: an action potential could fire after an almost arbitrary number of oscillations. The change in current to control the number of oscillations also was much larger with the fiber than with the patch, although the current range still was extremely small. A 0.4% increase in current changed the oscillation on which the fiber fired from the eighth to the first. Such a small current range could be missed easily in an experimental recording or may not be possible due to noise and fluctuations in the system. Furthermore, the voltage accumulation is very small, on the order of microvolts for the first oscillation and progressively smaller for later oscillations, so it does not seem likely it would play a significant role in determining membrane behavior. Our observations regarding the current range over which the Gildemeister effect occurs support the conclusion of Malkin and Hoffmeister1 that there is no significant summation of transmembrane voltage that alters the thresholds.
Our results regarding the behavior of both the membrane patch and the fiber differ from the modeling results of Meunier et al.,18 who examined transmembrane AC current injection in a membrane patch and found that the patch elicited multiple action potentials during application of the stimulus. Further, Meunier et al. studied extracellular AC field stimulation of a single cell. The cell was placed between two large electrodes; during every cycle of the stimulus, the cell was depolarized at one end and hyperpolarized at the other end. The interaction of the oppositely polarized ends of the cell caused an extended oscillatory plateau of the action potential. Similar behavior is observed experimentally.19 The difference between our observations in both the patch and the fiber and the results of Meunier et al. is attributable to the different modes of AC stimulation used in the two studies. In our case, the patch was subjected to an extracellular and not transmembrane current stimulus. Further, our fiber model was subject to an electric field that dropped off inversely with distance along the length of the fiber, while the field-stimulated cell was subject to a constant electric field whose effect varied sinusoidally along the cell circumference.
Discrete Nature of APDs and ISIs
The region under the electrode experiences the greatest applied field from the electrode and, thereby, has the largest transmembrane voltages generated there. It is from this region that the action potentials are generated that propagate down the fiber. The active tissue response directly under the electrode is difficult to analyze without filtering, because it resembles a sine wave with a baseline modulated by an action potential that often is much smaller in amplitude than the sine wave.
Both experimentally1 and in this model, APD and ISI are linked to stimulus frequency, and this relationship is strongest under the electrode. Cell firing is dependent on iNa activation, which occurs when Vm exceeds approximately −50 mV. Because sodium channels quickly close once they open, this threshold must be crossed from below rest in a very short time. This corresponds to the negative-going phase of the stimulus, when the electrode starts to act as a cathode. Thus, action potential firing is constrained to occur within a very short time of the stimulus entering the cathodal phase.
If an action potential does not occur during one cycle, the Na+ current is stronger the next cycle and the chance of an action potential increases. Usually several cycles are needed after rest has been reached for the cell to fire again. Similar to firing, the cell can only return to rest and reset when the stimulating current enters its positive-going phase, when the stimulating electrode becomes an anode. During the plateau, very small currents will prolong the plateau because there is a fine balance of currents, thereby limiting repolarization to the anodal phase of the stimulating current. Thus, because firing and returning to rest are linked to the phase of the stimulating current, the ISIs and APDs tend to only occur at discrete values that are multiples of the stimulus period. At lower frequencies, this relationship tends to be stronger because there was a slight variance in exactly when the cell would repolarize or fire when the stimulus changed phase. This small variance appears greater when measured as a fraction of period for the higher frequencies where the period is shorter.
The relationship described by Malkin and Hoffmeister1 relating the activation interval to the stimulus period, ISI = min nT < APD, is a direct consequence of the discrete nature of the APDs and ISI. The currents that control the action potential, described earlier, are linked to particular phases of the stimulus. This relationship is observed most easily at very low frequencies where the period T is large and one can unambiguously determine whether or not an action potential has occurred within one period. At very high frequencies, the relationship is less clear, because T becomes small. There are so many oscillations that it may be difficult to determine when a cell has returned to rest, and there may appear to be more than one oscillation before the cell fires again. Examining the transmembrane voltage alone is not a true measure of the excitability of the cell, because excitability is really determined by the voltage- and time-dependent states of the channels, which are not directly observable. Therefore, when analyzing voltage tracings at high frequencies, n may not be the greatest integer such that nT < APD as proposed, but it may be slightly less, because there may appear to be oscillations between a return to rest and the next firing.
Activation Threshold
The results of both our study and the accompanying experimental study1 reveal a frequency dependency of threshold for firing and extrasystole. By manipulating the parameters in the model, we were able to unravel the mechanisms behind this dependency. The passive properties of the fiber can account for the increase in firing threshold at high frequencies. The capacitive component of the fiber shunts more current across the membrane as the frequency is increased, thereby reducing the membrane resistance and, thus, decreasing the voltage induced across the membrane.
Slowing the kinetics of the m gate increases the activation threshold at high frequencies, because m increases with Vm and has a harder time tracking the increase in Vm when the stimulus period is reduced. Conversely, the h and j gates tend toward zero as Vm is increased. The j gate is still much slower than m, even when sped up by an order of magnitude. As such, the j gate will only react quickly enough to retard the Na+ current at low frequencies. At higher frequencies, it is essentially static, even when kinetics are increased fivefold. The h gate affected the threshold over the entire frequency range. This occurs because the h gate plays the prominent role in determining the membrane resistance and is the major gate that opposes the opening of the m gate to limit Na+ current. In addition to shifting the firing threshold curve upward, it shifts it to the left, causing the nadir to occur at a slightly lower frequency. Thus, for low frequencies, the threshold increase is due to the ability of the h gate to track changes in the transmembrane voltage.
Negative Rate Dependency
The model showed a decrease in action potential firing rate as the stimulating current was increased. This dependency was not strong, as it resulted in an approximate 25% increase in rate as the current was increased from threshold to 7× threshold. This is opposite to the findings of Reilly et al.,20 who found that the sensory nerve firing rate increased with the increase in stimulus current. The intrinsic differences in cell types probably account for this discrepancy. Nerve action potentials are much shorter than cardiac ones (2 vs 200 msec) and lack a plateau phase. During the plateau phase, there are many currents working in an antagonistic fashion, with the net result that they nearly cancel each other out. Altering their behavior and upsetting the fine balance, especially in the phase-dependent and complex manner that sinusoidal stimulation does, makes it difficult to predict whether the APD will be shortened or lengthened by AC stimulation. Because the ISI is related to the APD, it also is difficult to predict whether AC stimulation will lead to an increase or decrease in ISI.
Effect of the Sinus Beat
To bring our modeling study closer to the experimental conditions in the accompanying article,1 part of the simulations were conducted with the inclusion of a “Purkinje” input in the fiber. The study of Malkin and Hoffmeister1 identified three thresholds during stimulation of in vivo heart as the strength of the sinusoidal current was increased. For very low current levels, there is no effect and the natural sinus period is observed. At the effect threshold, the natural sinus rhythm is interrupted and occasional extrasystoles are detected. The histogram under these conditions shows a much greater dispersion of recorded ISIs. As the current is increased further, the hemodynamic collapse threshold is reached, where, in addition to the loss of blood pressure, the ISI dispersion greatly reduces. The sinus rhythm is no longer detectable at this point. Finally, as the current is increased further, the fibrillation threshold is reached.
The first threshold, that of effect, is observed in simulations as well (Fig. 8) as an extrasystole threshold. It can be explained as the interaction of two oscillators, one driven by the sinusoidal stimulus and the other by the sinus beat. In a heart subject to AC stimulation, there will be a region where the regular sinus signal traveling along the Purkinje fibers will encounter cells under the influence of the AC stimulus electrode, and some sort of interaction will occur. The first threshold that takes place as the AC current is increased from zero is the effect threshold, where the stimulus need only be strong enough to perturb the sinus beat and produce an extrasystole. In contrast, without a sinus beat, the first threshold that is crossed as the current increases is the threshold at which the stimulus is strong enough to drive the fiber to fire. With a sinus beat present, the sinusoidal stimulation may be able to put the cell in a state of increased excitability by affecting the gating variables associated with recovery. During this state, a sinusoidal stimulation that was otherwise subthreshold may cause firing. Also, depending on the timing of the stimulus, it may counteract the “Purkinje” input and cause the fiber to miss a beat. The frequency dependency of the effect (extrasystole) threshold obtained here is close to the one found experimentally,1 with a nadir at 20 Hz, whereas without a sinus beat, the nadir of the firing curve falls below 10 Hz.
For the extrasystole or effect threshold, the impact of changes to the gate kinetics was similar to those seen for the firing threshold but only for frequencies below approximately 100 Hz. Thus, the firing and extrasystole thresholds seem to share common mechanisms for low-frequency stimuli. For the extrasystole threshold, there was an abrupt increase at 100 Hz; above this frequency, altering membrane kinetics did not affect the threshold very much. This frequency of 100 Hz also is the frequency at which the firing threshold abruptly increased when the m gate kinetics were slowed by a factor of 10. This suggests that the jump in extrasystole threshold is related to the m gate kinetics and may be explained by the observation that when the stimulus is applied during the plateau phase, the kinetics of the m gate are slowed down by a factor of approximately 10 because of voltage dependencies. The response of the cell to a stimulus applied during the refractory period is more complex than the response of the resting cell, because membrane deexcitation also can play a role.
The collapse threshold found in the initial study1 is a mechanical threshold and was not directly observable in the present study. There is an electrical phenomenon associated with collapse, however, and that is the regularity of the heart rate at a much higher frequency than the sinus beat. If collapse is brought about by rapid pacing of the heart, it will occur when the stimulus is strong enough to mask the sinus beat. This seems to be the case1 where collapse occurs when the regular sinus rhythm is no longer detectable and only electrical activity with a regular 200-msec period is observed. Likewise, in our study, increasing the current strength eventually led to activity with a period around 200 msec that was not correlated with the sinus beat (Fig. 7).
Study Limitations
The study only considered a one-dimensional fiber and, hence, could not induce fibrillation as it is a spatiotemporal phenomenon requiring at least two spatial dimensions. Also, the curving fiber architecture of the heart was not modeled. Such curvature leads to conductivity changes and the development of virtual electrodes far from the stimulating electrode. The “Purkinje” input also was modeled very simply. Despite these limitations, this study was able to reproduce the major observations of the accompanying study1 and provide insight into the intricacies of AC stimulation of the heart.
Conclusion
The model of a strand of cardiac myocytes subject to an extracellular AC current stimulus was able to mechanistically account for the following phenomena observed in the accompanying experimental study1: (1) insignificant temporal summation of subthreshold stimuli; (2) correlation between ISI and the stimulus period; (3) frequency dependency of the extrasystole threshold; and (4) increased regularity of ISI with increasing stimulus strength.
Acknowledgments
This work was supported by NSF Grants BES-9809132 and DMF-9709754; NIH Grant HL63195; and by contract LEQSF(1998-01)-RD-A-30 from the Louisiana Board of Regents through the Boards of Regents Support Fund.
References
- 1.Malkin R, Hoffmeister B. Mechanisms by which AC leakage currents cause complete hemodynamic collapse without inducing fibrillation. J Cardiovasc Electrophysiol. 2001;12:1154–1161. doi: 10.1046/j.1540-8167.2001.01154.x. [DOI] [PubMed] [Google Scholar]
- 2.Swerdlow C, Olson W, O’Conner M, Gallik D, Malkin R, Laks M. Cardiovascular collapse caused by electrocardiographically silent 60-Hz intracardiac leakage current: Implications for electrical safety. Circulation. 1999;99:2559–2564. doi: 10.1161/01.cir.99.19.2559. [DOI] [PubMed] [Google Scholar]
- 3.Hill A, Katz B, Solandt D. Nerve excitation by alternating current. Proc R Soc Lond B. 1937;121:74–133. [Google Scholar]
- 4.Reilly J. Applied Bioelectricity: From Electrical Stimulation to Electropathology. Springer-Verlag; New York: 1998. [Google Scholar]
- 5.Prevost J, Batelli F. Death by electric currents (alternating current) C R Acad Sci . 1899;128:668. [Google Scholar]
- 6.Ferris L, King B, Spence P, Williams H. Effect of electric shock on the heart. Electr Eng . 1936;55:498. [Google Scholar]
- 7.Witzel D, Geddes LA, McFarlane J, Nichols W. The influence of cycle frequency on the effectiveness of electrical defibrillation of the canine ventricles. Cardiovasc Res. 1967;5:112–118. [PubMed] [Google Scholar]
- 8.Ferris C, Moore T, Khazei A, Cowley R. A study of parameters involved in alternating current defibrillation. Med Biol Eng. 1969;7:17–29. doi: 10.1007/BF02474666. [DOI] [PubMed] [Google Scholar]
- 9.Kugelberg J. Electrical induction of ventricular fibrillation in the human heart. A study of excitability levels with alternating current of different frequencies. Scand J Thorac Cardiovasc Surg. 1976;10:237–240. doi: 10.3109/14017437609167800. [DOI] [PubMed] [Google Scholar]
- 10.Weirich J, Hohnloser S, Antoni H. Factors determining the susceptibility of the isolated guinea pig heart to ventricular fibrillation induced by sinusoidal alternating current at frequencies from 1 to 1000 Hz. Basic Res Cardiol. 1983;78:604–616. doi: 10.1007/BF01907207. [DOI] [PubMed] [Google Scholar]
- 11.Plonsey R. Bioelectric sources arising in excitable fibers (ALZA lecture) Ann Biomed Eng. 1988;16:519–546. doi: 10.1007/BF02368014. [DOI] [PubMed] [Google Scholar]
- 12.Luo CH, Rudy Y. A dynamic model of the cardiac ventricular action potential. II. Afterdepolarizations, triggered activity, and potentiation. Circ Res. 1994;74:1097–1113. doi: 10.1161/01.res.74.6.1097. [DOI] [PubMed] [Google Scholar]
- 13.Debruin K, Krassowska W. Modeling electroporation in a single cell. 1. Effects of field strength and rest potential. Biophys J. 1999;77:1213–1224. doi: 10.1016/S0006-3495(99)76973-0. [DOI] [PMC free article] [PubMed] [Google Scholar]
- 14.Tovar O, Tung L. Electroporation and recovery of cardiac cell membrane with rectangular voltage pulses. Am J Physiol. 1992;263:H1128–1136. doi: 10.1152/ajpheart.1992.263.4.H1128. [DOI] [PubMed] [Google Scholar]
- 15.Gildemeister M. Untersuchungen über die Wirkung der Mittelfrequenzströme auf den Menschen. Pflugers Arch . 1944;247:366. [Google Scholar]
- 16.Rattay F, Aberham M. Modeling axon membranes for functional electrical stimulation. IEEE Trans Biomed Eng. 1993;40:1201–1209. doi: 10.1109/10.250575. [DOI] [PubMed] [Google Scholar]
- 17.Antoni H, Töppler J, Krause H. Polarization effects of sinusoidal 50-cycle alternating current on membrane potential of mammalian cardiac fibres. Pflugers Arch. 1970;314:274–291. doi: 10.1007/BF00592287. [DOI] [PubMed] [Google Scholar]
- 18.Meunier J, Trayanova N, Gray R. Sinusoidal stimulation of myocardial tissue: Effects on single cells. J Cardiovasc Electrophysiol. 1999;10:1619–1630. doi: 10.1111/j.1540-8167.1999.tb00226.x. [DOI] [PubMed] [Google Scholar]
- 19.Gray RA, Foster E, Jalife J. Entrainment of the intact ventricles using field stimulation. PACE. 1996;19(Pt II):666. [Google Scholar]
- 20.Reilly J, Freeman V, Larkin W. Sensory effects of transient electrical stimulation: Evaluation with a neuroelectric model. IEEE Trans Biomed Eng. 1985;32:1001–1011. doi: 10.1109/TBME.1985.325509. [DOI] [PubMed] [Google Scholar]


