Abstract
Studies using conventional electron microscopy describe the cytoplasm of lens fiber cells as having essentially an amorphous structure. We hypothesized that significant structural detail might have been lost as a result of projecting the entire thickness of the section (50–100 nm) onto a single plane (the “projection artifact”). To test this hypothesis, we studied the 3D-structure of rat lens cortical fibers before and after extracting the “soluble” crystallins with low ionic strength buffers to make “ghosts.” Tomographic series in conical geometry were collected at 55° tilts and by 5° rotations until completing a 360° turn by low dose methods. They were aligned using fiduciary points, reconstructed with the weighted back projection algorithm and refined by projection matching. Analysis of the 3D-maps included semiautomatic density segmentation using a computer program based on the watershed algorithm. We found that the cytoplasm of cortical fibers, though appearing amorphous in regions of the highest density, was in fact comprised of an ordered structure resembling a “clustered matrix.” The matrix was comprised of thin (~6 nm diameter) filaments bent sharply at 110–120° angles and studded with cubeshaped particles (the “beaded” filaments). In cortical fibers, the particles measured a = 14 ± 2, b = 13 ± 2 and c = 10 ± 2.4 nm (n = 30, mean ± SD) and were spaced at distances measuring 27.5 ± 2.4 nm apart (n = 8, mean ± SD), center-to-center. The matrix was formed as “beaded” filaments, bound to clusters of “soluble” proteins, crossed each other at nearly perpendicular angles. The matrix also made contact with the plasma membrane at a large number of distinct regions. We thus concluded that the cytoplasm of cortical lens fibers is comprised of a cytoskeletal matrix of “beaded” filaments that organize the “soluble” crystallins in separate regions. The association of this matrix with the plasma membrane allows the lens to maintain its structural integrity, while its association with crystallins yields its long-term transparency. Loss of either function likely would play a significant role in cataract formation.
Keywords: electron tomography, cytoskeleton, intermediate filaments, “beaded” filaments, crystallins, density segmentation
1. Introduction
It is well known that the principal function of the lens is to focus light on the retina, thus allowing the eye to project images onto the brain, rather than gradations of light intensity. This function is achieved by evolutionary adaptations that are shared across many species. They include the arrangement of specialized “fiber” cells into honeycomb-like structures; the absence of blood vessels; the removal of most cellular organelles to decrease scattering; and the accumulation of massive amounts of “soluble” proteins to increase the index of refraction of the cytoplasm (Bassnett and Beebe, 1992; Kuwabara and Imaizumi, 1974; Cvekl and Piatigorsky, 1996).
Significant advances have been made in determining the chemical composition and function of the protein mediating these functions. In all vertebrate lenses, ~90% of total mass is comprised of “soluble” crystallins (Graw, 1997; Piatigorsky, 1998a,b), while the “insoluble” proteins belong to the cytoskeleton and plasma membranes. The cytoskeleton is comprised principally of actin and intermediate filaments (Ramaekers et al., 1980; Ireland and Maisel, 1983; Ireland et al., 1983; Lo et al., 1997). Unique to the lens cytoskeleton is the “beaded” filament that was identified first in chick lenses (Maisel and Perry, 1972) and later in all vertebrate lenses (Perng and Quinlan, 2005). “Beaded” filaments are assemblies of two proteins, called cytoskeletal protein 49, CP49 or phakinin, and cytoskeletal protein 115, CP115 or filensin (Gounari et al., 1993; Merdes et al., 1993; Goulielmos et al., 1996; Georgatos et al., 1997). By interacting with plasma membranes and “soluble” crystallins, “beaded” filaments are thought to maintain the structural integrity and the long-term transparency of the lens (Oka et al., 2008).
Despite these many advances, technical limitations have greatly hampered the understanding of the structure that crystallins and the cytoskeleton adopt in the cytoplasm of fibers. Small-angle X-ray scattering experiments performed on intact lenses indicate short-range order, organization consistent with that of dense liquids or glasses (Delaye and Tardieu, 1983). On the other hand, early studies using the electron microscope described the cytoplasm of lens fibers as having an “amorphous” structure (Wanko and Gavin, 1959; Resnik et al., 1960; Kuszak et al., 2004), like that of a dense liquid but incongruous with the structure that assemblies of α-crystallin and cytoskeleton filaments exhibit in solution (Goulielmos et al., 1996; Haley et al., 1999). In fact, the application of 2D Fourier analysis to study the structure of the cytoplasm has revealed the presence of small fluctuations in the cytoplasm texture but has been nonetheless inadequate to characterize the nature of these aggregates (al-Ghoul and Costello, 1996; Taylor et al., 1996; Clark, 2001, 2004).
We speculated that the organization of the cytoskeleton in the otherwise “amorphous” lens cytoplasm has remained undetermined due in part to the “projection artifact,” a limitation inherent in imaging specimens with conventional electron microscopy (Zampighi et al., 2006). Consequently, we reconstructed rat lens fibers before and after extracting crystallins (“ghosts”) by conical electron tomography and analyzed the resulting 3D-maps using density segmentation methods (Lanzavecchia et al., 2005; Zampighi et al., 2005, 2006, 2008; Cantele et al., 2007; Salvi et al., 2008). This analysis showed that the cytoplasm of cortical fibers is comprised of a cytoskeleton matrix that encases clusters of particles and dense regions representing the “soluble” crystallins. The matrix was comprised of bent filaments that are studded with cube-shaped particles, together constituting the “beaded” filaments (Maisel and Perry, 1972). We thus concluded that the filamentous matrix contains “soluble” crystallins within its volume to ensure long-term transparency and it attaches to the plasma membranes to maintain its structural integrity.
2. Methods
2.1. Animals
We used rat lenses aged 4 weeks. All handling of animals was in strict accordance established by the Animal Care and Use Committee of this institution. The animals were anesthetized by halothane inhalation or Nembutal injection and sacrificed by decapitation.
2.2. Preparation of “ghosts”
Freshly excised rat lenses were washed in cold PBS supplemented with 5 mM EDTA, embedded in M1 medium (Thermo Shandon, Pittsburgh, PA), frozen on dry ice and stored at −70 °C. For the preparation of “ghosts”, the frozen lenses were cut into sections of ~150 μm in thickness. The sections were collected in ice-cold PBS/EDTA and left for 2 h in the solution under gentle agitation. After two–three solution exchanges, the resulting “ghosts” were fixed for thin section electron microscopy (see below) or used for Western blot analysis.
2.3. Western blots
Cryo-sections before and after extracting soluble proteins (“ghosts”) were homogenized in PBS 5 mM EDTA, 1% Triton X100, 0.1% SDS, 20′ on ice, and centrifuged to remove insoluble aggregates (15 min at 16,000g). The concentration of the protein extracts was evaluated using a Bradford assay and equal amounts of “total lens” and “ghost” proteins were loaded on a 12.5% polyacrylamide gel. After SDS-PAGE, proteins were transferred on nitrocellulose membranes and blotted with antibodies against Phakinin (goat polyclonal A-15 and M-13, Santa Cruz Biotechnology, Inc.), Filensin (from Dr. P. Fitzgerald), AQP0 and αA and αB-crystallins (from Dr. J. Horwitz).
2.4. Fixation and embedding
Whole “unextracted” rat lenses were fixed in 4% paraformaldehyde, 2% glutaraldehyde in 0.1 M Na Cacodylate buffer (pH 7.4) for 3 h at room temperature. “Ghosts” of rat lenses were fixed in 3% glutaraldehyde in PBS/EDTA for 90 min at room temperature. To increase signal-to-noise ratio, pieces of unextracted lenses and “ghosts” were fixed for an additional 30 min in the same solution plus 0.5% tannic acid. Post-fixation was done in 1% osmium tetroxide (90 min). Following fixation, the specimens were incubated in 0.5% uranyl acetate, 48 h at 4°, dehydrated in ethanol and embedded in Epon 812. Before embedding, the unextracted lenses were hemisected sagittally and oriented so as to obtain sections through the equatorial plane; semi-thin sections were cut and stained with Toluidine Blue, and the areas of interest were localized by counting ~40 cell layers from the equatorial capsule. The selected fiber cells, although most likely still elongating, were consistently devoided of organelles, Golgi-derived vesicles, intermediate filaments and microtubules. The same approach could not reliably be used in extracted ghosts, given the tendency of the frozen sections to fragment into smaller pieces during extraction. Consequently, the developmental stage of fibers was also assessed by the absence/presence of the characteristic ~10 nm diameter intermediate filaments in the cytoplasm (Sandilands et al., 1995) and data not shown. Thin sections of 50–100 nm in thickness were cut and deposited on single-hole (~600 μm diameter) grids coated with formvar. After staining with uranyl acetate and lead citrate, gold particles (10 nm diameter) were deposited on the surface of sections and coated with carbon (Zampighi et al., 1980, 1989, 2000).
2.5. Conical tomography
The steps used to prepare the conical tomograms are listed in Table 1. The following paragraphs describe these steps in an abbreviated form since they have been described in detail elsewhere (Lanzavecchia et al., 2005; Zampighi et al., 2005, 2008; Cantele et al., 2007; Salvi et al., 2008).
Table 1.
Flow chart of the experimental protocol
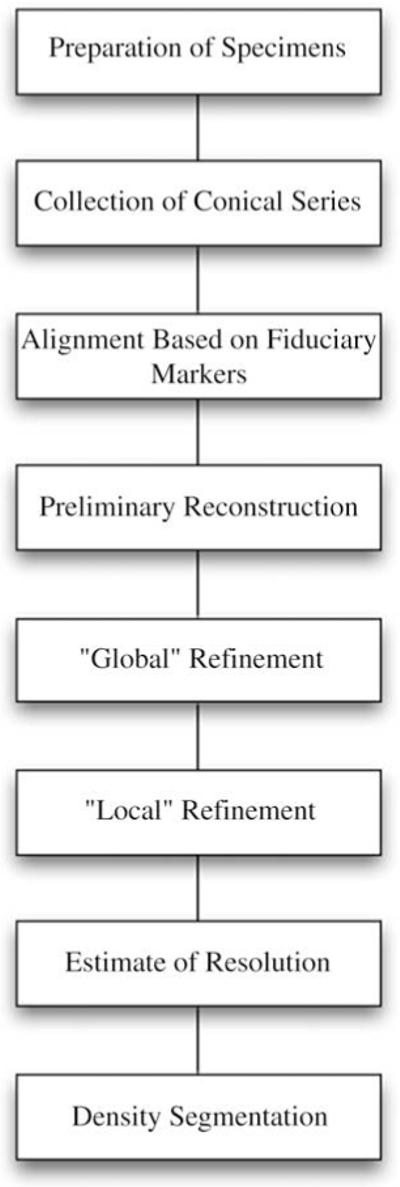 |
We collected conical series of images from controls and from “ghosts” using the Gatan 650 Single Tilt Rotating Holder in a FEI Tecnai 12 electron microscope operated at 120 KV. The images were collected with a 2 k × 2 k CCD Gatan camera at 26,000× magnification. The thin sections were tilted at a fixed angle (55°) and rotated by 5° steps through a complete 360° turn (total of 72 images). Imaging was carried out using a minimum-dose method: searching was done at 2700× magnification with minimum illumination and the regions of interest imaged by focusing ~2 μm away.
The alignment used the ImageJ software package (Abramoff et al., 2004). A specific gold particle was selected and then shifting each image of the conical series such that the same particle was in the center of all projections. After centering, the coordinates of other gold particles (5–8) allowed us to find the orientation parameters (Euler angles and origin position) of the micrographs and calculate “preliminary” 3D-maps with the weighted back projection algorithm (Radermacher, 1992). First, we used a “global” strategy where the projections were iteratively cross-correlated with re-projections of an updated reconstruction to refine the maps. This “global” refinement strategy allowed the determination of the best values for all the shift and orientation parameters and improved both alignment and resolution of the preliminary maps. Second, a “local” strategy corrected for the fact that the deformation induced by radiation damage (“shrinkage”) was non-spatially uniform (Cantele et al., 2007).
We used the Amira software package to analyze and visualize the 3D-maps of cortical fibers and “ghosts.” The process included: a) sectioning the volume into single-pixel slices (~0.75 nm in thickness) along the X–Y, X–Z and Y–Z planes, b) projecting the entire volume onto a single plane and c) rendering the volume by assigning colors and intensities of light to each voxel based on a number of user-defined parameters. The process also included density segmentation that was performed manually, by using the tools of Amira, and semi-automatically by using JUST, a computer program based on the watershed algorithm (Salvi et al., 2008). The process started by defining the boundaries of plasma membranes, the only membrane-bound organelles in fibers. The residual volume was then segmented in three categories on the basis of density values (high, intermediate and low). The process culminated by calculating “composition maps” where all segmented structures were analyzed, and conflicting assignments were resolved. JUST was implemented in a program running under the Linux operating system. The graphic user interface was written in Java, while all intensive computational routines were written in ‘C’. Display of images and volumes also used ImageJ and Bsoft (Heymann, 2001) software packages.
Fourier Shell Correlation estimated the initial resolution of “preliminary” maps (Van Heel, 1987). The resolution of maps refined by projection matching was estimated from measurements of thickness of the phospholipid bilayer (Zampighi et al., 2005). After refinement, the resolution of the maps was estimated to be ~3 nm.
2.6. Measurements
We used the Amira package to measure the thickness of the phospholipid bilayer, the dimensions of the cube-shaped particles studding the “beaded” filaments, their center-to-center spacing and the kink in the filament’s core. For the thickness of the phospholipid bilayer, the distance between the centers of the dense layers flanking the electron-lucent core, we used single-pixel slices from three different reconstructions (10–15 measurements each). For the x–y-dimensions of the particles of “beaded” filaments, we used single-pixel slices passing through their center and measured the edges of the cube containing the particle. For the z-dimension, we counted the number of slices and multiplied this number by the thickness of the slice (0.75 nm). To measure the center-to-center spacing of the particles and the kink angles, the centers of the particles were marked using the landmark function of Amira. From these coordinates (x,y,z), we calculated the distance between two neighboring particles using the formula: √((x0 − x1)2 + (y0 − y1)2 + (z0 − z1)2). The angle formed by three consecutive particles was calculated with the formula: arccos((v1···v2)/(|v1|*|v2|)), where v1 and v2 are vectors, (···) is the dot product and |v1|*|v2| are the multiplied normalized vectors.
3. Results
Our study focused on cortical fibers at a developmental stage when they are comprised of plasma membrane, appearing as trilayer structures of ~6 nm in thickness, and cytoplasm lacking characteristic organelles, such as mitochondria and nuclei (Fig. 1A, B). Plasma membranes of adjacent fibers connect to form extensive networks of cell-to-cell junctions, a defining property of lens fibers (Fig. 1A, B). Though the cytoplasm lacks membrane-bound organelles, regions are segregated by starkly contrasting density (Fig. 1A, B). Dense regions appeared as globules, fusing into a continuous layer and associating with the plasma membrane. In contrast, the less dense regions preferentially occupied the interior of the fibers.
Fig. 1.
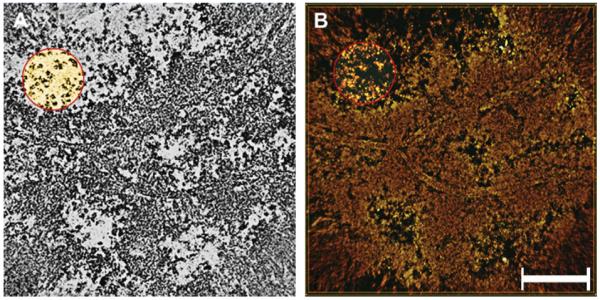
Reconstruction of cortical fibers from unextracted lenses. Panel A is a single-pixel slice (0.75 nm in thickness) cut along the X–Y plane showing the reconstructed field. The boundaries of three fibers are represented by plasma membranes. The cytoplasm contains a layer of electron-dense material associated with plasma membranes and less dense regions at the center, containing distinct particles arranged in clusters (circle). Panel B is the rendered map (~35 nm in thickness) depicting the overall distribution of plasma membranes and regions of greater and lesser density in the cytoplasm. Note that the particles seen in the single-pixel slices correspond to filaments (red circle). Bar: 0.2 μm.
We studied the structure of these contrasting regions by sectioning the 3D-maps along the X–Y, X–Z and Y–Z planes and by using software to render their volumes (Fig. 1A, B). With these approaches, we found that the regions of lower density contain groups of particles that measured a = 13.3 ± 1.85, b = 12 ± 1.7 and c = 9 ± 1.2 nm (n = 20, mean ± SD) (red circle, Fig. 1A). Together with the filaments they decorate, these particles comprise the “beaded” filaments (Maisel and Perry, 1972), following straight paths only for short distances before veering off at sharp angles (circle, Fig. 1B and green filaments in Fig. 2A, B). The areas of higher density, however, still appeared amorphous (Fig. 1A, B).
Fig. 2.
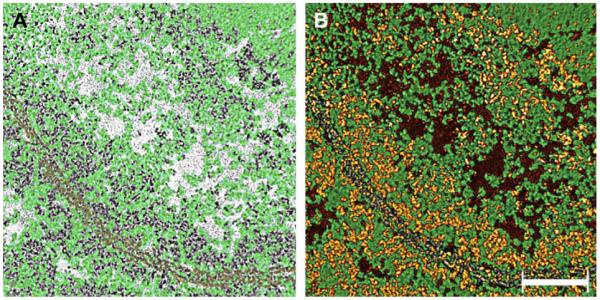
Density segmentation of the cytoplasm from unextracted lenses. Panel A shows the segmented density representing the cytoskeleton matrix (green) in the light region. For reference, a single-pixel slice comprises the background and the plasma membranes were colored yellow. Note that the matrix (green) extends uninterrupted throughout the cytoplasm, independent of the region’s density, and associates directly with the plasma membrane. Panel B shows the “composition” map where densities of the matrix (green) and “soluble” proteins (brown and yellow) have been included. The material colored in gold constitutes the electron-dense layer that is seen associated with the plasma membrane in Fig. 1A, B. The different colors represent the different density values in the tomogram: yellow is the highest, green intermediate and brown the lowest. Bar: 0.12 μm.
Within these amorphous regions, however, the actual density was not consistent. To account for this variation we calculated regional density values, extracting the structures responsible for the disparity and assigning them to separate maps. Clusters of small particles comprised the highest density values, while those of the lowest values yielded unstructured masses. In the maps of “intermediate” density values, a matrix of beaded filaments could clearly be identified (green, Fig. 2). To track the structure of beaded filaments, “composition maps” were created by re-introducing ‘intermediate’ density levels into maps of the lowest and highest densities.
Surprisingly, we discovered that the re-introduction of intermediate density was non-selective: the intermediate maps with clearly delineated beaded filaments, were not restricted to specific planes of the reconstructions, but rather permeated the entire section (gold, green and brown, Figs. 2 and 3). We were thus able to conclude that “beaded” filaments extend throughout the cytoplasm and are independent of overall density (whether areas in the map appear “light” or “dark”). Moreover, the principal difference between regions with clearly differentiated beaded filaments and those appearing “amorphous” is the presence of clusters of small particles of the highest regional density (gold, Figs. 2 and 3). In “dark” regions, these small particles form clusters that fill the spaces bounded by the matrix (Fig. 3B), while in “light” regions, the spaces of the matrix are filled with unstructured masses of the lowest density (brown and gold, Fig. 3A). The small particles of high density can also be seen in the “light” regions, but here they are associated with “beaded” filaments and not assembled in clusters (arrows, Fig. 3A). It thus became clear that the cytoplasm of cortical fibers was a matrix of “beaded” filaments with its internal volume occupied by clusters of small particles in regions close to the plasma membrane, and with unstructured masses in the interior.
Fig. 3.
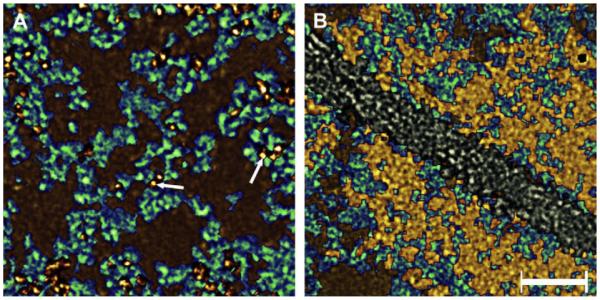
Higher magnifications views of regions in the cytoplasm from unextracted lenses. Panel A shows the “composition” map of a low-density region of the fiber’s cytoplasm. It is comprised of the matrix (green) and soluble proteins represented by the brown regions and dense particles colored in gold (arrows). Note that the small particles were always associate with filaments (arrows). These soluble proteins fill the regions circumscribed by the matrix. Panel B shows the “composition” map of the dark region of the fiber’s cytoplasm. In this region, the matrix (green) intermingles with clusters of small, denser particles (yellow) representing crystallins proteins. The membrane (white) runs diagonally through the center of the panel. Bar: 25 nm.
To find out which density values represent the “soluble” crystallins and which the “insoluble” cytoskeleton and plasma membranes, slices of rat lenses were extracted with low ionic strength buffers to create “ghosts” (FitzGerald, 1990; FitzGerald and Graham, 1991). Western blot analysis (data not shown) indicated that this simple treatment removed ~98% of α-crystallin while greatly enriching for proteins of the cytoskeleton (filensin and phakinin) and the plasma membrane (AQP0 and Cx50). Furthermore, reconstructions of the “ghosts” indicated the presence of both plasma membranes and “beaded” filaments assembled in ring-like arrangements (Fig. 4A, B). On the other hand, the clusters of small particles and unstructured masses that occupied the internal volume of the matrix were absent in the “ghosts.” They likely represent the “soluble” crystallins responsible for increasing the index of refraction in the cytoplasm of cortical fibers.
Fig. 4.
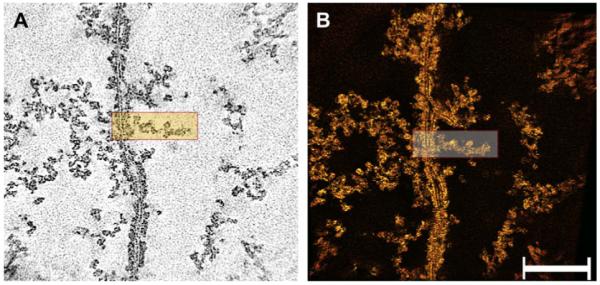
Cytoplasm after extraction of soluble proteins in a “ghost”. Panel A shows a single-pixel slice of the reconstructed field. The plasma membranes of fibers appear as trilayer structures representing the bilayer arrangement of phospholipids. The cytoplasm contains remnants of the matrix, which is composed of interlacing filaments distributed throughout. The filaments oriented themselves either parallel or perpendicular to the plane of the membrane. Individual filaments extend in zigzagging rather than straight paths and are studded with particles. Panel B shows a view of the rendered volume. Extraction of soluble proteins removed the clusters of particles seen in the denser regions in cortical fibers. The rectangles in panels A and B show a filament that is attached to the plasma membrane. Bar: 0.15 μm.
The extraction of “soluble” crystallins from the fiber’s cytoplasm allowed us to garner additional information about the structure of the “beaded” filaments and their association with plasma membranes (Figs. 5-7). As established in previous studies, “beaded” filaments are thin (~6 nm in diameter) rods studded with 12–15 nm diameter particles along their length (Maisel and Perry, 1972). In addition to these properties, we found that “beaded” filaments exhibit a bend or “kink” forming 110–120° angles (Figs. 6 and 7). We also found that the particles were shaped as open cubes or “boxes” (i.e., rectangular parallepids) with dimensions a = 15.6 ± 0.7 nm, b = 14.3 ± 0.9 nm and c = 12.7 ± 2.2 nm (n = 10, SD). On average, these particles were slightly larger but not significantly different in structure to those in the “lighter” regions of the fiber’s cytoplasm. They were separated by distances measuring 27.5 ± 2.4 nm (n = 8, mean ± SD) center-to-center apart. Each particle occupied ~2530 nm3 and contained 4–5 smaller globular subunits that encased a central cavity (Fig. 7A–C).
Fig. 5.
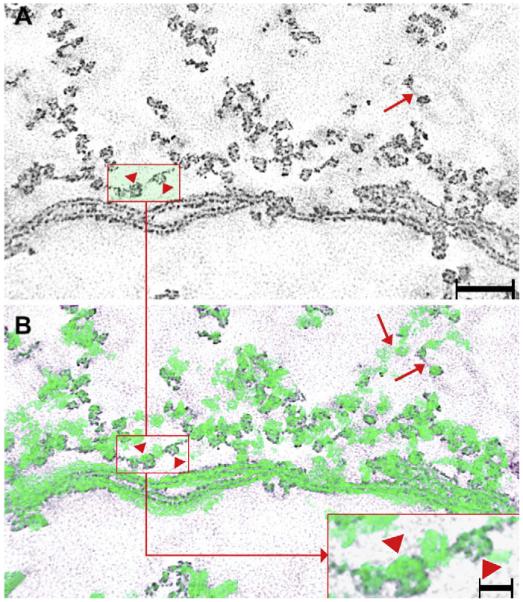
Low magnification views of “ghosts”. Panel A is a single-pixel slice showing the fiber’s plasma membrane and the “beaded” filaments. The plasma membrane can recognized by its trilayer structure while the “beaded” filaments can be identified by the thin filamentous core studded with box-shaped particles. The particles are spaced at distances of ~28 nm apart, center-to-center (arrow and arrowheads in the rectangle). Panel B shows the rendered volume of the “beaded” filaments (green) superimposed on the same single-pixel slide in panel A. In this way, additional particles on the filament can be seen in the clusters (compare rectangles in panels A and B). These particles represent the perpendicular intersections that occur between interacting filaments. The inset shows a higher magnification view of the rectangle in panel B to demonstrate the details of the particle distribution on the filament. Bar: 90 nm, inset: 15 nm.
Fig. 7.
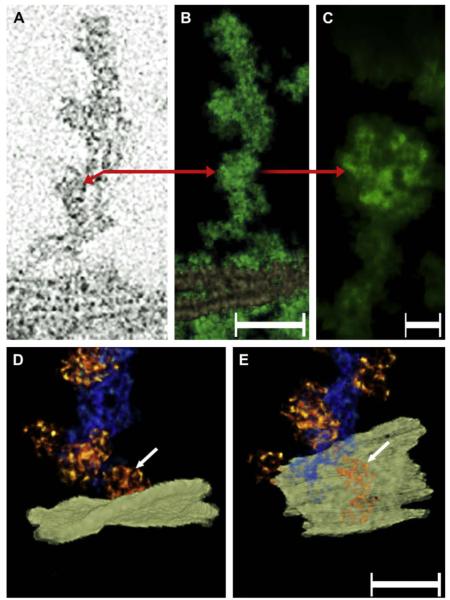
“Beaded” filaments and plasma membranes in a “ghost”. Panel A shows a slice of a “beaded filament” cluster that was oriented perpendicular to the plane of the plasma membrane. The red arrow indicates the location in the core where multiple filaments are separated by a small space. The red arrow also points to a particle decorating the filament on the left side. Panel B shows the rendered volume of the same bundle (green). The plasma membranes from neighboring fibers can be seen on the bottom. Bar: 50 nm. Panel C shows a higher magnification view of the particle indicated by the arrow in the single-pixel slice (panel A) and the rendered volume (panel B). Note that these particles contain an internal structure comprised of smaller globular domains. Bar: 6 nm. Panels D and E show a bundle of “beaded” filaments in order to demonstrate the association that the box-shaped particles (arrow) establish with the plasma membrane (white plane). Viewing the map at an angle from the extra-cellular space indicates that the particle associates with the plasma membrane at distinct points (arrows, panels D and E). Bar: 30 nm.
Fig. 6.
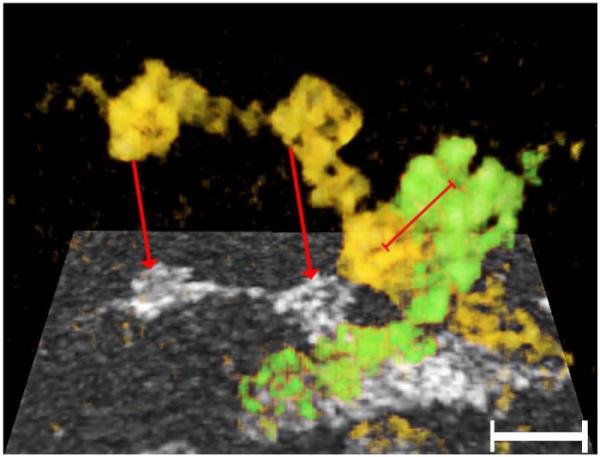
“Beaded” filaments forming the matrix in a “ghost”. The region where two filaments (yellow and green) cross is projected onto a single plane (rectangle below). The red arrows point to the projected representation of the corresponding rendered filament. Key structural properties of each filament are the thin core with pronounced kinks, and the cube-shaped particles studding its surface. At the region where the two filaments cross, particles from the respective filaments were in contact. The distance of the centers of these contiguous particles was ~12 nm center-to-center (red bar). Bar: 20 nm.
The kink accounted for the abrupt changes in the filament’s path present in the cytoplasm before extraction of “soluble” proteins (Figs. 2 and 3). It also forced neighboring filaments to cross at angles of ~90° instead of interacting along their long axis to form bundles (rectangles, Fig. 5A, B and gold and green filaments, Fig. 7). At these intersections, cube-shaped particles from neighboring filaments associate with each other (red line, Fig. 7), forming the matrix to which the crystallins can bind. We note that the almost perpendicular crossings of neighboring filaments accounted for two properties of the matrix: first, the center-to-center spacing was significantly shorter (12 nm instead of ~28 nm) than the spacing of particles in individual “beaded” filaments (Fig. 7); and second, they restricted to a minimum the lateral interactions required to form bundles of filaments. These properties explain why the spacing of particles in “beaded” filaments is so distinct in single-pixel slices (rectangle, Fig. 5A) yet, impossible to realize in rendered volumes (rectangle, Fig. 5B and inset).
Additionally, we note that the filaments of the matrix were also associated with the plasma membrane and inter-cellular junctions (Fig. 4). Using density segmentation (Fig. 8A–E), we observed that the cube-shaped particles associated with the plasma membrane at four to five discrete points. This observation is consistent with studies suggesting that filensin attaches to the AQP0 channels in the plasma membrane (Rose et al., 2006).
Fig. 8.
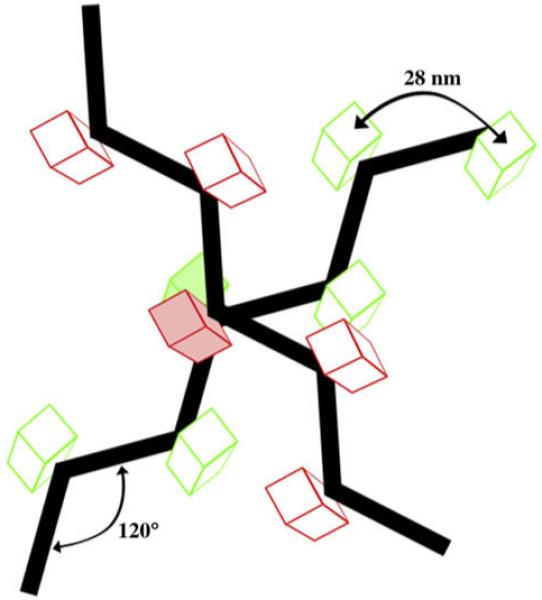
Model. The 3D-structure of the matrix was constructed based on the 120° kink exhibited by the thin filaments, the box-like particles studding their surface and the ~90° angles at crossing points. Together, these properties form the matrix with which filaments associate among themselves and with the plasma membrane.
4. Discussion
Analysis of cortical fibers using conical tomography and density segmentation indicated that the cytoplasm consisted of a matrix that accommodates in its interior the massive quantities of crystallins required to increase the index of refraction. In essence, the cytoplasm resembles a “sponge”, where aqueous solutions fill internal volumes created by insoluble matrices. In cortical fibers, however, the matrix is comprised of filaments with structural properties seen in no other cell in the body.
The first indication of the “sponge-like” arrangement was gleaned from the analysis of regions of less overall density, where the cube-shaped particles of “beaded” filaments were readily identified in the cytoplasm (red circle, Fig. 1A). Identification of the “beaded” filaments in the dense regions, however, required localizing density gradations by calculating regional values, thereby dividing the cytoplasm into separate respective maps based on these values (Salvi et al., 2008). Using this strategy, we found: a) that the “beaded” filaments extend throughout the entire cytoplasm (Fig. 2) and b) that the difference between “light” and “dark” regions hinged directly on the presence or absence of clusters of small dense particles in the spaces bounded by the matrix. Since these clusters were absent in reconstructions of “ghosts”, they likely represent the crystallins, comprising ~90% of the total protein mass of the cytoplasm.
Additional evidence for the hypothesis that the cytoplasm is comprised of a sponge-like “clustered matrix” can be found in the properties of the filaments comprising it: First, beaded filaments are not smooth but studded with cube-shaped particles spaced at ~28 nm center-to-center (Table 2); and second, they exhibit periodic bends or “kinks” with angles of 110–120° along their length. A remarkable consequence of filaments that are “beaded” and bent is that by simple perpendicular crossing between neighboring filaments, the entire cytoskeletal matrix of lens fibers can be formed. We thus conclude that the chemical composition of the cytoplasm of cortical fibers has as its core a remarkably simple 3D-structure resembling that of the common sponge. A refined structural model of the fibrous cytoskeleton would require a detailed understanding of the contribution of actin and intermediate filaments to this composition beyond the scope of this paper.
Table 2.
Properties of filaments of fiber cell cytoskeleton
| Diameter | 5–6 nm |
| Particle dimensions | a = 14 ± 2, b = 10 ± 2, c = 10 ± 2.4 nm (n = 30, mean ± SD) |
| Spacing | 27.5 ± 2.4 nm (n = 8, mean ± SD) |
| Bent or kink | 110–120° |
It was necessary to ask why such a simple structure has been overlooked in studies of fibers and beaded filaments using conventional electron microscopy (Wanko and Gavin, 1959; Resnik et al., 1960; Kuszak et al., 2004; Merdes et al., 1991, 1993; Gounari et al., 1993; Goulielmos et al., 1996). As it turns out, studies of lens fibers have been hampered by the combination of two debilitating factors, namely, the overabundance of clustered crystallins and the limitations imposed by the “projection artifact.” Removal of crystallins from the cytoplasm allows the “beaded” filaments to be identified (Maisel and Perry, 1972) but without tomography, it is very difficult to ascertain details of their 3D-structure or the nature of their association with other filaments. It is not then so surprising that the “kink” in the beaded filament and the perpendicular nature of their intersections has hitherto escaped notice (Fig. 6). Another obstacle altogether arises from the work on assembling filaments in vitro from solutions of filensin and phakinin. It has been shown in these experiments that bundles of “beaded” filaments are comprised of four homotypic phakinin protofilaments forming the core (12–15 nm diameter) and four heterotypic phakinin/filensin protofilaments in the periphery (Georgatos et al., 1997). In reconstructions of cortical fibers or “ghosts,” however, no bundles of “beaded” filaments with those dimensions were observed (Figs. 2, 3, 5 and 6). Assembling “beaded” filaments into matrices that mimic those seen in the native cytoplasm of fibers will require additional experimentation.
Due to the use of heavy metal atoms and the lack of atomic models for filensin, phakinin and α-crystallin, the structure of the fiber cytoplasm garnered in this study cannot be correlated to its protein composition. The use of heavy metal atoms has the advantage of increasing the signal-to-noise ratio of these assemblies, which permits studying individual filaments without averaging over many molecules. A caveat, however, is that the information becomes restricted to the “envelope” structure of the cytoskeleton and the crystallins instead of their internal structure. On the other hand, the lack of atomic models curtails the possibility of applying molecular docking strategies to correlate the “envelope” structure of the assemblies to their protein composition.
Despite these drawbacks, analysis of the primary and secondary structure of filensin and phakinin suggests that the cube-shaped particles represent the head domain of filensin while its rod domain, together with phakinin, constitutes the core of the filament. Estimation of their volume (~2.7 × 10⁵ A3) suggests that the particles can accommodate ~350 kDa, assuming a partial specific volume equal to 1.3 A3/Da. Therefore, there is potentially plenty of space within the cube-shaped particles for a multitude of other soluble proteins, not resolved in these reconstructions. Moreover, it seems likely that the clusters of small particles within the matrix that is associated with the plasma membranes represent α-crystallin (gold, Figs. 2 and 3). This prediction is based on the structure of αB-crystallin determined by single particle methods (Haley et al., 1998, 1999) and the observation that these small particles are not present when soluble crystallins are extracted from the fiber’s cytoplasm (Fig. 4A, B).
In conclusion, we hypothesize that by virtue of their perpendicular intersections and “kinks,” beaded filaments form a honeycomb-like structure upon which α-crystallins can bind, yielding a “clustered matrix” much akin to a sponge. The accumulation of massive amounts of “soluble” crystallins required for a high index of refraction forces the “sponge” to “expand,” while in areas where this is not necessary (at the plasma membrane, for example) the clustered matrix is “contracted.” In this way, the lens is able to maintain both long-term transparency by holding crystallins within its internal volume and structural integrity by associating with the plasma membrane. Loss of either function would likely play a key role in cataract formation.
Acknowledgments
We thank Dr. J. Horwitz for providing us antibodies against AQP0, αA and αB-crystallins and Dr. P. FitzGerald (UC Davis) for antibodies against filensin. The work was supported by NIH-EY-04410 and the Gerald Oppenheimer Family Foundation for the Prevention of Eye Disease (2007).
References
- Abramoff MD, Magelhases PJ, Ram SJ. Image processing with ImageJ. Biophotonics Int. 2004;11:36–42. [Google Scholar]
- al-Ghoul KJ, Costello MJ. Fiber cell morphology and cytoplasmic texture in cataractous and normal human lens nuclei. Curr. Eye Res. 1996;15:533–542. doi: 10.3109/02713689609000764. [DOI] [PubMed] [Google Scholar]
- Bassnett S, Beebe DC. Coincident loss of mitochondria and nuclei during lens fiber cell differentiation. Dev. Dyn. 1992;194:85–93. doi: 10.1002/aja.1001940202. [DOI] [PubMed] [Google Scholar]
- Cantele F, Zampighi L, Radermacher M, Zampighi G, Lanzavecchia S. Local refinement: an attempt to correct for shrinkage and distortion in electron tomography. J. Struct. Biol. 2007;158:59–70. doi: 10.1016/j.jsb.2006.10.015. [DOI] [PMC free article] [PubMed] [Google Scholar]
- Clark JI. Fourier and power law analysis of structural complexity in cornea and lens. Micron. 2001;32:239–249. doi: 10.1016/s0968-4328(00)00044-5. [DOI] [PubMed] [Google Scholar]
- Clark JI. Order and disorder in the transparent media of the eye. Exp. Eye Res. 2004;78:427–432. doi: 10.1016/j.exer.2003.10.008. [DOI] [PubMed] [Google Scholar]
- Cvekl A, Piatigorsky J. Lens development and crystallin gene expression: many roles for Pax-6. Bioessays. 1996;18:621–630. doi: 10.1002/bies.950180805. [DOI] [PubMed] [Google Scholar]
- Delaye M, Tardieu A. Short-range order of crystallin proteins accounts for eye lens transparency. Nature. 1983;302:415–417. doi: 10.1038/302415a0. [DOI] [PubMed] [Google Scholar]
- FitzGerald PG. Methods for the circumvention of problems associated with the study of the ocular lens plasma membrane–cytoskeleton complex. Curr. Eye Res. 1990;9:1083–1097. doi: 10.3109/02713689008997582. [DOI] [PubMed] [Google Scholar]
- FitzGerald PG, Graham D. Ultrastructural localization of alpha A-crystallin to the bovine lens fiber cell cytoskeleton. Curr. Eye Res. 1991;10:417–436. doi: 10.3109/02713689109001750. [DOI] [PubMed] [Google Scholar]
- Georgatos SD, Gounari F, Goulielmos G, Aebi U. To bead or not to bead? Lens-specific intermediate filaments revisited. J. Cell Sci. 1997;110(Pt 21):2629–2634. doi: 10.1242/jcs.110.21.2629. [DOI] [PubMed] [Google Scholar]
- Goulielmos G, Gounari F, Remington S, Müller S, Häner M, Aebi U, Georgatos SD. Filensin and phakinin form a novel type of beaded intermediate filaments and coassemble de novo in cultured cells. J. Cell Biol. 1996;132:643–655. doi: 10.1083/jcb.132.4.643. [DOI] [PMC free article] [PubMed] [Google Scholar]
- Gounari F, Merdes A, Quinlan R, Hess J, FitzGerald PG, Ouzounis CA, Georgatos SD. Bovine filensin possesses primary and secondary structure similarity to intermediate filament proteins. J. Cell Biol. 1993;121:847–853. doi: 10.1083/jcb.121.4.847. [DOI] [PMC free article] [PubMed] [Google Scholar]
- Graw J. The crystallins: genes, proteins and diseases. Biol. Chem. 1997;378:1331–1348. [PubMed] [Google Scholar]
- Haley DA, Horwitz J, Stewart PL. Image restrained modeling of alphaB-crystallin. Exp. Eye Res. 1999;68:133–136. doi: 10.1006/exer.1998.0610. [DOI] [PubMed] [Google Scholar]
- Haley DA, Horwitz J, Stewart PL. The small heat-shock protein, alphaB-crystallin, has a variable quaternary structure. J. Mol. Biol. 1998;277:27–35. doi: 10.1006/jmbi.1997.1611. [DOI] [PubMed] [Google Scholar]
- Heymann JB. Bsoft: image and molecular processing in electron microscopy. J. Struct. Biol. 2001;133:156–169. doi: 10.1006/jsbi.2001.4339. [DOI] [PubMed] [Google Scholar]
- Ireland M, Lieska N, Maisel H. Lens actin: purification and localization. Exp. Eye Res. 1983;37:393–408. doi: 10.1016/0014-4835(83)90176-8. [DOI] [PubMed] [Google Scholar]
- Ireland M, Maisel H. Identification of native actin filaments in chick lens fiber cells. Exp. Eye Res. 1983;36:531–536. doi: 10.1016/0014-4835(83)90046-5. [DOI] [PubMed] [Google Scholar]
- Kuszak JR, Zoltoski RK, Sivertson C. Fibre cell organization in crystalline lenses. Exp. Eye Res. 2004;78:673–687. doi: 10.1016/j.exer.2003.09.016. [DOI] [PubMed] [Google Scholar]
- Kuwabara T, Imaizumi M. Denucleation process of the lens. Invest. Ophthalmol. Vis. Sci. 1974;13:973–981. [PubMed] [Google Scholar]
- Lanzavecchia S, Cantele F, Bellon PL, Zampighi L, Kreman M, Wright E, Zampighi GA. Conical tomography of freeze-fracture replicas: a method for the study of integral membrane proteins inserted in phospholipid bilayers. J. Struct. Biol. 2005;149:87–98. doi: 10.1016/j.jsb.2004.09.004. [DOI] [PubMed] [Google Scholar]
- Lo WK, Shaw AP, Wen XJ. Actin filament bundles in cortical fiber cells of the rat lens. Exp. Eye Res. 1997;65:691–701. doi: 10.1006/exer.1997.0375. [DOI] [PubMed] [Google Scholar]
- Maisel H, Perry MM. Electron microscope observations on some structural proteins of the chick lens. Exp. Eye Res. 1972;14:7–12. doi: 10.1016/0014-4835(72)90136-4. [DOI] [PubMed] [Google Scholar]
- Merdes A, Brunkener M, Horstmann H, Georgatos SD. Filensin: a new vimentin-binding, polymerization-competent, and membrane-associated protein of the lens fiber cell. J. Cell Biol. 1991;115:397–410. doi: 10.1083/jcb.115.2.397. [DOI] [PMC free article] [PubMed] [Google Scholar]
- Merdes A, Gounari F, Georgatos SD. The 47-kD lens-specific protein phakinin is a tailless intermediate filament protein and an assembly partner of filensin. J. Cell Biol. 1993;123:1507–1516. doi: 10.1083/jcb.123.6.1507. [DOI] [PMC free article] [PubMed] [Google Scholar]
- Oka M, Kudo H, Sugama N, Asami Y, Takehana M. The function of filensin and phakinin in lens transparency. Mol. Vis. 2008;14:815–822. [PMC free article] [PubMed] [Google Scholar]
- Perng MD, Quinlan RA. Seeing is believing! The optical properties of the eye lens are dependent upon a functional intermediate filament cytoskeleton. Exp. Cell Res. 2005;305:1–9. doi: 10.1016/j.yexcr.2004.11.021. [DOI] [PubMed] [Google Scholar]
- Piatigorsky J. Gene sharing in lens and cornea: facts and implications. Prog. Retin. Eye Res. 1998a;17:145–174. doi: 10.1016/s1350-9462(97)00004-9. [DOI] [PubMed] [Google Scholar]
- Piatigorsky J. Multifunctional lens crystallins and corneal enzymes. More than meets the eye. Ann. N. Y. Acad. Sci. 1998b;842:7–15. doi: 10.1111/j.1749-6632.1998.tb09626.x. [DOI] [PubMed] [Google Scholar]
- Radermacher M. Electron Tomography. Plenum Press; New York: 1992. Weighted back projection methods; pp. 91–116. [Google Scholar]
- Ramaekers FC, Osborn M, Schimid E, Weber K, Bloemendal H, Franke WW. Identification of the cytoskeletal proteins in lens-forming cells, a special epitheloid cell type. Exp. Cell Res. 1980;127:309–327. doi: 10.1016/0014-4827(80)90437-1. [DOI] [PubMed] [Google Scholar]
- Resnik RA, Wanko T, Gavin MA. Observations on a cytoplasmic component in lens fibers. J. Biophys. Biochem. Cytol. 1960;7:403–406. doi: 10.1083/jcb.7.2.403. [DOI] [PMC free article] [PubMed] [Google Scholar]
- Rose KML, Gourdie RG, Prescott AR, Quinlan RA, Crouch RK, Schey KL. The C terminus of lens aquaporin 0 interacts with the cytoskeletal proteins filensin and CP49. Invest. Ophthalmol. Vis. Sci. 2006;47:1562–1570. doi: 10.1167/iovs.05-1313. [DOI] [PubMed] [Google Scholar]
- Salvi E, Cantele F, Zampighi L, Fain N, Pigino G, Zampighi G, Lanzavecchia S. JUST (Java User Segmentation Tool) for semi-automatic segmentation of tomographic maps. J. Struct. Biol. 2008;161:287–297. doi: 10.1016/j.jsb.2007.06.011. [DOI] [PMC free article] [PubMed] [Google Scholar]
- Sandilands A, Prescott AR, Carter JM, Hutcheson AM, Quinlan RA, Richards J, FitzGerald PG. Vimentin and CP49/filensin form distinct networks in the lens which are independently modulated during lens fibre cell differentiation. J. Cell Sci. 1995;108(Pt 4):1397–1406. doi: 10.1242/jcs.108.4.1397. [DOI] [PubMed] [Google Scholar]
- Taylor VL, al-Ghoul KJ, Lane CW, Davis VA, Kuszak JR, Costello MJ. Morphology of the normal human lens. Invest. Ophthalmol. Vis. Sci. 1996;37:1396–1410. [PubMed] [Google Scholar]
- Van Heel M. Similarity measures between images. Ultramicroscopy. 1987;21:95–100. [Google Scholar]
- Wanko T, Gavin MA. Electron microscope study of lens fibers. J. Biophys. Biochem. Cytol. 1959;6:97–102. doi: 10.1083/jcb.6.1.97. [DOI] [PMC free article] [PubMed] [Google Scholar]
- Zampighi GA, Eskandari S, Kreman M. Epithelial organization of the mammalian lens. Exp. Eye Res. 2000;71:415–435. doi: 10.1006/exer.2000.0895. [DOI] [PubMed] [Google Scholar]
- Zampighi GA, Hall JE, Ehring GR, Simon SA. The structural organization and protein composition of lens fiber junctions. J. Cell Biol. 1989;108:2255–2275. doi: 10.1083/jcb.108.6.2255. [DOI] [PMC free article] [PubMed] [Google Scholar]
- Zampighi GA, Zampighi LM, Fain N, Lanzavecchia S, Simon SA, Wright EM. Conical electron tomography of a chemical synapse: vesicles docked to the active zone are hemi-fused. Biophys. J. 2006;91:2910–2918. doi: 10.1529/biophysj.106.084814. [DOI] [PMC free article] [PubMed] [Google Scholar]
- Zampighi GA, Zampighi L, Fain N, Wright EM, Cantele F, Lanzavecchia S. Conical tomography II: a method for the study of cellular organelles in thin sections. J. Struct. Biol. 2005;151:263–274. doi: 10.1016/j.jsb.2005.05.008. [DOI] [PubMed] [Google Scholar]
- Zampighi G, Corless JM, Robertson JD. On gap junction structure. J. Cell Biol. 1980;86:190–198. doi: 10.1083/jcb.86.1.190. [DOI] [PMC free article] [PubMed] [Google Scholar]
- Zampighi GA, Fain N, Zampighi LM, Cantele F, Lanzavecchia S, Wright EM. Conical electron tomography of a chemical synapse: polyhedral cages dock vesicles to the active zone. J. Neurosci. 2008;28:4151–4160. doi: 10.1523/JNEUROSCI.4639-07.2008. [DOI] [PMC free article] [PubMed] [Google Scholar]


