

Abstract
Chemokines play important regulatory roles in immunity, but their contributions to mast cell function remain poorly understood. We examined the effects of FcεRI–chemokine receptor (CCR) 1 co-stimulation on receptor localization and cellular morphology of bone marrow-derived mast cells. Whereas FcεRI and CCR1 co-localized at the plasma membrane in unsensitized cells, sensitization with IgE promoted internalization of CCR1 molecules. Co-stimulation of FcεRI and CCR1 with antigen and macrophage inflammatory protein-1α was more effective than FcεRI stimulation alone in causing leading edge formation, flattened morphology, membrane ruffles and ganglioside (GM1+) lipid mediator release. Co-stimulation resulted in phalloidin-positive cytoneme-like cellular extensions, also known as tunneling nanotubes, which originated at points of calcium accumulation. This is the first report of cytoneme formation by mast cells. To determine the importance of lipid rafts for mast cell function, the cells were cholesterol depleted. Cholesterol depletion enhanced degranulation in resting, sensitized and co-stimulated cells, but not in FcεRI-cross-linked cells, and inhibited formation of filamentous actin+ cytonemes but not GM1+ cytonemes. Treatment with latrunculin A to sequester globular-actin abolished cytoneme formation. The cytonemes may participate in intercellular communication during allergic and inflammatory responses, and their presence in the co-stimulated mast cells suggests new roles for CCRs in immunopathology.
Keywords: co-stimulation; F/G actin, lipid raft; MIP-1α; tunneling nanotubes
Introduction
Mast cells are c-kit+, bone marrow-derived effector cells of allergic and anaphylactic reactions. Inflammatory mediators released during mast cell degranulation initiate many of the symptoms of the early phase allergic response, such as redness, itching and swelling, and factors secreted by mast cells may contribute to the immune cell recruitment associated with late-phase allergic reactions. Mast cell activation typically occurs when a sensitized cell, in which antigen-specific IgE is bound to its high-affinity receptor FcεRI, encounters an antigen. Antigen binding cross-links FcεRI and results in a variety of cellular responses. These responses include clustering or internalization of surface receptors, re-organization of plasma membrane structures, activation of kinases and phosphatases, increased Ca2+ influx, up-regulation/down-regulation of certain genes and proteins and degranulation and release of cytokines, peptides, enzymes and chemokines (1). Mast cell-derived mediators initiate direct and modulate acquired and innate immune reactions (2–4). Since mast cells vary widely in their response to stimuli, mediator content, differentiation status and receptor expression (5), they may utilize diverse pathways and mechanisms to regulate immune responses. It is therefore important to understand this diversity in mast cells. Few studies have examined the importance of co-stimulation, e.g. via chemokine receptors (CCRs) and integrin molecules, in enhancing the efficiency of cell activation and antigen presentation (6).
Mast cell activation is a poorly understood phenomenon. Cellular structures such as lipid rafts, cytoskeletal components and intercellular communication structures such as cytonemes or tunneling nanotubes may contribute to mast cell function. Dynamic protrusions such as filopodia, microvilli and membrane ruffles have been observed in activated mast cells. Lipid rafts have been shown to play a critical role in mast cell signal transduction and release of granules (7–9), though little is known about the post-exocytosis fate of these granules and lipids. Actin distribution also changes during mast cell stimulation (10).
We have previously demonstrated that co-stimulation of FcεRI and the CCR1 leads to greater granulocyte activation than does stimulation of either receptor alone (11–13). The mechanism for this receptor synergism is unknown. To better define the role of FcεRI–CCR1 co-stimulation in mast cell function, we studied the cellular localization of these two receptors during mast cell activation. For this study, we used murine bone marrow-derived mast cells (BMMC) that endogenously express functional CCR1 and become adherent starting at 8 weeks of age (14). These adherent BMMC express functional CCR1 and display increased expression of the communication marker neurokinin 1 and the inflammation marker intercellular adhesion molecule-1 (14). Since spatial organization of membrane receptors can contribute to cellular effects, we further visualized movement of FcεRI and CCR1 on these BMMC's and examined receptor association with lipid rafts, both before and after co-stimulation, using immunochemistry and video imaging.
Methods
Mast cell culture and functional activity
BMMC endogenously expressing CCR1 were obtained from female BALB/c mice, 5–8 weeks old. The mice were obtained from Jackson Laboratories (Bar Harbor, ME, USA) and maintained in the animal facility of the Emory Clinic Eye Center (Atlanta, GA, USA). Bone marrow was flushed from the femurs and tibias of 9-week-old mice using a 26-gauge needle and sterile PBS. The cells were cultured and maintained in stem cell factor (10 ng ml−1) and IL-3 (5 ng ml−1) as previously described (14) for ∼8 weeks. At this time, they acquired an adherent phenotype and were designated NimOno BMMC (14). Rat basophilic leukemia (RBL)-2H3 cells and RBL-2H3 cells stably transfected with CCR1 (RBL-CCR1 cells) were cultured as previously described (12). Toluidine blue staining was used to confirm mast cell phenotype, and marker expression was determined using flow cytometry, reverse transcription–PCR and western blot analysis. Functional activity of CCR1 on BMMC was verified using degranulation, Ca2+ influx and chemotaxis assays as previously described (14).
Cell sensitization and stimulation
RBL-2H3 cells, RBL-CCR1 cells and BMMC were grown on sterile cover slips in six-well plates, at a density of 1 × 10⁵ cells ml−1. Cells were kept unsensitized or were sensitized by treatment with 22 ng ml−1 (RBL cells) or 100 ng ml−1 (BMMC) mouse anti-dinitrophenol (DNP) IgE mAb (Sigma, St Louis, MO, USA) overnight at 37°C in 5% CO2. The sensitized cells were washed three times with pre-warmed Tyrode's buffer (DMEM containing 0.1% BSA and 1% 1 M HEPES). Sensitized cells were left unstimulated or were stimulated for 5 min with 10 ng ml−1 dinitrophenol-human serum albumin (DNP-HSA) (cross-linking) or 10 ng ml−1 of DNP-HSA with 50 ng ml−1 r-human macrophage inflammatory protein 1α (MIP-1α) (co-stimulation) in DMEM containing 0.1% BSA. The stimulation was stopped by washing with cold PBS and immediately fixing with 4% formalin. Fixed cells on the cover slip were processed for immunocytostaining as follows.
Immunocytochemistry
For surface expression of FcεRI, cells were labeled with anti-DNP IgE clone SPE-7 (D8406, Sigma) and the secondary antibody GaM Fab′2 Alexa 488 (Invitrogen, Carlsbad, CA, USA). CCR1 was labeled using 2 μg ml−1 anti-hCCR1 (MAB145 clone 53504.111, R&D Systems, Minneapolis, MN, USA) for 1 h at 4°C, washed and blocked with Fc blockers 2.4G2 (BD Pharmingen, San Jose, CA, USA) for 10 min followed by Alexa 647 GaM IgG2b at 1 μg ml−1 in PBS for 45 min at 4°C. Membrane rafts were labeled using ganglioside (GM1) cholera toxin marker conjugated with Alexa 555 (Invitrogen) at 4°C for 10 min with shaking. Labeled cells were mounted with Faramount mounting medium (DAKO) and in some instances DAPI-containing mounting medium.
Immunofluorescent confocal microscopy
Samples were analyzed within 5 days of immunolabeling using a Zeiss LSM 510 meta fluorescence confocal microscopy with ×63 and ×100 Plan Apochromat (N.A. 1.4) oil immersion objectives. Distribution of FcεRI was observed using an argon laser, set at 488 nm, and distribution of CCR1 was observed using the far-red laser at 643 nm. For raft and co-localization analysis, a third channel, the helium neon laser at 543 nm, was used. Images were collected at 512 × 512 pixels. Z-plane images obtained at <0.46 μm separation were used to create three-dimensional images (LSM Image Browser), and the central section of the cell was used for calculations. Three independent experiments were conducted. Image analysis and three-dimensional reconstruction and deconvolution of z-stacks was obtained using Zeiss Image Browser 5.
Live cell calcium influx imaging
Unsensitized and sensitized BMMC suspended in Tyrode's buffer were adhered onto 35 × 10 mm tissue culture dishes for 10 min using cytospin. Dishes were then placed either on the control stage maintained at 5% CO2 and 37°C for live cell imaging of an Olympus Fluoview™ FV1000 or on the Perkin Elmer Ultraview confocal microscope. The microscope was set at an excitation wavelength of 488 nm and a field of healthy cells was preselected. Cells were then simultaneously loaded with Fluo-3 acetoxymethyl ester (AM) fluorescent dye (Invitrogen) at final concentration of 1 μM and co-stimulated with antigen and MIP-1α. Control unsensitized BMMC were loaded with Fluo-3 AM but were not stimulated. Optical slices were taken using the ×40 and ×100 oil objectives from 0 s to 5 min. Image acquisition and analysis was performed with F10-ASW software version 1.2 and MetaMorph version 5.00 (Molecular Devices, Downingtown, PA, USA).
Toluidine blue staining
Resting and stimulated (5 min) mast cells were fixed in 1.25% glutaraldehyde at room temperature for 1 h, rinsed in 0.1 M cacodylate buffer, postfixed in 1% osmium tetroxide for 1–2 h and washed again in 0.1 M cacodylate buffer. Cells were then en bloc stained with 2% uranyl acetate for 1 h prior to ethanol dehydration. After a final incubation in propylene oxide, the cells were embedded in resin. Sections were cut at a thickness of 1.5 μm and stained with 0.1% toluidine blue.
Time-lapse of cytoneme formation
Live, unstained and adherent mast cells in tissue culture flasks were used to track real-time formation of cytonemes. Cells were observed at ×10 magnification, numerical aperture 0.3, air immersion using dark field transmission with a spinning-disc confocal microscope (Perkin Elmer Ultraview RS, Boston, MA, USA). Images were acquired using a Hamamatsu c9100-50 camera at 18 fps for 30 min while cells were maintained at 37°C with 5% CO2. A single focal plane was used for image acquisition, though samples were sometimes moved horizontally while the cytoneme extension was in progress. Images were used to obtain detailed quantitative data about cytoneme speed, tracks and objects at different time points following co-stimulation.
Cholesterol depletion and histamine release
To deplete cholesterol from the cells, sensitized and unsensitized BMMC were incubated for 30 min at 37°C with 10 mM methyl-β-D-cyclodextrin (MβCD) in a pH 7.2 buffer containing PBS and 5 mM HEPES. Cells were washed and re-suspended in Tyrode's buffer. Also, prior to the experiment, cells were verified for viability (trypan blue exclusion) and non-toxicity effect. Sensitized BMMC were activated with DNP-HSA, MIP-1α or for both 5 min (for immunocytochemistry) or 30 min (for β-hexosaminidase release). For membrane labeling, cells were fixed immediately then incubated with antibodies to GM1 as described above or with phalloidin as described below.
For the histamine release assay, activated cells were assessed for degranulation by measuring β-hexosaminidase activity in the supernatants. Briefly, p-nitrophenyl N-acetyl-β-D-glucosamide (Sigma) in 0.1 M sodium citrate buffer (pH 4.5) was added and incubated for 60 min at 37°C. The reaction was stopped by adding 0.2 M glycine buffer (pH 10.5). The release of 4-p-nitrophenol was detected by measuring absorbance at 405 nm. Total β-hexosaminidase activity was determined by lysing the cells in Tyrode's buffer containing 0.1% Triton X 100.
Distribution and disruption of actin
Filamentous actin (F-actin) distribution was visualized by incubating cells with phalloidin conjugated to Alexa 488 (Invitrogen) and 0.1% Triton X-100 at room temperature for 10 min. Globular-actin (G-actin) was disrupted by treating sensitized and control cells with 250 ng ml−1 Latrunculin (Lat) A (Invitrogen) at 37°C for 45 min in Tyrode's buffer. This concentration did not affect viability, as assessed by trypan blue extrusion. The cells were then washed and stimulated for 5 min as described above. The reaction was stopped by removing the stimulant solution and quickly fixing the cells in 4% PFA. Cells were than labeled using phalloidin conjugated to Alexa 488 and cholera toxin conjugated to Alexa 555 (Invitrogen).
Image analysis
Images were processed using Zeiss LSM Image Browser ver 5.00 for fixed cells and saved as Tiff files. They were then exported as single channel 8-bit files to Metamorph software (version 5.0, Molecular Devices) for co-localization analysis. Results for at least five different cells were averaged for each condition. For each cell, images were acquired using a multitrack sequence in z-stacks with similar settings. The mean correlation coefficient between two channels from three entire planes of z-stack (top, central and bottom) was calculated after the threshold was set, by exporting values to Microsoft Excel 2003. Calcium influx was measured after 1 min of stimulation using Metamorph to conduct a line scan for fluorescent intensity throughout the cells. At least five cells were measured for each conditions; one representative cell is shown in the Results section.
Cytoneme formation was quantified by importing the time-lapse image files to Volocity 4.4.0 Build 71 from Improvision (Perkin Elmer, Waltham, MA, USA). Independent events were analyzed in three dimensions from time-lapse sequences by preparing measurement protocols. Criteria related to cytoneme formation included tracks formed, distance traveled by a particular track, length, speed and content (objects). Measurement tables were exported from Volocity to Microsoft Excel 2003 for further analysis. The total volume of all the objects for each time point was calculated and charts were plotted by selecting tracks corresponding to cytonemes at a given time point. Use of dark field transmission prevented confounding artifacts.
Data analysis
Co-localization between different markers was analyzed using Metamorph software by determining the correlation coefficient in five different cells in each condition. All correlation coefficient analysis was done on the surface of the cells when FcεRI was involved. For cytoneme visualization, the bottom slice of the z-stack was used. For all other markers, the entire z-stack (top, central and bottom) of the cell between different channels was used for analysis. All data are expressed as the mean ± SEM, and the comparisons between different treatments were analyzed for statistical significance by one-way analysis of variance with the Tukey's multiple comparison test using Graphpad Prism 5. Differences with P values ≤ 0.05 were considered to be statistically significant.
Results
Distribution of FcεRI, CCR1 and membrane raft on mast cells after stimulation
We have recently shown Ca2+ influx and degranulation to a greater extent upon stimulation of BMMC with antigen and MIP-1α together than with antigen or MIP-1α alone. To explore the mechanisms behind this synergy, we examined the spatial arrangement of FcεRI and CCR1 on the mast cell plasma membrane. We used adherent RBL-2H3 and CCR1-transfected RBL-2H3 cells (RBL-CCR1 cells) as controls. In resting RBL-2H3 cells, FcεRI (green) was found at the cell membrane not co-localized with GM1 (red, Fig. 1A, left panel). After IgE sensitization, FcεRI localized within membrane rafts (Fig. 1A, middle panel, yellow; correlation coefficient 0.57), and both FcεRI and the rafts were widely distributed in the membrane. After 5 min of cross-linking with IgE-specific antigen, we observed large patches where FcεRI co-localized with lipid rafts (yellow) moved toward one edge of the cell (Fig. 1A, right panel). Some small dispersed rafts were internalized.
Fig. 1.


CCR1+ BMMC co-stimulated with FcεRI- and CCR1-specific ligands develop GM1-rich cytonemes. Mast cells were kept resting, sensitized overnight, cross-linked with antigen for 5 min or co-stimulated with antigen and MIP-1α for 5 min. Cells were immunostained for FcεRI (green), CCR1 (blue) and GM1 (red). Co-localization between raft-FcεRI-CCR1 (white), raft-CCR1 (magenta), FcεRI-CCR1 (cyan) and raft-FcεRI (yellow) is observed upon stimulation. Best representative co-localizations in particular stimulation conditions are shown here using top (FcεRI, CCR1 and GM1), central or bottom planes (cytonemes). (A) CCR1− RBL-2H3 control cells showing distribution of FcεRI and GM1 in resting, sensitized and cross-linked conditions. (B) CCR1+ RBL-2H3 cells (RBL-CCR1) showing distribution of FcεRI, CCR1 and GM1 in resting, sensitized, cross-linked and co-stimulated conditions. The circle highlights a membrane ruffle, and the arrows indicate cytoneme-like structures. (C) BMMC showing distribution of FcεRI, CCR1 and GM1 in resting, sensitized, cross-linked and co-stimulated conditions.
In resting RBL-CCR1 cells, FcεRI (green), CCR1 (blue) and membrane rafts (red) were again evenly distributed and co-localized (Fig. 1B, left panel). FcεRI and CCR1 were found to be highly co-localized (cyan, correlation coefficient 0.63) on the surface, whereas FcεRI-raft co-localization and CCR1-raft co-localization (yellow and magenta, respectively) occurred less frequently. After IgE sensitization (Fig. 1B, top right panel), CCR1 and FcεRI were clearly segregated. CCR1 was internalized in a diffused pattern (orthogonal view), and FcεRI moved within lipid rafts (correlation coefficient 0.42; Table 1) in a diffused pattern. No FcεRI+GM1+ clusters were observed, and the cell remained intact.
Table 1.
Mean correlation coefficients for FcεRI, CCR1 and GM1 colocalization
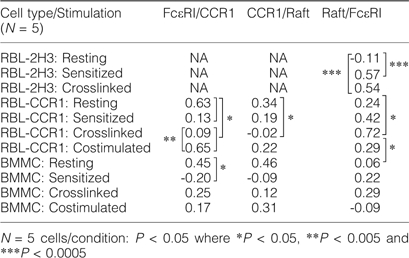 |
When RBL-CCR1 cells were cross-linked with IgE-specific antigen to stimulate FcεRI, we observed GM1+ raft distribution consistently around the flattened edges of cells (Fig. 1B, bottom left panel). CCR1 remained internalized, and very high co-localization was observed between the rafts and FcεRI (yellow, correlation coefficient 0.72; orthogonal view). In contrast, when cells were co-stimulated by cross-linking of IgE receptor and with MIP-1α, co-localized raft-FcεRI–CCR1 (white), raft-CCR1 (magenta) and FcεRI–CCR1 (cyan) were observed but not raft-FcεRI (yellow; Fig. 1B, bottom right panel). FcεRI and CCR1 were highly co-localized (correlation coefficient 0.65). Release of co-localized FcεRI–CCR1 (cyan) aggregates was significantly higher with co-stimulation, but the aggregates were smaller than those released with cross-linking alone. Distinct raft distribution at the leading edge was similar for co-stimulation and cross-linking alone. It is important to point out that FcεRI distribution is on the surface. In z-stacks further toward the center of the cell, FcεRI distribution was not observed. Due to limitations of space, only the surface z-planes are shown in Fig. 1B, but Table 1 describes the co-localization results in-depth.
Unsensitized resting BMMC showed diffuse distribution of CCR1 (blue), rafts (red) and FcεRI clusters (green) on the surface of the cell (Fig. 1C, top left panel). Interestingly, sensitized BMMC showed internalization of CCR1 (Fig. 1C, top right panel, blue) similar to that observed with RBL-CCR1 cells (Fig. 1B, top right panel). High FcεRI-raft co-localization was observed only with IgE-specific cross-linking in BMMC (Fig. 1C, middle panel, yellow, orthogonal view). Cross-linked BMMC formed numerous membrane blebs positive for rafts, often containing FcεRI and/or CCR1 clusters. FcεRI-rafts co-localized (yellow) on the membrane and a few FcεRI–CCR1 co-localized clusters (cyan) were observed at the edge of the blebs. CCR1-raft co-localization (magenta) was evident (Fig. 1C, right panel). In cross-linked BMMC, FcεRI and rafts co-localized (yellow), which is consistent with both the control cell types and the enormous bleb formation. Ratios of co-localization for each cell type and condition differed, however (Table 1). Cross-linking-induced co-localization of rafts and FcεRI may lead to cytoskeletal rearrangements forming membrane blebs.
To our surprise, after co-stimulating for 5 min, BMMC extended streaks of GM1+ membrane fragments toward neighboring cells (Fig. 1C, right panel, arrowheads). Enhanced flattening, membrane ruffling and FcεR1–CCR1-raft co-localization (white) at the cell surface were also observed. The GM1+ extensions—fine thread-like structures ∼100 μm in length, often forming connecting networks between adjacent cells—were similar in appearance to cytonemes, tunneling nanotubes communication structures that have been described for many immune cells. For this study, we define cytonemes or tunneling nanotube-like structures as continuous cellular extensions >50 μm in length, formed within 5 min of stimulation, that physically connect to a neighboring cell. These cytoneme-like extensions were observed only with BMMC and only in response to co-stimulation with antigen and MIP-1α. They were not observed with RBL-2H3 cells or RBL-CCR1 cells.
Cytonemes and Ca2+ influx after mast cell stimulation
To further correlate cytoneme formation with mast cell activation, we examined Ca2+ influx following co-stimulation of BMMC. We previously reported a significant increase in overall Ca2+ influx when BMMC were co-stimulated then cross-linked (14). Here, we examined the Ca2+ distribution upon stimulation. Using Fluo-3 AM dye for live imaging, we observed Ca2+ influx with cross-linked and co-stimulated BMMC (Fig. 2A). With cross-linking, a low but steady increase in Ca2+ was observed; in contrast, co-stimulation resulted in fluctuating Ca2+ influx (Fig. 2A, right panel). The distinct Ca2+ localization patterns observed for cross-linked and co-stimulated BMMC may represent the overall increase in Ca2+ influx for co-stimulated BMMC that we previously reported (14).
Fig. 2.


Costimulation of BMMC results in Ca2+ accumulation at random points and formation of cytonemes. (A) Accumulation of intracellular calcium in BMMC that were resting (i), sensitized (ii), crosslinked with antigen for 1 min (iii), and costimulated with antigen and MIP-1α (iv). Live cells were visualized using fluorescent Fluo-3 AM dye, which specifically binds to Ca2+ (clusters). Line graphs showing signal intensity are also provided. (B) Cytoneme formation by CCR1+ BMMC after 5 min of costimulation. Calcium is shown in red, and cytoneme-like networks (CLN) connect neighboring cells. The right panel is an enlargement of cell #2. The circle encompasses the cell border, and the arrow indicates a cytoneme origination point. (C) Granule accumulation at the membrane and in cytonemes of costimulated cells. BMMC that were resting or stimulated for 1 min with antigen and MIP-1α were cut into 1 μm sections and stained with 0.1% toluidine blue. Granules can be observed both within the cytoplasm and within the cell extensions (arrows).
We next examined Ca2+ influx and cytoneme formation after 5 min of stimulation. Cytoneme-like networks formed between neighboring BMMC in co-stimulated samples (Fig. 2B) but not in cross-linked samples (data not shown). Interestingly, the cytonemes made by co-stimulated BMMC appeared to originate from the areas of the cytoplasm where Ca2+ (red) accumulated (Fig. 2B, right panel, arrowhead). Cytonemes varied in size; in the cell network shown in Fig. 2B, cytoneme length ranged from 80 to 150 μm, though not all cells were connected with cytonemes.
To determine if the cytonemes contained cytoplasm, we stained 1-μm thick sections of resting BMMC and BMMC co-stimulated for 1 min with 0.1% toluidine blue. We observed cytoskeletal extensions in co-stimulated mast cells with toluidine blue metachromatic proteoglycan-positive granules (Fig. 2C, arrowheads), suggesting that the cytonemes might carry and transport granule contents from mast cells.
Distribution of F-actin and lipid-raft in mast cells after co-stimulation
To further understand BMMC cytoneme structure and formation, we next examined distribution of F-actin and lipid rafts using phalloidin and antibodies to GM1, respectively. F-actin (green) and GM1 (red) were found throughout the membrane in RBL-2H3 (Fig. 3A) and RBL-CCR1 (Fig. 3B) cells at rest, sensitized and cross-linked. Cross-linking of RBL-2H3 cells (Fig. 3A, panel iii) and RBL-CCR1 cells (Fig. 3B, panel iii) resulted in few F-actin extensions (arrowheads). Cross-linked BMMC, in contrast, produced numerous F-actin-rich membrane protrusions (Fig. 3C, panel iii). Co-stimulation resulted in pronounced membrane ruffling and polarization of F-actin localization in RBL-CCR1 cells and BMMC (Fig. 3B, panel iv and Fig. 3C, panel iv). GM1+ rafts (red) in stimulated BMMC were found at various points in the F-actin-rich extensions (Fig. 3C, panels iii and iv). GM1+ clusters within the cytonemes may demonstrate transport of membrane rafts. Co-localization of F-actin and GM1+ raft was significantly increased in co-stimulated BMMC compared with resting BMMC (Fig. 3D).
Fig. 3.

BMMC cytonemes are F-actin rich and contain clusters of GM1+ lipid rafts. Mast cells were kept resting, sensitized overnight, cross-linked with antigen for 5 min or co-stimulated with antigen and MIP-1α for 5 min. Cells were permeabilized and stained for F-actin with phalloidin-Alexa 488 (green) and GM1 with cholera toxin-Alexa 555 (red). (A) RBL-2H3 cells showing distribution of F-actin and GM1 in (i) resting, (ii) sensitized and (iii) cross-linked conditions. The arrow indicates a cytoneme. (B) RBL-CCR1 cells showing distribution of F-actin and GM1 in (i) resting, (ii) sensitized, (iii) cross-linked and (iv) co-stimulated conditions. The arrows indicate cytonemes and the circle contains a cellular bleb. (C) BMMC showing distribution of F-actin and GM1 in (i) resting, (ii) sensitized, (iii) cross-linked and (iv) co-stimulated conditions. The arrows indicate cytonemes. (D) Mean correlation coefficients between F-actin and GM1+ rafts, as calculated from three random regions in each cell for five independent cells per condition. Error bars show SEM, *P < 0.05.
Time-lapse analysis of cytoneme formation
To examine the physical process of cytoneme formation following mast cell co-stimulation, we employed time-lapse microscopy. BMMC were plated at very low density (100 cells per 25 cc flask) and treated with antigen and MIP-1α and then one cell was monitored for 25 min. Cytonemes were assembled in two different directions from the cell, and by the end of the time, the cell was flattened with much of its contents contained in the cytonemes (Fig. 4A and Supplementary Video 1, available at International Immunology Online). Quantitative analysis of time-lapse was performed at different time points to determine the objects and tracks produced by the two cytonemes. The maximum cytoneme distances were 469.1 and 75.9 μm, with assembly velocities of 2.25 and 1.75 μm s−1, respectively, for the cytonemes found at the 2 o'clock and 10 o'clock positions at the cell (Fig. 4B, Table 2).
Fig. 4.

BMMC cytonemes extend in different directions following co-stimulation. Cytoneme formation from live, scattered, sensitized BMMC growing in a 25 cc tissue culture flask was captured immediately after addition of antigen and MIP-1α using dark field transmission on a spinning-disc confocal microscope and Volocity acquisition. (A) Image of a costimulated BMMC producing cytonemes in two different directions, at 2 O'clock and 10 O'clock, derived from a 26 min. time lapse video. (B) Tracks produced by each cytoneme (lines), and objects carried by these tracks (triangles) were determined using Volocity (Improvision, Perkin Elmer) quantitation. The analysis table summarizes the measurement protocols used for 3D analysis.
Table 2.
Four Dimensional analysis of cytoneme tracks and objects trapped in cytonemes after costimulation
| Number of objects | Number of Tracks | Length of longest track (μm) | |
| 2 o'clock cytoneme | 50297 | 1689 | 469.139000 |
| 10 o'clock cytoneme | 5381 | 251 | 75.879000 |
| Time span (sec) | Track Velocity (μm/sec) | Displacement (μm) | Displacement rate (μm/sec) | Meandering index | |
| 2 o'clock cytoneme longest track | 208 | 2.25 | 383.09 | 1.84 | 0.816 |
| 10 o'clock cytoneme longest track | 43 | 1.74 | 46.26 | 1.07 | 0.609 |
Effects of membrane raft depletion on mast cell function
We next sought to understand the role of cholesterol during co-stimulation of FcεRI and CCR1 in mast cells when a CCR is involved. We selectively depleted cholesterol from the membrane using MβCD, then examined BMMC activation as well as distribution of FcεRI, CCR1 and F-actin. Cholesterol-depleted mast cells showed a significant increase in β-hexosaminidase activity compared with cholesterol-containing counterparts when resting, sensitized, treated with MIP-1α or co-stimulated (Fig. 5A). In contrast, cholesterol depletion resulted in a significant decrease in β-hexosaminidase activity for BMMC challenged with IgE-specific antigen (Fig. 5A). The presence of cholesterol is therefore, needed for optimal antigen-mediated signaling but not for optimal MIP-1α-mediated degranulation. Similar results were observed with another cholesterol-sequestering compound Filipin III (data not shown).
Fig. 5.

Cholesterol is required for optimal antigen-mediated signaling but not for optimal co-stimulation or relocalization of internalized CCR1 to the surface of BMMC. (A) Cholesterol was depleted from BMMC by treating resting and sensitized cells with 10 mM MβCD for 30 min at 37°C in serum-free buffer. Cells were washed twice and stimulated as appropriate for 30 min at 37°C and then degranulation was assessed by measuring β-hexosaminidase activity. Means shown were calculated from three independent experiments performed in triplicates. P < 0.05, where **P < 0.005 and ***P < 0.0005. (B) Control BMMC (left panels) or BMMC cholesterol depleted with MβCD (right panels) stained for F-actin (green) and GM1+ rafts (red) in (i) resting, (ii) sensitized, (iii) cross-linked and (iv) co-stimulation conditions. CCR1 [blue, (v) only] relocalized to the cell surface after cholesterol depletion. The arrow indicates a cytoneme.
Cyotoneme production, too, was affected by cholesterol depletion. The F-actin cytoskeleton was diminished in cholesterol depleted resting BMMC (Fig. 5B panel i, right), and the polarity of F-actin distribution observed in control sensitized cells (Fig. 5B panel ii, left) was largely absent from the MβCD-treated cells (Fig. 5B, panel ii, right). After 5 min of cross-linking, neither membrane ruffling blebs nor cell polarity was observed for MβCD-treated BMMC (Fig. 5B, panel iii, right), in contrast to the results for cross-linked control cells (Fig. 5B, panel iii, left). Little production of F-actin-negative cytonemes was seen with co-stimulated mast cells that were cholesterol depleted (Fig. 5B, panel iv central); indeed, analysis of these cells (50 cells per experiment, counted in triplicate) demonstrated that only 5% were able to polarize (data not shown). The majority of cholesterol depleted, co-stimulated BMMC lacked F-actin polarization, membrane ruffling, pseudopodia and cytonemes (Fig. 5B, panel iv, right). GM1+ rafts were observed in all conditions (Fig. 5, red). Interestingly, MβCD treatment resulted in pronounced raft clustering in resting cells (Fig. 5B, panel i, right), an effect not seen with the various stimulation conditions.
We also examined the movement of CCR1 after cholesterol depletion. Fig. 5B (panel v, right) shows that CCR1 relocalized to the membrane when sensitized cholesterol-depleted BMMC were challenged with IgE-specific antigen similarly as of the control (Fig. 5B panel v, left) without cholesterol depletion.
Effects of actin sequestration on raft distribution and mast cell function
Assembly of G-actin subunits during dynamic cellular changes leads to formation of filamentous (F)-actin. Staining of mast cells with fluorescent phalloidin, which binds F-actin but not G-actin, demonstrated that F-actin is associated with cytoneme/nanotube formation (Fig. 3). To determine if this cytoskeletal protein is essential for formation of the cell extensions, BMMC were treated with LatA, a G-actin-sequestering compound. Before LatA treatment, F-actin was localized to the membrane of resting, sensitized and stimulated cells (Fig. 5B, panels i–iv). After treatment with 250 ng ml−1 LatA, F-actin (green) accumulated in the nucleus of the BMMC in all conditions (Fig. 6A). A decrease in lipid raft distribution (red) at the membrane and increased internalization were also observed for resting and sensitized BMMC after LatA treatment, as shown by intensity distribution using deconvolution images, though no nuclear accumulation of rafts was observed (Fig. 6C).
Fig. 6.


Treatment of mast cells with LatA results in altered F-actin localization, diminished membrane expression of rafts and F-actin, and impaired F-actin+ cytoneme formation. (A) Effects of LatA treatment on F-actin, GM1 localization, and cell morphology, in BMMC. BMMC were treated with 250 ng/ml of Latrunculin A for 45 min, then left unstimulated (i), sensitized overnight (ii), sensitized and cross-linked with antigen for 5 min (iii) or sensitized and stimulated with antigen and MIP-1α for 5 min (iv). After permeabilization using 0.1% triton X100, cells were stained for F-actin using phalloidin-Alexa 488 and for GM1+ rafts using cholera toxin-Alexa 555. Differential-interference-contrast (DIC) images are also provided to show the nuclear structure. N, nucleus. (B) Sensitized RBL-CCR1 cells, untreated and treated with LatA. The untreated cells (top left panel) display typical basophil morphology and lack cytonemes. Cells treated with LatA (top right panel) lack typical basophil cytoskeleton morphology, and instead display cell swelling and small radial elongations (not cytonemes). Cross-linked or costimulated BMMC treated with LatA (bottom panels) failed to produce directional cytoneme extensions (>50 μm) and instead formed short branched extensions. Cells were stained for F-actin (phalloidin) and GM1 as described above. The proportion of cells producing cytonemes, shown in the graph, was determined by manually examining 30 cells/condition in 3 separate experiments. ***,P< 0.0005. (C) Effects of LatA treatment on F-actin and GM1 intensity in unsensitized and sensitized BMMC. Resting BMMC without and with Lat A treatment, and sensitized BMMC without and with LatA treatment were stained for F-actin using phalloidin-Alexa 488 (a, b, c, d respectively) and GM1 using cholera toxin-Alexa-555 (a', b', c', d'), respectively. Deconvolution images were created using Metamorph image analysis. Simultaneous 3D intensity distribution is also shown.
Cytoneme formation was significantly diminished after LatA treatment (Fig. 6B, graph). Only 35% of LatA-treated BMMC formed cytonemes in response to co-stimulation, as opposed to 83% of non-LatA-treated co-stimulated BMMC (P < 0.05). Cytonemes produced by BMMC after LatA treatment and co-stimulation were less straight, more branched and shorter (Fig. 6B bottom right panel) than their non-LatA-treated counterparts. Similarly, formation of F-actin extensions following cross-linking of sensitized LatA-treated BMMC was significantly decreased compared with their non-LatA-treated counterparts (Fig. 6B, graph, 30 versus 65%; P < 0.05). The F-actin extension patterns displayed uneven radial distribution throughout the cytoskeleton (Fig. 6B bottom left panel). These crooked and branched cytonemes contained F-actin and GM1+ membrane rafts at their tips and buds. Cell shape was also changed for LatA-treated sensitized RBL-CCR1 cells compared with non-LatA-treated sensitized cells (Fig. 6B upper, left panel versus right panel). LatA treatment resulted in swelling and loss of cell polarity with the RBL-CCR1 cells; nuclear accumulation of F-actin was not observed (Fig. 6B upper, right panel). To determine if G-actin sequestration might affect degranulation of mast cells, we assessed β-hexosaminidase activity for LatA-treated BMMC. No significant change was observed (data not shown).
Overall, our data show that cross talk between CCR1, FcεRI and membrane rafts affects degranulation in mast cells and that cytonemes may facilitate cell–cell communication.
Discussion
This study is the first to report that mast cells produce intercellular connections and that mediators are directionally released upon co-stimulation of FcεRI and CCR1. We have previously shown that BMMC express CCR1 and that FcεRI–CCR1 co-stimulation causes a significant increase in histamine release, Ca2+ influx and release of transforming growth factor β-1 and IL-6 compared with stimulation of either receptor alone (14). In this study, we further examined the effects of FcεRI–CCR1 co-stimulation by examining the localization of these receptors and other membrane structures on BMMC and by determining the importance of membrane re-organization for mast cell activity.
BMMC sensitization—even without receptor stimulation—resulted in CCR1 internalization and FcεRIα/lipid raft co-localization. This may be due to the close physical association that we observed between FcεRI and CCR1 in resting cells. The close proximity might cause IgE–FcεRI binding to affect CCR1. Sensitization alone does not result in Ca2+ influx or degranulation but sensitization followed by cross-linking or co-stimulation results in increased Ca2+ influx and degranulation (14). In this study, Ca2+ influx was observed in real-time, reveling that transient changes occur following co-stimulation but not cross-linking. Transient Ca2+ influx has also been observed when human embryonic kidney cells were treated with CCR1 and MIP-1α (15). MacGlashan (16) observed transient Ca2+ changes upon stimulation of rat peritoneal mast cells with IgE-specific antigen, though this response did not occur with human lung mast cells. Differences in tissue origin or species may therefore influence the Ca2+ responses to mast cell stimulation.
After stimulation of FcεRI, we observed bleb formation and co-localization of this receptor with GM1+ lipid rafts and with CCR1. Holowka et al. (10), too, have observed that cross-linking of mast cell IgE–FcεRI complexes causes their association with detergent-resistant membranes (lipid rafts) in a cholesterol-dependent manner. IgE-specific stimulation may cause some of the internalized CCR1 to be recycled back to the membrane, a pathway similar to that reported to CCR5 (17) and CXCR3 (18). FcεRI cross-linking has previously been shown to cause internalization of FcεRIα and gangliosides from lipid rafts in RBL-2H3 cells (8), and aggregated FcεRI has been found in the lipid raft fractions of RBL-2H3 cell lysates (19). Although direct association of FcεRI with CCR1 has yet to be reported, others have observed physical association and functional interactions between different receptor families, for example the G-protein-coupled receptor dopamine D1 and the γ-aminobutyric acid receptor (20).
Following co-stimulation of FcεRI and CCR1, the FcεRI–CCR1-lipid raft clusters dissociated. CCR1 continued to co-localize with the rafts, which in turn moved into the pseudopods, membrane ruffles and cytonemes of the activated cells, whereas FcεRI no longer co-localized with the GM1+ rafts. These findings suggest that CCR1 is a highly mobile molecule: it can be internalized by monomeric IgE in mast cells, relocalized back to membrane upon FcεRI cross-linking and moved to lipid rafts on the membrane in the presence of MIP-1α. It is not known if CCR1 changes its forms during these movements, e.g. between monomers and dimers, or if this movement is a response to IgE-specific binding. Multiple conformational states have been reported for CCR5 (21).
To determine if the FcεRI association with lipid rafts was important for cell function, we depleted cholesterol from the membranes. Cholesterol depletion can significantly decrease clusters of GM1+ microdomains (22), and incorporation of cholesterol into lipid rafts has been shown to activate mast cells (23). Indeed, cholesterol depletion resulted in a significant decrease in β-hexosaminidase activity, Ca2+ influx (data not shown) and formation of F-actin+ cell extensions in cross-linked BMMC, though these functions were not disrupted in co-stimulated cells. Gidwani et al. (24), too, have shown that lipid raft disruption inhibits IgE-FcεRI signaling. Thus, membrane raft cholesterol is an important factor for activation and signaling events in mast cells. Membrane structure may play an important role in keeping mast cells in a resting or sensitized state. An increase in β-hexosaminidase activity was observed for resting, sensitized and co-stimulated BMMC that were cholesterol depleted, although no change in Ca2+ influx was observed. This is not surprising, given that RBL mast cells defective for FcεRI signaling and lipid raft biosynthesis show robust tyrosine phosphorylation and degranulation upon stimulation, in the absence of a sustained Ca(2+) response (25).
The observation of cytoneme-like nanotube tunneling following co-stimulation of FcεRI and CCR1 was particularly exciting, as this is the first report of tubule formation by mast cells and involvement of CCR activation in cytoneme formation. F-actin+ nanotubes have been described for myeloid cells, T-cells and NK cells (26) but not for mast cells. The structures observed in our study are similar in morphology to the cytonemes originally described by Ramirez-Weber et al. (27) and recently reviewed by Sherer et al. (28) and might similarly be used for vesicle transport, morphogenesis and signaling. The tubules may be used for intercellular communication. We previously showed that these cells express intercellular adhesion molecule 1 and neurokinin (14). Neurokinin is an important communication marker (29), and both cell adhesion and cell-matrix proteins belong to a subclass of intercellular communication molecules (28, 30). The GM1 molecules expressed in the cytonemes might also be signaling components (31). The granules that we observed within the cytoneme-like structures (Fig. 2C) might also be indicative of intercellular transport and communication.
Co-stimulation resulted in very high Ca2+ influx at random regions of the cell within 1 min. Cytonemes are formed at these points of Ca2+ accumulation within 5 min of stimulation, suggesting that formation of cytonemes is dependent on CCR1 activation and Ca2+ accumulation. The previous reports describing cytonemes did not address the molecular mechanisms of cytoneme formation (27, 32, 33), though Hsiung et al. (34) did correlate the orientation of cytonemes with decapentaplegic signaling. Our data demonstrate that FcεRI–CCR1 signaling leads to formation of cytonemes from regions of Ca2+ accumulation, allowing transport of raft molecules and granule/vesicle content.
Since F-actin is an important element of the cytoneme, we examined the role of this protein in mast cell morphology and function. Treatment of BMMC with LatA, which sequesters G-actin, resulted in F-actin accumulation in the nucleus and a significant decrease in cytoneme formation. Others have also reported nuclear accumulation of F-actin following sequestration (35), though in this study LatB was used. Sequestration of G-actin in BMMC had no significant effect on β-hexosaminidase activity or Ca2+ influx. This is not surprising, given that actin is not essential for calcium-triggered vesicle fusion (36). These results are in contrast to those of Frigeri et al. (37), who observed enhanced cross-linking-mediated degranulation in mast cells following Lat treatment. The RBL-2H3 cells used in that study did not express CCR1, however. Our results suggest that F-actin+ cytonemes are not required for cell functions, such as histamine release, although they may be important for intercellular communication.
The process of cytoneme formation remains poorly understood. Cholesterol depletion reduced the formation of cytonemes in response to BMMC co-stimulation. Lipid rafts may therefore participate in cytoneme formation in mast cells, either by promoting membrane integrity or by participating in cell signaling, functions that have previously been described for these structures (32,38). Langridge et al. (39) demonstrated that cell bleb formation in Dictyostelium involves hydrostatic pressure, chemoattractant stimulation, F-actin regulation and re-distribution of cytoplasm and plasma membrane components. We observed similar distributions and changes following co-stimulation of BMMC, suggesting that cytoneme formation might be the result of hydrostatic pressure driving pseudopod extensions of internal membranes.
Our findings suggest new roles for receptor localization, lipid rafts and F-actin in mast cell signaling and cell–cell communication. This study raises a variety of interesting questions. How and why CCR1 is internalized by IgE? How and why are cytonemes formed upon co-stimulation? What is the exact role of receptor internalization and cytoneme formation in mast cell function? Do other CCRs have similar effects on mast cells? Further research into mast cell responses to chemokines may better define the pathogenesis of allergic responses and offer novel targets for immunotherapies.
Supplementary data
Supplementary Video 1 is available at International Immunology Online.
Funding
Dobbs Foundation grant to S. J. O.; Wellcome Trust grant to F. B.
Supplementary Material
Acknowledgments
We would like to thank John Crenshaw for technical assistance in capturing images using the Olympus Fluoview™ FV1000; Scott Randall for technical assistance with capturing time-lapse images using a dark-field, spinning disc, confocal microscope; Dr Ricardo Richardson for providing RBL-hCCR1 cells; Dr Adam Marcus, director of the Emory Winship Confocal Microscopy core facility, for his support; Butch Granada assisted with data analysis and Dr Anne Goodwin assisted with manuscript writing.
References
- 1.Kawakami T, Galli SJ. Regulation of mast-cell and basophil function and survival by IgE. Nat. Rev. Immunol. 2002;2:773. doi: 10.1038/nri914. [DOI] [PubMed] [Google Scholar]
- 2.Henz BM, Maurer M, Lippert U, Worm M, Babina M. Mast cells as initiators of immunity and host defense. Exp. Dermatol. 2001;10:1. doi: 10.1034/j.1600-0625.2001.100101.x. [DOI] [PubMed] [Google Scholar]
- 3.Taylor ML, Metcalfe DD. Mast cells in allergy and host defense. Allergy Asthma Proc. 2001;22:115. doi: 10.2500/108854101778148764. [DOI] [PubMed] [Google Scholar]
- 4.Pulendran B, Ono SJ. A shot in the arm for mast cells. Nat. Med. 2008;14:489. doi: 10.1038/nm0508-489. [DOI] [PubMed] [Google Scholar]
- 5.Metcalfe DD, Baram D, Mekori YA. Mast cells. Physiol. Rev. 1997;77:1033. doi: 10.1152/physrev.1997.77.4.1033. [DOI] [PubMed] [Google Scholar]
- 6.Bachelet I, Levi-Schaffer F. Mast cells as effector cells: a co-stimulating question. Trends Immunol. 2007;28:360. doi: 10.1016/j.it.2007.06.007. [DOI] [PubMed] [Google Scholar]
- 7.Draber P, Draberova L. Lipid rafts in mast cell signaling. Mol. Immunol. 2002;38:1247. doi: 10.1016/s0161-5890(02)00071-8. [DOI] [PubMed] [Google Scholar]
- 8.Oliver C, Fujimura A, Silveira ESAM, Orlandini de Castro R, Siraganian RP, Jamur MC. Mast cell-specific gangliosides and FcεRI follow the same endocytic pathway from lipid rafts in RBL-2H3 cells. J. Histochem. Cytochem. 2007;55:315. doi: 10.1369/jhc.6A7037.2006. [DOI] [PubMed] [Google Scholar]
- 9.Jahn T, Leifheit E, Gooch S, Sindhu S, Weinberg K. Lipid rafts are required for Kit survival and proliferation signals. Blood. 2007;110:1739. doi: 10.1182/blood-2006-05-020925. [DOI] [PMC free article] [PubMed] [Google Scholar]
- 10.Holowka D, Sheets ED, Baird B. Interactions between FcεRI and lipid raft components are regulated by the actin cytoskeleton. J. Cell Sci. 2000;113 doi: 10.1242/jcs.113.6.1009. (Pt 6):1009. [DOI] [PubMed] [Google Scholar]
- 11.Ono SJ, Nakamura T, Miyazaki D, Ohbayashi M, Dawson M, Toda M. Chemokines: roles in leukocyte development, trafficking, and effector function. J. Allergy Clin. Immunol. 2003;111:1185. doi: 10.1067/mai.2003.1594. quiz 1200. [DOI] [PubMed] [Google Scholar]
- 12.Toda M, Dawson M, Nakamura T, et al. Impact of engagement of FcεRI and CC chemokine receptor 1 on mast cell activation and motility. J. Biol. Chem. 2004;279:48443. doi: 10.1074/jbc.M408725200. [DOI] [PubMed] [Google Scholar]
- 13.Miyazaki D, Nakamura T, Toda M, Cheung-Chau KW, Richardson RM, Ono SJ. Macrophage inflammatory protein-1α as a costimulatory signal for mast cell-mediated immediate hypersensitivity reactions. J. Clin. Investig. 2005;115:434. doi: 10.1172/JCI18452. [DOI] [PMC free article] [PubMed] [Google Scholar]
- 14.Fifadara NH, Aye CC, Raghuwanshi SK, Richardson RM, Ono SJ. CCR1 expression and signal transduction by murine BMMC results in secretion of TNF-alpha, TGFbeta-1 and IL-6. Int. Immunol. 2009;21:991. doi: 10.1093/intimm/dxp066. [DOI] [PMC free article] [PubMed] [Google Scholar]
- 15.Onuffer J, McCarrick MA, Dunning L, et al. Structure function differences in nonpeptide CCR1 antagonists for human and mouse CCR1. J. Immunol. 2003;170:1910. doi: 10.4049/jimmunol.170.4.1910. [DOI] [PubMed] [Google Scholar]
- 16.MacGlashan D., Jr. Single-cell analysis of Ca++ changes in human lung mast cells: graded vs. all-or-nothing elevations after IgE-mediated stimulation. J. Cell Biol. 1989;109:123. doi: 10.1083/jcb.109.1.123. [DOI] [PMC free article] [PubMed] [Google Scholar]
- 17.Mueller A, Kelly E, Strange PG. Pathways for internalization and recycling of the chemokine receptor CCR5. Blood. 2002;99:785. doi: 10.1182/blood.v99.3.785. [DOI] [PubMed] [Google Scholar]
- 18.Meiser A, Mueller A, Wise EL, et al. The chemokine receptor CXCR3 is degraded following internalization and is replenished at the cell surface by de novo synthesis of receptor. J. Immunol. 2008;180:6713. doi: 10.4049/jimmunol.180.10.6713. [DOI] [PMC free article] [PubMed] [Google Scholar]
- 19.Fattakhova G, Masilamani M, Borrego F, Gilfillan AM, Metcalfe DD, Coligan JE. The high-affinity immunoglobulin-E receptor (FcεRI) is endocytosed by an AP-2/clathrin-independent, dynamin-dependent mechanism. Traffic. 2006;7:673. doi: 10.1111/j.1600-0854.2006.00423.x. [DOI] [PubMed] [Google Scholar]
- 20.Salter MW. D1 and NMDA receptors hook up: expanding on an emerging theme. Trends Neurosci. 2003;26:235. doi: 10.1016/S0166-2236(03)00081-X. [DOI] [PubMed] [Google Scholar]
- 21.Lee B, Sharron M, Blanpain C, et al. Epitope mapping of CCR5 reveals multiple conformational states and distinct but overlapping structures involved in chemokine and coreceptor function. J. Biol. Chem. 1999;274:9617. doi: 10.1074/jbc.274.14.9617. [DOI] [PubMed] [Google Scholar]
- 22.Fujita A, Cheng J, Hirakawa M, Furukawa K, Kusunoki S, Fujimoto T. Gangliosides GM1 and GM3 in the living cell membrane form clusters susceptible to cholesterol depletion and chilling. Mol. Biol. Cell. 2007;18:2112. doi: 10.1091/mbc.E07-01-0071. [DOI] [PMC free article] [PubMed] [Google Scholar]
- 23.Baumruker T, Csonga R, Pursch E, et al. Activation of mast cells by incorporation of cholesterol into rafts. Int. Immunol. 2003;15:1207. doi: 10.1093/intimm/dxg120. [DOI] [PubMed] [Google Scholar]
- 24.Gidwani A, Brown HA, Holowka D, Baird B. Disruption of lipid order by short-chain ceramides correlates with inhibition of phospholipase D and downstream signaling by FcεRI. J. Cell Sci. 2003;116:3177. doi: 10.1242/jcs.00621. [DOI] [PubMed] [Google Scholar]
- 25.Field KA, Apgar JR, Hong-Geller E, Siraganian RP, Baird B, Holowka D. Mutant RBL mast cells defective in FcεRI signaling and lipid raft biosynthesis are reconstituted by activated Rho-family GTPases. Mol. Biol. Cell. 2000;11:3661. doi: 10.1091/mbc.11.10.3661. [DOI] [PMC free article] [PubMed] [Google Scholar]
- 26.Davis DM, Sowinski S. Membrane nanotubes: dynamic long-distance connections between animal cells. Nat. Rev. Mol. Cell Biol. 2008;9:431. doi: 10.1038/nrm2399. [DOI] [PubMed] [Google Scholar]
- 27.Ramirez-Weber FA, Kornberg TB. Cytonemes: cellular processes that project to the principal signaling center in Drosophila imaginal discs. Cell. 1999;97:599. doi: 10.1016/s0092-8674(00)80771-0. [DOI] [PubMed] [Google Scholar]
- 28.Sherer NM, Mothes W. Cytonemes and tunneling nanotubules in cell-cell communication and viral pathogenesis. Trends Cell Biol. 2008;18:414. doi: 10.1016/j.tcb.2008.07.003. [DOI] [PMC free article] [PubMed] [Google Scholar]
- 29.Suzuki R, Furuno T, McKay DM, et al. Direct neurite-mast cell communication in vitro occurs via the neuropeptide substance P. J. Immunol. 1999;163:2410. [PubMed] [Google Scholar]
- 30.Elangbam CS, Qualls CW, Jr., Dahlgren RR. Cell adhesion molecules–update. Vet. Pathol. 1997;34:61. doi: 10.1177/030098589703400113. [DOI] [PubMed] [Google Scholar]
- 31.Harder T, Sangani D. Plasma membrane rafts engaged in T cell signalling: new developments in an old concept. Cell Commun. Signal. 2009;7:21. doi: 10.1186/1478-811X-7-21. [DOI] [PMC free article] [PubMed] [Google Scholar]
- 32.Gupta N, DeFranco AL. Visualizing lipid raft dynamics and early signaling events during antigen receptor-mediated B-lymphocyte activation. Mol. Biol. Cell. 2003;14:432. doi: 10.1091/mbc.02-05-0078. [DOI] [PMC free article] [PubMed] [Google Scholar]
- 33.Sherer NM, Lehmann MJ, Jimenez-Soto LF, Horensavitz C, Pypaert M, Mothes W. Retroviruses can establish filopodial bridges for efficient cell-to-cell transmission. Nat. Cell Biol. 2007;9:310. doi: 10.1038/ncb1544. [DOI] [PMC free article] [PubMed] [Google Scholar]
- 34.Hsiung F, Ramirez-Weber FA, Iwaki DD, Kornberg TB. Dependence of Drosophila wing imaginal disc cytonemes on Decapentaplegic. Nature. 2005;437:560. doi: 10.1038/nature03951. [DOI] [PubMed] [Google Scholar]
- 35.Pendleton A, Pope B, Weeds A, Koffer A. Latrunculin B or ATP depletion induces cofilin-dependent translocation of actin into nuclei of mast cells. J. Biol. Chem. 2003;278:14394. doi: 10.1074/jbc.M206393200. [DOI] [PubMed] [Google Scholar]
- 36.Hibbert JE, Butt RH, Coorssen JR. Actin is not an essential component in the mechanism of calcium-triggered vesicle fusion. Int. J. Biochem. Cell Biol. 2006;38:461. doi: 10.1016/j.biocel.2005.10.008. [DOI] [PubMed] [Google Scholar]
- 37.Frigeri L, Apgar JR. The role of actin microfilaments in the down-regulation of the degranulation response in RBL-2H3 mast cells. J. Immunol. 1999;162:2243. [PubMed] [Google Scholar]
- 38.Balasubramanian N, Scott DW, Castle JD, Casanova JE, Schwartz MA. Arf6 and microtubules in adhesion-dependent trafficking of lipid rafts. Nat. Cell Biol. 2007;9:1381. doi: 10.1038/ncb1657. [DOI] [PMC free article] [PubMed] [Google Scholar]
- 39.Langridge PD, Kay RR. Blebbing of Dictyostelium cells in response to chemoattractant. Exp. Cell Res. 2006;312:2009. doi: 10.1016/j.yexcr.2006.03.007. [DOI] [PubMed] [Google Scholar]
Associated Data
This section collects any data citations, data availability statements, or supplementary materials included in this article.