Abstract
The scaling properties of human EEG have so far been analyzed predominantly in the framework of detrended fluctuation analysis (DFA). In particular, these studies suggested the existence of power-law correlations in EEG. In DFA, EEG time series are tacitly assumed to be made up of fluctuations, whose scaling behavior reflects neurophysiologically important information and polynomial trends. Even though these trends are physiologically irrelevant, they must be eliminated (detrended) to reliably estimate such measures as Hurst exponent or fractal dimension. Here, we employ the diffusion entropy method to study the scaling behavior of EEG. Unlike DFA, this method does not rely on the assumption of trends superposed on EEG fluctuations. We find that the growth of diffusion entropy of EEG increments of awake subjects with closed eyes is arrested only after approximately 0.5 s. We demonstrate that the salient features of diffusion entropy dynamics of EEG, such as the existence of short-term scaling, asymptotic saturation, and alpha wave modulation, may be faithfully reproduced using a dissipative, first-order, stochastic differential equation—an extension of the Langevin equation. The structure of such a model is utterly different from the “noise+trend” paradigm of DFA. Consequently, we argue that the existence of scaling properties for EEG dynamics is an open question that necessitates further studies.
Keywords: EEG, Entropy, Statistical analysis
Introduction
A typical EEG time series appears to be a random superposition of waves with contributions from every part of the spectrum, from 0.5 to 150 Hz, appearing with fluctuating phases and variable amplitude. This impression was made mathematically rigorous by Norbert Wiener who, in 1948 [1], proposed generalized harmonic analysis as the mathematical tool necessary to capture the mysterious relations between EEG time series and the functioning of the vast number of neurons within the human brain. Over the next half century, spectral methods figured prominently in characterizing the properties of EEG time series. However, a number of research groups [2–5], by means of detrended fluctuation analysis (DFA) [6], have recently determined that EEG time series X(t) have scaling properties, with the second moment of the integrated EEG signal Y(t), which increases as a non-trivial power-law:
 |
Here, the brackets denote a suitably defined averaging over the data. When the deviation of the second moment scaling index from the classical diffusion value α = 1 is due to correlations in the time series, the index can be related to the Hurst exponent by α = 2H. However, anomalous diffusion (α ≠ 1) can also be the result of the statistics of the time series and not the correlations; see, for example, West [7]. The spectrum S(f ) associated with correlated time series falls into the category of 1/f noise, that is, the Fourier transform of the autocorrelation function is given by
 |
with frequency f, and the spectral index is related to the Hurst exponent H by
 |
A word of caution is in order regarding the use of spectra. The spectral approach is not a reliable method for determining the scaling index because the EEG time series are non-stationary, and consequently, their direct Fourier transforms are ill-defined. To address the non-stationarity of EEG time series nonlinear processing techniques, with their implicit dependence on nonlinear dynamics, chaos and fractals have recently lead the parade of methodologies hoping to accomplish the task of relating patterns in the time series to functions of the brain; see, for example, West et al. [8] for a brief review. Finally, DFA has been applied also to the EEG time series itself instead of its integration. Hwa et al. [9] found a double scaling regime in which early times scale differently from later times, in the case of resting EEG. The distribution of the values of the second scaling exponent peaks at 0.1 and has a slow tail up to a value of 0.5.
Another technique pioneered by Wiener [10] and historically used extensively in the analysis of EEG time series is the engineering model of signal plus noise, from which we obtain such concepts as the signal-to-noise ratio. Over the past half century, the single-channel EEG time series has been interpreted using this paradigm as consisting of a message called signal, which is the integrated contribution of the neurons in the vicinity of the channel electrical contact along with the “coherent” influence of distant neurons, and the relatively erratic fluctuations called noise, which is the “incoherent” contribution of the distal neurons in the brain [11]. The “signal” parts of the EEG time series are often called waves or rhythms. For example, alpha rhythms (7–12 Hz) have been shown to be typical of awake individuals when the brain is under no visual stimulation and may act as a nonlinear clock in the manner suggested by Wiener [12] to serve as a gating function to facilitate the association mechanisms within the brain. The authors of [2–5, 9] invert this paradigm, considering the “noise” and its scaling properties (long-range correlation) as containing the relevant information, and the “signal” as a changing trend that must be eliminated (detrended) to accurately measure the scaling properties of the noise. As a matter of fact, DFA requires the hypothesis (always assumed but never tested) that an EEG record is the sum of two independent contributions: trend (or signal) and noise. Recently, scaling analysis has been directed towards separating a more subtle concept of signal, that being the amplitude modulation of the alpha rhythm, from the incoherent fluctuations in the time series [13].
In the approach presented here, we seek to model EEG dynamics directly, not making any a priori signal–noise separation. The entropy-based methodology we introduce explicitly demonstrates the failure of the signal-plus-noise model. Entropy-related measures have already been used to quantify the level of order in EEG signals. Inouye et al. [14] employed spectral entropy, as defined by the Fourier power spectrum, but the fact that EEG time series are not stationary, in the sense that the autocorrelation function is not simply a function of the difference between the data at two different times, obviates the use of Fourier transforms as mentioned above. Schlögl et al. [15] measured the information entropy of 16-bit EEG polysomnograhic records and found it to be in the range of 8–11 bits. Patel et al. [16], using a combination of fMRI and entropy maximization, where the probability density in the entropy definition is replaced with a scaled dipole strength, demonstrated that the generators of alpha rhythm are mainly concentrated over the posterior regions of the cortex, consistent with the theoretical speculations of others [17]. Subsequently, wavelet entropy, in which the probability density is replaced with the relative wavelet energy, was used by Rosso et al. [18, 19] to study the order/disorder dynamics in short-duration EEG signals including evoked response potentials. In this manuscript, we make use of the diffusion entropy (DE) method [20, 21] as a probe of the neural network dynamics that can reveal patterns that are often obscured using other data processing techniques. The DE method [20, 21] has been successfully used to discriminate between the influence of the seasons on the daily number of teen births in Texas [22] and the effect of solar cycles on the statistics of solar flares [23].
In Section 2.1, we introduce the DE method as a way of analyzing EEG time series data. The DE analysis method suggests a number of interactive mechanisms present in the brain’s neural network, including a form for a stochastic dynamic equation with which to model the observed EEG properties. The stochastic model, called a Langevin equation in physics, is developed and shown to reproduce the DE patterns observed in real EEG data, Section 2.2. Finally, we draw some conclusions in Section 3.
EEG analysis
DE method
Consider a stochastic process whose outcome is the real-valued dynamic variable X(t) or “trajectory.” Each realization of the stochastic process will produce a different trajectory X(t); thus, the necessity of describing the phenomenon by means of the probability density function (pdf) p(x,t): the probability density of having the trajectory X(t) located in an infinitesimal neighborhood dx centered in x at time t. The DE method [20, 21] is a way of investigating the dynamics (stochastic rules) of the process generating the trajectory X(t) monitoring the time evolution of the information entropy of the corresponding pdf:
 |
This entropy is the continuous form, introduced by Wiener for studying the problem of noise and messages in electrical filters [1], and of the information entropy introduced by Shannon [24]. The properties of the entropy S(t) of (4) and its usefulness in investigating the dynamics guiding the time evolution of the variable X(t) have been assessed by a number of investigators: e.g., [22] and [25] may constitute a good review. Here, we summarize the properties that are relevant in this EEG study. In particular, we examine three different dynamical systems responsible for the time evolution of the variable X(t):
 |
In the case of (5), the variable X(t) is the integration of the noise ξ(t). If ξ is fractional Gaussian noise, then X(t) is fractional Brownian motion, and the corresponding pdf p(x,t) is Gaussian with a time-dependent standard deviation: σ(t) = σtH. The symbol σ indicates the standard deviation of the noise ξ, while H is the Hurst exponent. In this case, the entropy S(t) of (4) reduces to the exact form
 |
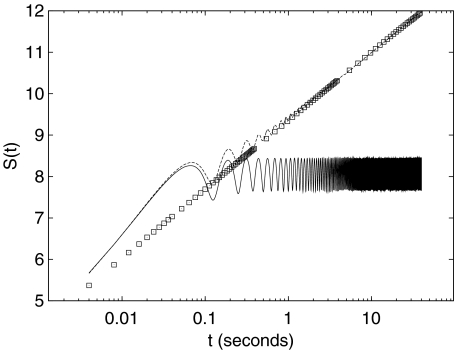
where e is the Neper number. The squares in Fig. 1 indicate the entropy S(t) for the numerical integration of (5) in the case H = 1/2.
Fig. 1.
Application of the DE method to the numerical simulation of the variable X(t) of (5) (squares), (6) (dashed line), and (7) (solid line). The noise amplitude is for all three cases σ = 10, the amplitude of the sinusoidal component is A = 10 and its frequency is 1/T = 8 Hz. Finally, the sampling frequency used in all three simulations is 250 Hz, the same as that of the EEG data analyzed in this manuscript
The dynamical system (6) is a prototype of the engineering model of signal plus noise: a sinusoid of amplitude A and angular frequency ω is the signal, and ξ is the noise. Conversely, using the DFA paradigm, the sinusoidal term in (6) is the trend (moving average) which must be removed to correctly assess the scaling property of the noise ξ. The dashed line in Fig. 1 shows the resulting information entropy S(t) for the numerical integration of (6). We set ξ to be Gaussian white noise as for the numerical simulation of (5). We see how the scaling behavior is deformed by the presence of the sinusoidal term. The graph of S(t) can be described as a “bumpy” increase: the local minima of each bump occur every T = 2π/ω (the period of the sinusoidal component) and coincide with the expected behavior when only the noise ξ is present: the integral of the sinusoidal component of (6) over an integer multiple of the period T is null. Moreover, the intensities of the “bumps” decrease in time, and the entropy S(t) relative to (6) approaches the curve relative to (5). The rationale is that the contribution of the noise ξ to the variance of the variable X(t) increases linearly in time (2H = 1). As time increases, this contribution dwarfs the contribution due to the sinusoidal term, which is periodic and of fixed intensity [22]. Finally, we consider (7), which adds a feedback term, in the form a friction of intensity γ, to (6). Due to the feedback term in (7), the variable X(t) cannot be decomposed into the sum of two independent contributions (signal/trend plus noise). The solid line in Fig. 1 indicates the resulting information entropy S(t) from the numerical integration of (7). The presence of the feedback term suppresses the increase in entropy after a time of the order 1/γ; therefore, the ratio of the variance due to the noise and that due to the sinusoidal term remains constant. This fixed ratio produces the oscillations of fixed amplitude and fixed absolute level observed for times larger than 1/γ [26].
We now briefly discuss how the DE method is implemented numerically. Instead of the continuous time function X(t), we have its digitized version Xj consisting of N + 1 data points, and construct the differences
 |
In this way, an ensemble of M = N − t + 1 trajectories is obtained from a single trajectory, making it possible to estimate the pdf p(x,t) of finding X(t) in an infinitesimal neighborhood of x at time t. The right-hand side of (9) indicates that the differences Xk + t − Xk are obtained by summing t consecutive elements of the time series of the increments ξj = Xj + 1 − Xj, which is the digitized version of dX(t)/dt for a unit time step.
Application to EEG records
ELMIKO DigiTrack setup was used to acquire EEG of 20 healthy individuals. The measurements were performed according to the international 10–20 standard with the average reference set-up. The data were sampled at 250 Hz and filtered with 0.1 Hz high-pass filter. The analysis was confined to channels O1, O2, C3, and C4. These channels are traditionally used in sleep studies. EEG was visually inspected to mark any artifacts. For each subject, we extracted an “eyes closed,” artifact-free segment of EEG. The mean length of such segments was 128.1 s, ranging from 55 to 400 s. A low-pass, 50-Hz filter was applied to the data prior to the DE analysis. The type of the filter used in preprocessing (elliptic, Butterworth, etc.) did not affect the dynamics of DE.
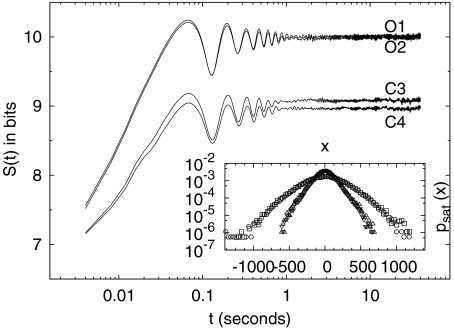
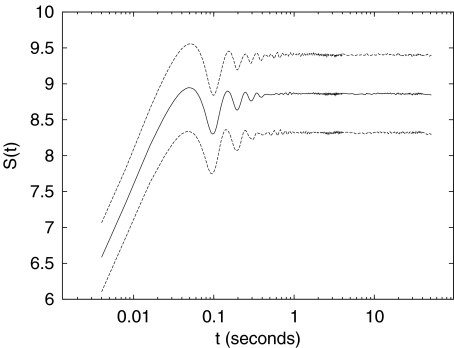
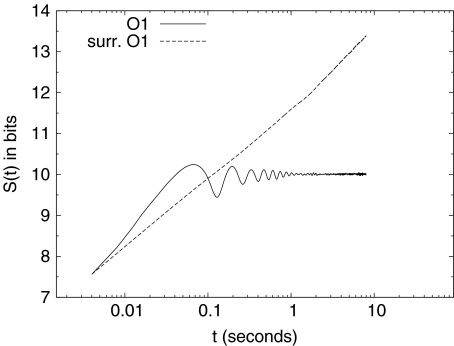
Each channel of an EEG record is considered as a digitized version Xj of a continuous variable X(t), and the corresponding pdf is estimated using the procedure described by (9). Figure 2 shows the DE for the somnographic channels O1, O2, C3, and C4 of a single individual. We see how, for each channel, the DE: (1) reaches a saturation level for each channel, (2) has an “alpha” (~7.6 Hz in the case of this individual) modulation which is attenuated with time, and (3) has a small-amplitude residual asymptotic modulation. The early-time modulation, with variable frequency in the alpha range and variable amplitude, and the saturation effect are present in all channels for all subjects. Figure 3 shows the average among all 20 subjects of the entropy S(t) of channel O1 (solid line). The dashed lines indicate the variability (average plus/minus standard deviation) among all 20 subjects. A similar figure can be obtained for the remaining somnographic channels. Moreover, it should be pointed out that this saturation is neither a consequence of the finite length of the time series, nor of the finite amplitude of the EEG signal. In fact, if surrogate (via shuffling of EEG increments) data are used, the saturation disappears, as shown in Fig. 4. Consequently, this saturation effect is due to brain dynamics and is not an artifact of the data processing. Robinson [27] observed this saturation in the calculation of the EEG second moment and interpreted it as being due to dendritic filtering. The inset in Fig. 2 depicts the pdfs  , after the entropy saturation is attained, with channels O1 and O2 having nearly identical distributions, as do channels C3 and C4. The oscillations in Fig. 2 are consistent with the interpretation that the EEG time series are (for subjects with closed eyes at rest) modulated by alpha waves. Entropy saturation agrees with the notion that this relaxation is induced by a fluctuation-dissipation process, which is defined in statistical physics as a process in which both the dissipation and the random fluctuations are a consequence of the system of interest interacting with the environment. These two processes can be incorporated into a single equation of motion describing the EEG dynamics. The simplest dynamic model, which includes fluctuations, modulation, and dissipation, in short, all the properties displayed in Fig. 2, has the form of a Langevin equation. We assume a dissipative linear dynamic process X(t), i.e., an Ornstein–Uhlenbeck process, with a periodic driver having a random amplitude and frequency and an additive random force
  , which is a delta-correlated Gaussian process of strength σ,
 |
The coefficient λ is positive definite and defines a negative feedback,  when its argument, the time t, is in the interval Ij,s = [jts,(j + 1)ts] and is zero otherwise, and ts is the “stability” time after which a new frequency fj and a new amplitude Aj are selected.
Fig. 2.
The DE S(t) calculated using the increments of the channels O1, O2, C3, and C4 for one of the 20 subjects considered in this study. The inset depicts the pdfs  for each channel: squares (O1), circles (O2), upward triangles (C3), and downward triangles (C4)
Fig. 3.
Group-averaged time evolution of the DE S(t) (solid line). Dashed lines correspond to the mean square error
Fig. 4.
The DE S(t) calculated using the increments of the channel O1 of Fig. 2 (solid line), and using the increment of a surrogated data of channel O1 (dashed line)
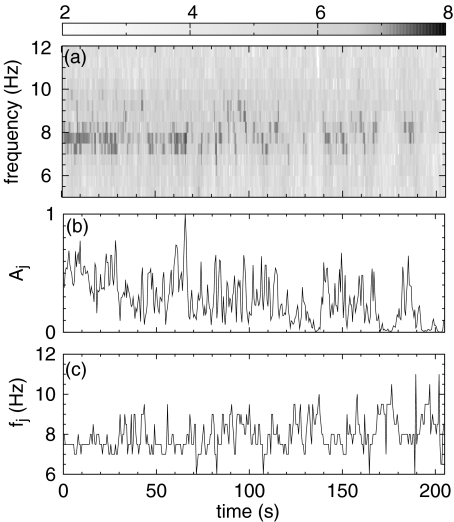
The values of the frequencies fj and amplitudes Aj are calculated as follows. First, we calculate the spectral density in the time-frequency domain of the time series of EEG increments with a time resolution ts and a frequency resolution  by means of a windowed Fourier transform. The spectral density, called the spectrogram (see, e.g., [28]), is a three-dimensional plot of the spectrum of the EEG increments ξj as it changes over time. Then, for each time interval of duration ts, we consider the range of frequencies of the alpha waves, 7–12 Hz, and find for which frequency the maximum amplitude occurs in the spectrogram. This procedure defines the frequency and the amplitude of the time interval considered.
Panel a of Fig. 5 shows the spectrogram relative to the increments ξj of the channel O1 for the same subject as in Fig. 2. Panels b and c of Fig. 5 show, respectively, the sequence of amplitudes Aj (normalized to a maximum amplitude of 1) and of frequencies fj calculated using the procedure described above. Without an a priori knowledge of the typical duration of an alpha wave packet, we set the stability time ts of (10) equal to 0.5 s. A time resolution of 0.5 s and a frequency resolution of ~0.5 Hz in the spectrogram represent a reasonable time-frequency localization for our purposes (ts > 0.5 s results in a better frequency localization, e.g., 0.25 Hz, but an alpha wave packet may be not stable for time intervals longer than 0.5 s; ts < 0.5 s produces an good time localization but results in a poor frequency localization, e.g., 1 Hz).
Fig. 5.
a Spectrogram of the increments of channel O1. We plot the base-10 logarithm of the spectral density. The time resolution is ts = 0.5 s, the frequency resolution is  Hz. b Sequence of the maxima of the spectrogram amplitude (normalized so that the maximum amplitude is 1). This sequence is the sequence of coefficients Aj used in (10). c Sequence of the frequencies corresponding to the amplitude maxima of the spectrogram. This sequence is the sequence of coefficients fj used in (10)
Consider the model case where Aj = 0, for all j, no modulation is present, and (10) is the Ornstein–Uhlenbeck–Langevin equation. In this case, the variable X(t) is Gaussian distributed with standard deviation  . Consequently, for t ≪ 1/λ, the entropy S(t)∝
 and a linear-log plot yields the straight line of slope δ = 0.5 depicted by the squares in Fig. 1. For t ≫ 1/λ, the entropy reaches the saturation level S(t) = log2
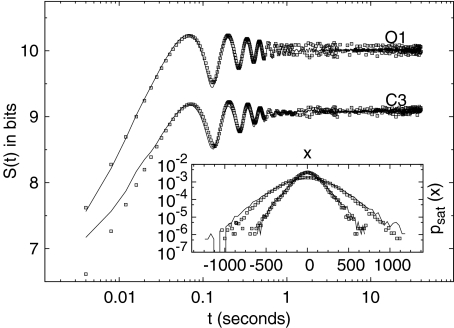
 [26], yielding an entropy structure similar to that of the EEG data depicted in Figs. 1 and 2 without the modulation being present. This unmodulated saturation is precisely the behavior observed by Robinson [27] in his DFA analysis of the second moment behavior of the EEG time series. When the modulation is present Aj ≠ 0, (10) is numerically integrated, and the dynamic variable X processed using the DE algorithm. In Fig. 6, we compare the DE obtained via (10) with that of the channels O1 and C3, already shown in Fig. 2. It is evident that the entropy constructed from the solution to (10) captures the qualitative and many of the quantitative features of the DE of the EEG increments. Moreover, the asymptotic pdfs recorded in the inset also agree with the empirical ones depicted in Fig. 2. In Table 1, we average the phenomenological parameters λ and D for the somnographic channels for the 20 subjects in this study.
Fig. 6.
Comparison between the DE of the increments, solid lines, of channel O1 and C3, and DE of the increments, points, of the variable X of (10). The parameters used in (10) are λ = 0.055, D = 40 for O1 and λ = 0.055, D = 20 for C3. Inset shows the comparison between the pdfs at saturation  : channels O1 and C3, solid lines, variable X of (10), squares
Table 1.
The average values (avg.) and the standard deviations (s.d.) of the parameters λ and D of (10) for all 20 subjects in this study
| EEG channel | λ (avg.±s.d.) | D (avg.±s.d.) |
|---|---|---|
| O1 | 0.0461±0.0187 | 16.37±6.88 |
| O2 | 0.0497±0.0182 | 16.35±6.72 |
| C3 | 0.0362±0.0186 | 10.19±3.90 |
| C4 | 0.0393±0.0200 | 10.60±3.72 |
The first notable property of the Langevin model is that it reaches a saturation level, indicating that the EEG signal asymptotically carries a maximum amount of information. The EEG entropy does not grow indefinitely, as would a random process with long-time correlation. The second notable property of the Langevin model is related to the first and is the dissipation, or negative feedback, produced locally within the channel of interest. The fluctuation-dissipation relation of Einstein is what produces the maximum level of the entropy in a closed physical network, and is given by the ratio of the strength of the additive fluctuations to the dissipation rate. In the more general Langevin equation given here, the saturation level is a more complicated function of the strength of the additive fluctuations, the dissipation rate, and the strength of the alpha rhythm. The third notable feature of the Langevin model is the attenuated oscillation of the entropy in time. The attenuation occurs in the EEG entropy because the alpha rhythm is not being generated at one source, but is described as a collective property of the brain in that it is being generated at a number of different locations [17]. Here, the influence of the distributed sources is modeled by wave packets that persist for a stability time ts; one packet is replaced by another with a slightly different carrier frequency and amplitude chosen from the empirical spectrogram every time interval of length ts. The concatenation of these wave packets with fluctuating frequencies and amplitudes produces a decoherence that attenuates the modulation of the resulting EEG entropy in time. Consequently, this modulation of the EEG entropy indicates that the channel is coupled coherently to the rest of the brain.
Conclusions
We used the DE method to investigate EEG dynamics under the “eyes closed” at rest condition. The DE method does not require any a priori hypothesis on the nature of the dynamics: e.g., the separation signal/trend and noise required by the DFA algorithm. The results of the DE, Figs. 2 and 3, together with the spectrogram analysis, Fig. 5, suggest the Ornstein–Uhlenbeck–Langevin equation (10) as a possible model for EEG dynamics. The model and the analysis presented in this letter support the notion that alpha rhythms [17]: (1) are not generated by one but by a number of spatially distributed sources [17], whose relative incoherence produces the attenuated modulation observed in the EEG entropy; (2) are near-periodic; and, therefore, (3) do not represent passive states, but may contain information in the amplitude and frequency modulation.
Equation (10) is the simplest form of a fluctuation-dissipation process that implies the presence of internal feedback to prevent the occurrence of large excursions of the electric potential inside the brain. According to the proposed model for EEG dynamics, an EEG record cannot be divided into two independent components: trend+noise. In the EEG literature based on DFA, the trend+noise decomposition is a dynamical property assumed a priori and not one derived from the results. In this manuscript, we invert the paradigm and use the results of the DE method to propose particular dynamical properties. Ultimately, the question of whether the DFA results, in light of (10), are indicative or not of genuine EEG dynamical properties requires a considerable body of work that is beyond the scope of the present manuscript and the topic of a forthcoming one [26].
As for the scaling property of the variable X(t) of (10) (EEG record), the arguments of Section 2 prove that there is no scaling regime. In the case of the time-integrated version of X(t), Y(t) (time integrated EEG record), we have an asymptotic (t ≫ 1/λ) ordinary scaling: parameter 0.5. The rationale is that, in the case of absence of alpha rhythm, (10) reduces to the ordinary Ornstein–Uhlenbeck–Langevin equation for which exact solutions for X(t) and Y(t) are available: for t ≫ 1/λ, Y(t) becomes an ordinary Brownian motion. Hence, the 0.5 scaling. The eventual presence of the alpha rhythm induces fast decaying oscillations, such as those illustrated by the dashed line in Fig. 1. DE application to the time-integrated versions of EEG records (not shown here for brevity) confirm the above expected behavior.
Finally, the proposed Ornstein–Uhlenbeck–Langevin model suggests another consideration related to eventual scaling properties of the EEG time series (or of its integral). The issue is the presence of the modulated alpha rhythm as revealed by the spectrogram of Fig. 5. Linkenkaer et al. [13] consider it as the “noise” and apply DFA to the rhythm amplitude time series. Hwa et al. [9], and the great majority of authors using the DFA method, consider it as a trend that should be eliminated. More generally, rhythms at different characteristic frequencies are present in the EEG activity under a variety of conditions, including sleep. It is reasonable to assume that EEG rhythms are not a periodic function of fixed amplitude and frequency but rather are modulated in amplitude and frequency. It is not reasonable to assume that this variability in the amplitude and frequency profile will be resolved by a linear trend. Yet, a linear trend is always assumed in almost all the applications of DFA to EEG, while a much larger degree of polynomial trend should be considered if one hopes to detrend the rhythm. The luck of complete removal of the modulated rhythm will appreciably alter the value of an eventual scaling exponent (see, e.g., the discussion in [22]).
The authors thank the Army Research Office for support of this research and the anonymous referee for his/her helpful comments, which helped us improve the quality of the manuscript. The code for the programs used for the EEG analysis (DE and spectrogram) is available at http://www.duke.edu/~mi8/softwaresubpage/C++_programs.html.
References
- 1.Wiener N. Cybernetics. Cambridge: MIT; 1948. [Google Scholar]
- 2.Watters PA, Matin F. A method for estimating long-range power law correlations from the electroencephalogram. Biol. Psychology. 2004;66:79. doi: 10.1016/j.biopsycho.2003.09.001. [DOI] [PubMed] [Google Scholar]
- 3.Stead M, Worrel GA, Litt B.Frequency and dependence of long range temporal correlations in human hippocampal energy fluctuations Complexity 200510535. 10.1002/cplx.200882281032 [DOI] [Google Scholar]
- 4.Yuan JW, Zheng B, Pan CP, Wu YZ, Trimper S.Dynamic scaling behavior of human brain electroencephalogram Physica A 2006364315. 10.1016/j.physa.2005.09.0382006PhyA..364..315Y [DOI] [Google Scholar]
- 5.Cai S, Jiang Z, Zhou R, Shou P, Yang H, Wang B.Scale invariance of human electroencephalogram signals in sleep Phys. Rev. E 20077661903. 10.1103/PhysRevE.76.0619032007PhRvE..76f1903C [DOI] [PubMed] [Google Scholar]
- 6.Peng CK, Buldyrev SV, Havlin S, Simons M, Stanley HE, Golberger AL.Mosaic organization of DNA nucleotides Phys. Rev. E 1994491685. 10.1103/PhysRevE.49.16851994PhRvE..49.1685P [DOI] [PubMed] [Google Scholar]
- 7.West BJ. Where Medicine Went Wrong. Singapore: World Scienitic; 2006. [Google Scholar]
- 8.West BJ, Novaes MN, Kavcic V. In: Fractal Geometry in Biological Systems. Iannaccone PM, Khokha M, editors. New York: CRC; 1995. [Google Scholar]
- 9.Hwa RC, Ferree TC.Scaling properties of fluctuations in the human electroencephalogram Phys. Rev. E 20026621901. 10.1103/PhysRevE.66.0219012002PhRvE..66b1901H [DOI] [PubMed] [Google Scholar]
- 10.Wiener N. Time Series. Cambridge: MIT; 1949. [Google Scholar]
- 11.Fox MD, Raichle ME. Spontaneous fluctuations in brain activity observed with functional magnetic resonance imaging. Nat. Rev. Neurosci. 2007;9:700. doi: 10.1038/nrn2201. [DOI] [PubMed] [Google Scholar]
- 12.Wiener N. Nonlinear Problems in Random Theory. New York: MIT and Wiley; 1958. [Google Scholar]
- 13.Linkenkaer-Hansen K, Nikouline VV, Palva JM, Llmoniemi RJ. Long-range temporal correlations and scaling behavior in human brain oscillations. J. Neurosci. 2001;21:1370. doi: 10.1523/JNEUROSCI.21-04-01370.2001. [DOI] [PMC free article] [PubMed] [Google Scholar]
- 14.Inouye T, Shinosaki K, Sakamoto H, Toi S, Ukai S, Iyama A, Katzuda Y, Hirano M. Quantification of EEG irregularity by the use of the entropy of the power spectrum. Electroencephalogr. Clin. Neurophysiol. 1991;79:204. doi: 10.1016/0013-4694(91)90138-T. [DOI] [PubMed] [Google Scholar]
- 15.Schlögl A, Kemp B, Penzel T, Kunz S, Himanen S, Värri A, Dorffner G, Pfurtscheller G. Quality control of polysomnographic sleep data by histogram and entropy analysis. Clin. Neurophysiol. 1999;110:2165. doi: 10.1016/S1388-2457(99)00172-8. [DOI] [PubMed] [Google Scholar]
- 16.Patel P, Khosla D, Al-Dayeh L, Singh M. Distributed source imaging of alpha activity using a maximum entropy principle. Clin. Neurophysiol. 1999;110:538. doi: 10.1016/S1388-2457(98)00061-3. [DOI] [PubMed] [Google Scholar]
- 17.Başar E, Schürmann M, Başar-Eroglu C, Karakaş S. Alpha oscillations in brain functioning: an integrative theory. Int. J. Psychophysiol. 1997;26:5. doi: 10.1016/S0167-8760(97)00753-8. [DOI] [PubMed] [Google Scholar]
- 18.Rosso OA, Blanco S, Yordanova J, Kolev V, Figliola A, Schürmann M, Başar E. Wavelet entropy: a new tool for analysis of short duration brain electrical signals. J. Neurosci. Methods. 2001;105:65. doi: 10.1016/S0165-0270(00)00356-3. [DOI] [PubMed] [Google Scholar]
- 19.Rosso OA. Entropy changes in brain function. Int. J. Psychophysiol. 2007;64:75. doi: 10.1016/j.ijpsycho.2006.07.010. [DOI] [PubMed] [Google Scholar]
- 20.Scafetta N, Hamilton P, Grigolini P. The thermodynamics of social processes: the teen birt phenomenon. Fractals. 2001;9:193. doi: 10.1142/S0218348X0100052X. [DOI] [Google Scholar]
- 21.Grigolini P, Palatella L, Raffaelli G. Asymmetric anomalous diffusion: an efficient way to detect memory in time series. Fractals. 2001;9:439. doi: 10.1142/S0218348X01000865. [DOI] [Google Scholar]
- 22.Ignaccolo M, Allegrini P, Grigolini P, Hamilton P, West BJ.Scaling in non-stationary time series. (II). Teen birth phenomenon Physica A 2004336623. 10.1016/j.physa.2003.12.0332004PhyA..336..623I [DOI] [Google Scholar]
- 23.Scafetta N, West BJ.Solar flare intermittency and the earth’s temperature anomalies Phys. Rev. Lett. 200390248701. 10.1103/PhysRevLett.90.2487012003PhRvL..90x8701S [DOI] [PubMed] [Google Scholar]
- 24.Shannon CE.A mathematical theory of communication Bell Syst. Tech. J. 194827379–423.1154.9430326286 [Google Scholar]
- 25.Allegrini P, Benci V, Grigolini P, Hamilton P, Ignaccolo M, Menconi G, Palatella L, Raffaelli G, Scafetta N, Virgilio M, Yang J.Compression and diffusion: a joint approach to detech complexity Chaos Solitons & Fractals 2003155171038.37062 10.1016/S0960-0779(02)00136-41932471 [DOI] [Google Scholar]
- 26.Ignaccolo, M., Latka, M., Jernajczyk, W., Grigolini, P., West, B.J.: Dynamics of EEG entropy: beyond signal plus noise. Phys. Rev. E. arXiv:0902.1113 (2009)
- 27.Robinson PA.Interpretation of scaling properties of electroencephalographic fluctuations via spectral analysis and underlying physiology Phys. Rev. E 20036732902. 10.1103/PhysRevE.67.0329022003PhRvE..67c2902R [DOI] [PubMed] [Google Scholar]
- 28.Mallat S. A Wavelet Tour of Signal Processing. 2. San Diego: Academic; 1999. [Google Scholar]


