

Abstract
Background and purpose:
Changes in tissue P-glycoprotein (P-gp) activity during pregnancy could affect the pharmacokinetics and thus the efficacy and toxicity of many drugs. Therefore, using positron emission tomography (PET) imaging, we tested whether gestational age affects tissue P-gp activity in the pregnant non-human primate, Macaca nemestrina.
Experimental approach:
Mid-gestational (day 75 ± 13, n= 7) and late-gestational (day 150 ± 10, n= 5) age macaques were imaged after administration of a prototypic P-gp substrate, 11C-verapamil (13.7–75.4 MBq·kg−1), before and during intravenous infusion of a P-gp inhibitor, cyclosporin A (CsA) (12 or 24 mg·kg−1·h−1). Accumulation of radioactivity in the fetal liver served as a reporter of placental P-gp activity. P-gp activity was expressed as CsA-induced percent change in the ratio of the area (0–9 min) under the 11C-radioactivity concentration–time curve in the tissue (AUCtissue) to that in the maternal plasma (AUCplasma).
Key results:
The CsA-induced change in AUCfetal liver/AUCmaternalplasma of 11C-radioactivity significantly increased from mid- (35 ± 25%) to late gestation (125 ± 66%). Likewise, the CsA-induced change in AUCmaternal brain/AUCplasma increased from mid- (172 ± 80%) to late gestation (337 ± 148%). The AUC ratio for the other maternal tissues was not significantly affected. Neither the CsA blood concentrations nor the level of circulating 11C-verapamil metabolites were significantly affected by gestational age.
Conclusions and implications:
P-gp activity at the blood–brain barrier and the placental barrier in the macaque increased with gestational age. If replicated in humans, the exposure of the fetus and maternal brain to P-gp substrate drugs, and therefore their efficacy and toxicity, will change during pregnancy.
Keywords: ABCB1 (MDR1, P-glycoprotein); 11C-verapamil; blood-brain barrier; pregnancy; non-human primates
Introduction
Of all the processes determining disposition of drugs, efflux transport by ABCB1 [MDR1, P-glycoprotein (P-gp)] and metabolism by cytochrome P450 3A (CYP3A) enzymes affect more drugs than any other known pathway. Many of the drugs administered to pregnant women are P-gp substrates. These include antiretroviral drugs (anti-HIV protease inhibitors), antibiotics (azithromycin, clarithromycin), histamine H1 and H2 receptors antagonists (fexofenadine and cimetidine) and anticonvulsants (carbamazepine, phenytoin) (Endres et al., 2006). P-gp is strategically located in the intestine, the blood–brain barrier (BBB), placental barrier, liver and kidneys – organs important for absorption, distribution, metabolism and excretion of drugs. Studies in rodents where P-gp is genetically or chemically ablated have shown that the greatest impact of P-gp on drug distribution is at the BBB and the placenta (Lankas et al., 1998; Hendrikse and Vaalburg, 2002; Endres et al., 2006). For example, P-gp inhibition by valspodar (PSC 833) in pregnant mice increases the distribution of digoxin into the maternal brain ∼eightfold and into the fetus ∼2.8-fold, whereas that in the maternal liver, kidneys and spleen are affected much less (Smit et al., 1999). In the dually perfused human placenta the maternal-fetal transport of the P-gp substrates, saquinavir (Mölsäet al., 2005), indinavir and vinblastine (Sudhakaran et al., 2008), is significantly increased in the presence of P-gp inhibitors. Thus P-gp may be an obstacle to fetal delivery of therapeutic compounds, such as antiretroviral drugs, while protecting the fetus from potentially toxic drugs administered to the mother. However, the level of this protection may change with gestational age. For example, we and others have shown that P-gp expression in the syncytiotrophoblasts of the human placenta decreases dramatically (∼40-fold) with gestational age (Gil et al., 2005; Mathias et al., 2005; Sun et al., 2006). Thus, a better understanding of changes in P-gp activity in the placenta and in maternal organs during pregnancy may improve the therapeutic efficacy and reduce toxicity of drugs that are P-gp substrates and are administered to the pregnant woman (and therefore her fetus).
Recently, we demonstrated and validated the utility of positron emission tomography (PET) imaging to simultaneously measure P-gp activity in multiple tissues of the pregnant non-human primate, Macaca nemestrina (Eyal et al., 2009). Here we report an extension of this study that shows for the first time that the in vivo P-gp activity in the placenta and at the BBB changes with gestational age.
Methods
Animals
All experimental procedures were performed in accordance with guidelines established by the NIH and were approved by the University of Washington Animal Care Committee. Macaques were housed and timed-mated at the Washington National Primate Research Center (WaNPRC). The animals were evaluated by a veterinarian and declared to be pregnant after a brief physical and ultrasound examination under anaesthesia (ketamine, 10 mg·kg−1; atropine, 0.04 mg·kg−1, i.m.). The animals were selected based on a history of at least two to three live birth deliveries. They were 6–14 years old and weighed at least 7 kg (Table 1). Altogether, seven macaques were studied at mid-gestation (day 75 ± 13, n= 7) and five at late gestation (day 150 ± 10, n= 5). Of these, three were studied at both mid-gestation and late gestation.
Table 1.
Characteristics of the animals at the time of the positron emission tomography study
| Animals at mid-gestation | Animals at late gestation | ||||||
|---|---|---|---|---|---|---|---|
| CsA dose (mg·kg-1·h-1) | Gestational age (days)* | Age (years) | Weight (kg) | CsA dose (mg·kg-1·h-1) | Gestational age (days)* | Age (years) | Weight (kg) |
| 12 (n= 3) | 67.3 ± 13.1 | 10.2 ± 3.9 | 7.3 ± 0.1 | 12 (n = 3) | 147 ± 11 | 10.4 ± 3.6 | 9.2 ± 1.4 |
| 24 (n= 4) | 81.0 ± 11.9 | 9.9 ± 1.9 | 8.1 ± 1.0 | 24 (n = 2) | 155 ± 0 | 10.3 ± 3.2 | 7.9 ± 0.4 |
| Combined (n= 7) | 75.1 ± 13.4 | 10.0 ± 2.6 | 7.7 ± 0.8 | Combined (n = 5) | 150 ± 9 | 10.3 ± 3.0 | 8.7 ± 1.2 |
Full term is 172 days when colony bred.
CsA, cyclosporin A.
Animal preparation
All PET and magnetic resonance imaging (MRI) procedures were carried out as previously described (Eyal et al., 2009). Briefly, following an overnight fast, the animal was sedated with an intramuscular injection of ketamine (10 mg·kg−1) and atropine (0.04 mg·kg−1). Each animal was placed on a custom-built animal restrainer to ensure complete immobility and consistent positioning during the PET and the MRI studies. Continuous inhalation of isoflurane (0.5–2.0%) via endotracheal tube was carefully adjusted to maintain adequate anaesthetic depth. Two intravenous lines were surgically installed bilaterally in the femoral veins, one for administration of radioactive tracers and the other for infusion of cyclosporin A (CsA). A femoral arterial line was established for blood sampling and for fluid administration (Normosol-R, a non-pyrogenic, isotonic electrolyte solution). To reduce spillover of radioactivity from urinary excretion of the tracers in the abdomen and pelvis, a urinary catheter was inserted and the animal was well hydrated. Before positioning the animal in the scanner, a bedside ultrasound scan was conducted to determine fetal position to aid positioning in the scanner and image analysis. During the entire study, the animal was monitored non-invasively for blood gases, body temperature, blood pressure and heart rate. Blood chemistry was monitored before and after each PET study. Haematocrit values were 33.5 ± 2.7 at mid-gestation and 32.3 ± 2.4 at late gestation and did not vary significantly between the beginning and the end of the study days.
PET imaging protocol
A two-dimensional acquisition mode on a General Electric PET Tomograph (Advance; GE Medical Systems, Waukesha, WI, USA) was used to produce 35 image planes over a 15 cm axial field of view. All animals were positioned transverse to the scanner axis to image both the maternal brain and the fetal compartment. The dynamic imaging protocol consisted of five substudies, as described in detail below and in Figure 1.
Figure 1.
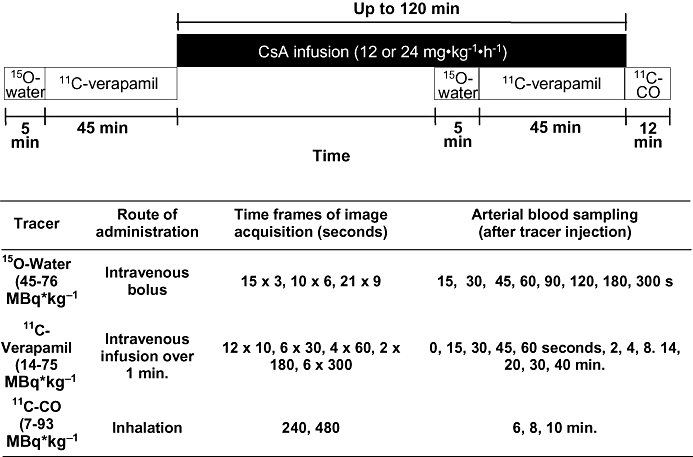
The positron emission tomography imaging protocol including details of each tracer experiment. 15O-water (for evaluation of tissue blood flow) and 11C-verapamil substudies were performed in the absence and the presence of CsA. 11C-CO was used to assess tissue blood volume. For three animals, the protocol was modified and shortened (see Methods).
15O-water (45.1–79.7 MBq·kg−1) was administered as an i.v. bolus in isotonic saline (5 mL) to measure tissue blood flow. Then, image acquisition was conducted and arterial blood samples (0.5 mL) were obtained as described in Figure 1. The blood samples were counted on a gamma counter (Packard Corp., Meriden, CT, USA).
Approximately 15 min after the 15O-water study, 11C-verapamil (13.7–75.4 MBq·kg−1) was intravenously infused (over 1 min) in 5 to 10 mL of isotonic saline containing <13% (v/v) ethanol (a maximum of 1.3 mL per administration). At the onset of the infusion, a 45 min dynamic sequence was initiated and arterial blood (0.5 mL) was sampled (Figure 1). Aliquots of plasma (100 µL) were counted for determination of total plasma 11C-radioactivity. A larger volume of blood (3–5 mL) was collected at 1, 4, 8, 14, 20 and 40 min to determine plasma verapamil and metabolite concentration by a rapid solid-phase extraction method described previously (Unadkat et al., 2008).
When the first phase of 11C-verapamil image acquisition was terminated, a 2 h i.v. infusion of CsA (12 mg·kg−1·h−1 or 24 mg·kg−1·h−1) was initiated. In the absence of previously published data on CsA potency as a P-gp inhibitor in non-human primates, we targeted two different blood concentrations of CsA, one that approximates the half maximal effective concentration (EC50) for P-gp inhibition at the rat BBB (7.2 µM) and one that is greater than the rat EC50 and predicted to completely inhibit P-gp activity (Hsiao et al., 2006). Blood samples were collected at 0, 15, 30, 60, 80, 100 and 120 min for determination of CsA blood concentration by liquid chromatography-mass spectrometry (LC-MS) (conducted by the Department of Laboratory of Medicine, University of Washington) (Koal et al., 2004).
At approximately 45 min after initiating CsA infusion, the 15O-water (44.9–75.7 MBq·kg−1) imaging study was repeated to measure any CsA-induced change in tissue blood flow. One hour after the start of CsA infusion, the 11C-verapamil (29.9–69.3 MBq·kg−1) imaging study was repeated. At the end of the second 11C-verapamil study, 11C-CO (7.4–92.7 MBq·kg−1), was administered by inhalation to determine tissue blood volume. Images were acquired for 12 min and blood samples were obtained and counted (Figure 1). A total of up to 73 mL blood (or up to 10% of total blood volume) were drawn during each study day.
For the last three animals, the above protocol was modified in the following manner to reduce the study duration and therefore the potential for fetal complications. The duration of the entire study was reduced by shortening the second 11C-verapamil substudy to 25 min and eliminating the 11C-CO substudy, and the total dose of CsA was reduced by administering the second 11C-verapamil dose 30 min into the CsA infusion (12 mg·kg−1·h−1).
Reconstruction of PET images
Corrections for random coincidences, scatter and attenuation were applied to the raw PET data before the images were reconstructed onto a 128 × 128 × 35 matrix by a two-dimensional filtered back projection method. Dynamic data were summed from 0 to 5 min for 15O-water, 1 to 9 min for 11C-verapamil and 4 to 12 min for 11C-CO to aid region placement and image analysis. The tomograph, dose calibrator and gamma counter were cross-calibrated to express all measurements in common units of radioactivity (Bq·mL−1). At the beginning of each study, a 15-min attenuation scan was acquired with a rotating germanium 68 source. The attenuation scan was repeated if there was any significant change in the position of the animal noted during the study.
Image analysis
An MRI study was conducted with a 1.5-T MR instrument (Signa; GE Healthcare, Waukesha, WI, USA) within 2 weeks of the PET studies. Based on MRI T1- and T2-weighted as well as summed 11C-radioactivity images, we identified the sites of maternal and fetal organs to generate regions of interest (ROI) on the PET images. Whereas most of the constructed regions were larger than twice the size-resolution of the reconstructed image (>2 × 1.2 cm) and did not require partial volume correction, fetal liver (at mid-gestation), uterine wall and maternal gallbladder were corrected for partial volume effect based upon the size estimated from MRI and using PET tomograph recovery coefficients as previously described (Kohlmeyer et al., 2000). The ROIs from contiguous slices were combined to create volumes of interest (VOI) for each tissue type using conventional image processing software (Alice™ image processing software, HIPG, or PMOD, version 2.9; PMOD Technologies). VOIs were applied to both the dynamic image sets and the static summed standardized uptake value images for data extraction. The image and plasma data were decay corrected to the injection time, and tissue and arterial plasma area under the curve (AUC) was calculated by the trapezoidal rule between sampled time points. Tissue values were corrected for vascular contamination for all organs except fetal liver. Then, the ratio (AUCR = AUCtissue/AUCplasma) of total 11C-radioactivity was computed over 0–4 min or 0–9 min, a period over which the extent of metabolism of verapamil was minor and modest respectively (Eyal et al., 2009). However, we focused our analysis on the 0–9 min period because tissue concentration-time profiles indicated that tissue distribution was incomplete at 4 min. We also computed the AUCR using the AUCplasma of the unchanged 11C-verapamil based on the results of our plasma metabolite analysis.
Estimation of tissue blood flow
Image-based arterial input functions from dynamic 15O-water studies were created from cardiac ROIs over the maternal heart derived by segmentation (O'Sullivan et al., 2007) and scaled by radioactive measurements of late arterial blood samples. A one-compartment model (Kety, 1951) using the input function and the dynamic image sequence, was used to recover the average blood flow for each region of interest as described before (Eyal et al., 2009).
Statistical analysis
Data were expressed as mean ± standard deviation. As in earlier work (Sasongko et al., 2005), P-gp activity was inferred from the percent change in AUCR of 11C-radioactivity in the absence and the presence of the P-gp inhibitor, CsA. Statistical comparisons were performed using the non-parametric Mann–Whitney or Kruskal–Wallis tests as appropriate, depending on the number of groups compared. A value of P < 0.05 was set for statistical significance.
Materials
(+/−)-Verapamil was purchased from Sigma-Aldrich. D-617 {3,4-dimethoxy-α-[3-(methylamino)propyl]-α-[1-methylethyl]-benzeneacetonitrile} and norverapamil were kindly supplied by Knoll AG and Prof. W.L. Nelson (Medicinal Chemistry, University of Washington, Seattle, WA, USA). CsA (Sandimmune, 250 mg/5 mL) was purchased from Novartis Pharmaceuticals (East Hanover, NJ, USA). Dextrose USP grade solution (5%) was from Baxter (Deerfield, IL, USA). Palladium on alumina (0.5%), anhydrous acetonitrile and zinc (99%) were purchased from Sigma-Aldrich (Milwaukee, WI, USA). Ethanol, anhydrous sodium sulphate and phosphate-buffered saline solution (PBS) were United States Pharmacopeia pharmaceutical-grade quality. Normosol-R was from Hospira, Inc. (Lake Forest, IL, USA). All other chemicals were purchased from multiple vendors and were of the highest chemical purity available. All drug and molecular target nomenclature conforms to the British Journal of Pharmacology's Guide to Receptors and Channels (Alexander et al., 2008).
Radiopharmaceuticals
Radiopharmaceuticals were synthesized as reported previously (Christman et al., 1975; Clark and Buckingham, 1975; Link et al., 1997). All tracers were greater than 99% radiochemically and chemically pure. Specific activity of racemic 11C-verapamil (determined in triplicate) was 172 ± 211 GBq·mmol−1, with a total quantity injected of less than 1.5 mg·kg−1 (3.3 nmol·kg−1) verapamil per animal (each animal received two injections; see further discussion).
Results
Animals
Nine pregnant animals completed the studies, of which three underwent PET and MRI at both mid-gestation and late gestation. Five animals were treated with 12 mg·kg−1·h−1 CsA and four animals were treated with 24 mg·kg−1·h−1 CsA. Six animals completed the studies with no known adverse events to the dam or the fetus and the mothers delivered healthy babies. Two animals delivered, by caesarean section, stillborn fetuses 2 and 8 days after the experiment and the fetus was not viable at the time scheduled for the MRI study as demonstrated by ultrasound. One animal (at late gestation) experienced significant blood pressure fluctuations at the end of the study after 15O-water and 11C-verapamil imaging had been completed and underwent a caesarean section 8 days after study completion to deliver a fetus that was diagnosed as nonviable by ultrasound. Uterine 15O-water activity and fetal liver 11C-verapamil uptake were not unusual in these three animals (see Discussion and conclusions).
CsA concentrations and verapamil metabolism
Over the 9 min period, CsA blood concentrations were relatively constant after CsA infusion at 12 mg·kg−1·h−1, regardless of the time elapsed between the onset of CsA infusion and verapamil injection (30 min or 60 min, n= 3 for each subgroup). CsA blood concentrations after the 24 mg·kg−1·h−1 infusion increased moderately with time (Figure 2). At 5 min, approximately the mid-interval of this period, mean blood CsA concentrations in animals treated with 12 mg·kg−1·h−1 CsA were 7.1 ± 2.5 µM (n= 3) and 6.9 ± 1.9 µM (n= 3), for mid- and late gestation respectively. The corresponding concentrations for 24 mg·kg−1·h−1 CsA were 22.6 ± 3.4 µM (n= 4) and 19.4 ± 2.2 µM (n= 2). The rate of verapamil metabolism and concentrations of circulating metabolites did not appear to be affected by gestational age or CsA administration (Figure 3). At 4 min, at least 85% of 11C-radioactivity was verapamil and its metabolite, D-617 (a P-gp substrate; data not shown), whereas at 9 min, verapamil and D-617 accounted for at least 66% of radioactivity.
Figure 2.
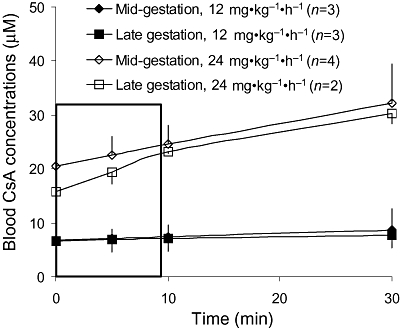
Following the administration of 6 mg·kg−1·h−1 or 12 mg·kg−1·h−1, but not 24 mg·kg−1·h−1, CsA blood concentrations (mean ± SD) remained relatively constant over the time course of [11C]-verapamil infusion.
Figure 3.
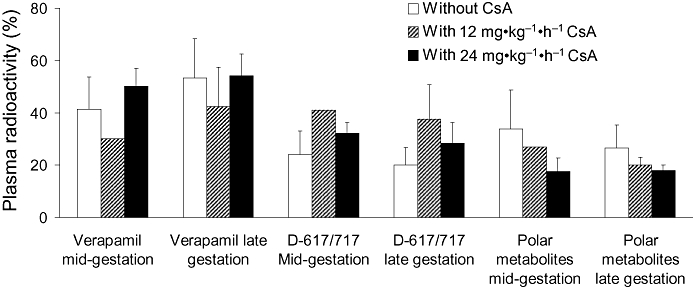
Verapamil metabolism in the pregnant non-human primate. At 9 min, plasma radioactivity present as verapamil, D-617/717 (also P-glycoprotein substrates) or polar metabolites was not significantly affected by gestational age (n= 5 per gestational age) or the presence of cyclosporin A (CsA). At mid-gestation, the number of animals studied for 11C-verapamil metabolism were 5, 1 and 4 in the presence of 0, 12 and 24 mg·kg−1·h−1 CsA respectively. The corresponding numbers at late gestation were 5, 3 and 2. Data are expressed as mean ± standard deviation.
Tissue distribution of 11C-radioactivity
In the absence of CsA, 11C-radioactivity distributed extensively into the maternal liver, gallbladder, kidneys, heart, spleen and vertebrae but much less so into the brain (Figure 4). The profiles of injected dose (ID)-normalized plasma 11C-time–activity curves (Cmax, tmax) and the plasma AUC0–9 min of total 11C-radioactivity (Figure 5) or 11C-verapamil (corrected for metabolism; data not shown) did not vary significantly with gestational age or with administration of CsA.
Figure 4.
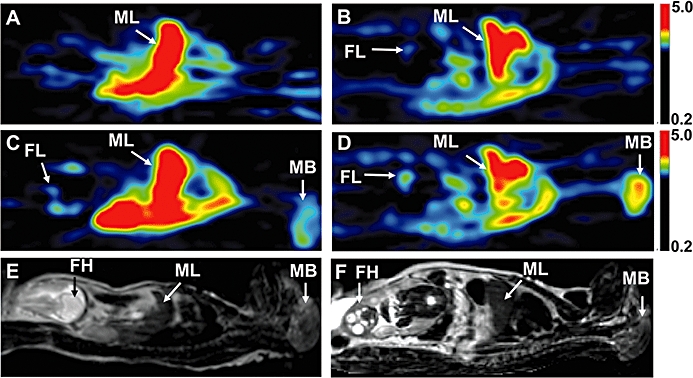
Positron emission tomography (PET) images of a pregnant M. nemestrina (subject # 02088) at mid- (A,C) and late gestation (B,D), before (A,B) and during (C,D) administration of 12 mg·kg−1·h−1 cyclosporin A (CsA). The PET scans are standardized uptake value images summed over a period of 1 to 9 min following 11C-verapamil injection. Due to P-glycoprotein inhibition, CsA (6.2 µM at mid-gestation and 8.2 µM at late gestation) significantly increased the distribution of 11C-radioactivity into the maternal brain and fetal liver, but the magnitude of change was greater at late gestation, compared with mid-gestation. (E,F) T2-weighted MRI of the subject at mid- (E) and late (F) gestation. The results of the quantitative analysis of maternal brain and fetal liver data from this subject are listed in Table 2. FH, fetal head; FL, fetal liver; MB, maternal brain; ML, maternal liver.
Figure 5.
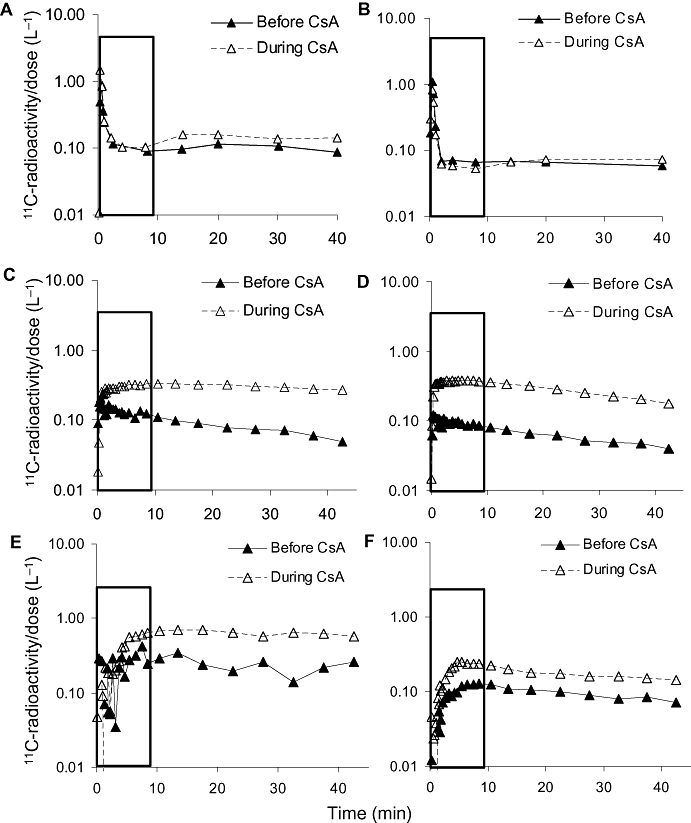
Plasma (A,B) and tissues (C–F) total 11C-radioactivity concentration-time profiles after 11C-verapamil administration in a representative animal at mid- (A,C,E) and late (B,D,F) gestation in the absence and presence of 12 mg·kg−1·h−1 cyclosporin A (CsA). The rectangle highlights the first 0–9 min. CsA did not affect the plasma concentration-time profiles of 11C-radioactivity. In contrast, CsA increased the distribution of radioactivity into the maternal brain (C,D) and the fetal liver (E,F).
The effect of gestational age on P-gp activity (change in AUCR with CsA infusion) was assessed and is reported for maternal brain in seven animals at mid-gestation and in five animals at late gestation. In one animal (at mid-gestation), image artifacts due to retained radioactivity in the maternal bladder resulting from bladder catheter obstruction, rendered image data outside the brain unreliable. Thus, the concentrations in tissues, other than maternal brain, were evaluated in six animals (three for each CsA dose).
The greatest effect of CsA on the distribution of 11C-radioactivity was in the maternal brain and the fetal liver (Figure 6). CsA effect on P-gp activity at the maternal BBB appeared to be dose-dependent at mid-gestation (Supporting Information Table S1). Following administration of 12 mg·kg−1·h−1 and 24 mg·kg−1·h−1 CsA to animals at mid-gestation, the AUCR (corrected for vascular contamination) for maternal brain increased by 134 ± 41% and 201 ± 96% respectively. At late gestation, the corresponding increases were 359 ± 201% and 303 ± 53%. Overall, the effect of CsA on maternal brain AUCR at late gestation was greater than that at mid gestation (Figure 6). Similar results were obtained when AUCR was analyzed at 4 min from verapamil administration (319 ± 174% vs. 142 ± 90%, P= 0.03; data not shown). To confirm this observation, we analyzed the data for three animals that were studied at both gestational ages (paired data). In this subset, the effect of CsA on 11C-radioactivity distribution into the brain was also greater at late versus mid-gestation (313 ± 42% and 147 ± 84% respectively) (Table 2). Likewise, the mean fetal liver AUC ratio increased from 28% to 94% in two of these animals (Table 2). The fetal liver uptake was not evaluable in the third animal during mid-gestation, as described above. In contrast to maternal brain, the magnitude of change in fetal liver AUCR did not appear to depend on CsA dose (Supporting Information Table S1). When all the animals in each gestational age (including those that delivered a non-viable fetus) were pooled to increase statistical power, the effect of CsA on the distribution of radioactivity into the fetal liver was greater at late versus mid-gestation (Figure 6). At 4 min, the changes were 123 ± 60% and 1 ± 30% respectively (P < 0.01). For those animals that delivered a viable infant the corresponding increases for fetal liver AUCR at 9 min were 104 ± 53% (n= 4) and 45 ± 23% (n= 4) respectively. When compared with maternal BBB and fetal liver, the effect of CsA on the distribution of 11C-radioactivity into other tissues was much less (Supporting Information Table S1).
Figure 6.
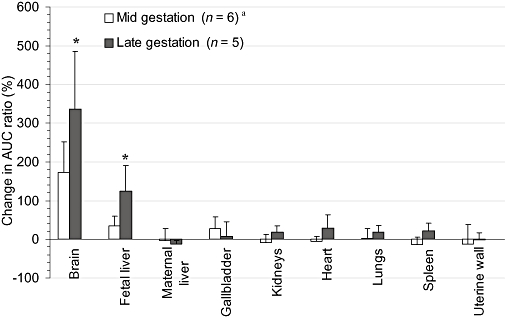
The cyclosporin A (CsA)-induced percent change in the distribution of 11C-radioactivity into maternal tissues and the fetus during mid- and late gestation. The effect of CsA on the distribution of 11C-radioactivity was significantly greater at late gestation versus mid-gestation for the placenta, maternal brain, kidneys and spleen. Data are expressed as mean ± standard deviation (n= 4). *P < 0.05 when the percent change in area under the curve (AUC) ratio at mid-gestation is compared with that at late gestation. aMaternal brain P-gp activity was studied in seven macaques.
Table 2.
The effect of gestational age on maternal brain and fetal liver AUCR in the presence and absence of CsA in animals that were studied at both mid- and late gestation
| Mid-gestation | Late gestation | |||||||||||||
|---|---|---|---|---|---|---|---|---|---|---|---|---|---|---|
| AUCbrain: AUCplasma | AUCfetal liver: AUCplasma | AUCbrain: AUCplasma | AUCfetal liver : AUCplasma | |||||||||||
| Animal identifier | Blood CsA concentration (µM) | Without CsA | With CsA | Increase(%) | Without CsA | With CsA | Increase(%) | Blood CsA concentration (µM) | Without CsA | With CsA | Increase(%) | Without CsA | With CsA | Increase (%) |
| 02088 | 6.1 | 1.08 | 2.26 | 110 | 1.33 | 1.83 | 38 | 8.2 | 0.92 | 4.00 | 334 | 0.65 | 1.64 | 153 |
| 04052 | 25.8 | 1.21 | 4.15 | 243 | 1.93 | 2.27 | 18 | 21.0 | 1.10 | 4.84 | 341 | 1.12 | 1.52 | 36 |
| 02091 | 25.0 | 1.77 | 3.32 | 88 | ND | ND | ND | 17.9 | 1.16 | 4.22 | 265 | 0.72 | 2.21 | 209 |
AUCR, area under the time–concentration curve; ND, fetal liver radioactivity of this animal could not be interpreted during mid gestation due to image artifacts.
Tissue blood flow
Basal (without CsA) cerebral, renal, hepatic, splenic and uterine blood flow of the dams measured by 15O-water were 1.09 ± 0.50, 3.27 ± 1.59, 1.14 ± 0.60, 3.35 ± 1.37 and 0.21 ± 0.12. Across 10 animals (five at each gestational age), CsA increased cerebral, renal, hepatic and splenic blood flow by 3 ± 44, 26 ± 68, 7 ± 41 and 6 ± 33% respectively. The shape and location of the placenta made it difficult to reliably measure tracer uptake into this organ. However, uterine blood flow decreased by 21 ± 32% (25 ± 30% and 14 ± 44% in subjects with good and poor fetal outcome, respectively) with the administration of CsA. Nevertheless, none of these changes were statistically significant. Furthermore, the AUCR of maternal brain and fetal liver either before or during CsA administration did not correlate with maternal cerebral blood flow and uterine blood flow respectively.
Discussion and conclusions
We have established and validated a non-invasive PET imaging method for simultaneous measurement of P-gp activity and inhibition in multiple tissues of M. nemestrina (Eyal et al., 2009). In the current study we applied this method to evaluate the effect of gestational age on P-gp activity in maternal tissues and the placenta. As we previously reported (Eyal et al., 2009), radioactivity in the fetal compartment was detected primarily in the fetal liver and this uptake served as an excellent indicator of the maternal-fetal transfer of verapamil across the placenta. Placental location and its high intravascular blood content made it difficult to readily identify and estimate tracer uptake into the organ. We confined all our analyses to 9 min because tissue distribution was complete and the majority (66%) of radioactivity was verapamil and its metabolite, D-617, a P-gp substrate (Eyal et al., 2009). In addition, for statistical analysis, we pooled the data obtained at the 12 and 24 mg·kg−1·h−1 CsA doses because in most tissues, the effect of CsA was independent of the dose (Supporting Information Table S1).
The major finding of our study is that P-gp activity in maternal brain and in the placenta increases with gestational age. In the absence of CsA, the accumulation of 11C-radioactivity in the fetal liver tended to be lower at late- versus mid-gestational age (fetal liver AUCR = 0.9 ± 0.2 vs. 2.0 ± 1.4), although this difference was not statistically significant, probably due to the large inter-subject variability. These data are suggestive of greater placental P-gp activity at late gestation. Consistent with this observation, the effect of CsA on the distribution of 11C-radioactivity into the fetal liver was significantly greater at late gestation versus mid-gestation (125 ± 66% vs. 35 ± 25%, P= 0.030). Therefore, we conclude that placental P-gp activity increases from mid- to late gestation. This may seem at odds with previous reports of decreased P-gp expression in human placenta (per milligram of protein) with increasing gestational age (Gil et al., 2005; Mathias et al., 2005; Sun et al., 2006). However, as the total mass of placenta and the villus surface area increase during gestation (van der Aa et al., 1998; Cunningham et al., 2005), there will be a commensurate increase in the total amount of placental P-gp activity even if the activity per milligram tissue decreases. Alternatively, this might be due to a species difference between humans and non-human primates. Yet another explanation for this observation may be an increase in fetal liver verapamil metabolizing activity. If verapamil metabolites are sequestered in the fetal liver or excreted into the bile, a gestational age-dependent increase in activity of the enzymes that metabolize verapamil will result in increased accumulation of 11C-radioactivity in the fetal liver (or bile) as pregnancy proceeds. The increase in P-gp activity at the maternal BBB and the placenta with gestational age is best demonstrated in each of the three animals that were studied at both mid- and late gestation (paired studies). In these animals, the effect of CsA on maternal brain and fetal liver AUCR was greater at late versus mid-gestation (Table 2).
In contrast to the changes in P-gp activity in maternal brain and the placenta, the modest P-gp activity in other organs did not change significantly with gestational age. These results are consistent with our finding that renal, hepatic and intestinal P-gp activity (as measured by intravenous and oral administration of digoxin), are not affected by pregnancy (Zhang et al., 2009).
In most tissues, the effect of CsA did not depend on the dose (Supporting Information Table S1). This is most likely due to complete inhibition of P-gp in these tissues at both CsA doses. In contrast, the effect of CsA at the maternal BBB, which is rich in P-gp (Endres et al., 2006), appeared to be dose-dependent, especially at mid-gestation (Supporting Information Table S1). These results suggest a lower sensitivity of P-gp at the BBB to pharmacological inhibition, consistent with previous reports where inhibition of P-gp at the BBB by tariquidar was studied in mice (Choo et al., 2006) and rhesus monkeys (Kurdziel et al., 2003). The reason for this tissue-dependent sensitivity to inhibition is not clear. However, it may be related to the higher P-gp expression at the BBB, resulting in an ‘apparent’ increase in the EC50 of CsA (Litman et al., 2003; Choo et al., 2006). As to why this effect is not present at late gestation is not clear. Nevertheless, the overall effect of CsA inhibition at the maternal BBB was significantly increased with gestational age.
Despite the successful outcome of 9 of the 12 studies, three studies were followed by delivery of stillborn fetuses. All the procedures were conducted according to NIH guidelines and uterine 15O-water activity and fetal liver 11C-verapamil uptake were demonstrated in these three animals throughout the PET study. Although fetal toxicity of CsA cannot be ruled out, this incidence of fetal loss, though unusual for human pregnancy, is within that reported in pregnant macaques (Sackett, 1990; Sesbuppha et al., 2008). In addition, preterm birth and fetal loss have been described in previous PET imaging studies in pregnant macaques (Benveniste et al., 2003; 2005;). Of note, the impact of CsA on uterine blood flow was not greater in animals that had poor fetal outcomes, as compared with those that delivered a viable infant. In addition, the fetal liver AUCR (with and without CsA) was similar in both sets of animals.
Our estimation of tissue blood flow and variability in cerebral blood flow is within the range reported previously in non-pregnant macaques (Altman and Dittmer, 1974; Eichling et al., 1975). The AUCR of maternal brain and fetal liver either before or during CsA administration did not correlate with maternal cerebral blood flow and uterine blood flow respectively. The lack of correlation suggests that the distribution of 11C-radioactivity into these tissues is not flow-dependent, as has been previously shown for the rat brain (Bart et al., 2003). Therefore, changes in blood flow cannot explain the CsA-induced changes in AUCR. We also measured metabolism of 11C-verapamil to assess the possibility that this factor confounded our interpretation of the effect of gestational age on the distribution of 11C-radioactivity. Gestational age and CsA did not appear to alter the degree of verapamil metabolism (Figure 2). Thus, verapamil metabolism could not have significantly influenced the distribution of 11C-radioactivity into maternal tissues or the fetal compartment.
For the three animals that were treated with 12 mg·kg−1·h−1 CsA, the duration between the onset of CsA infusion and the administration of 11C-verapamil was shortened from 60 to 30 min. However, at this CsA dose, pseudo steady-state concentrations were achieved within the first 30 min of infusion (Figure 2). Assuming that the extent of P-gp inhibition is determined by the inhibitor concentration and not by the duration of inhibition, the different time of exposure to comparable CsA concentrations is not expected to affect the tissue:plasma AUC ratio of 11C-radioactivity. Whereas, at mid-gestation, CsA blood concentrations were relatively constant after the 24 mg·kg−1·h−1 infusion rate, this was not the case for late gestation. But, this does not confound the interpretation of our data, as CsA blood concentrations were beyond those necessary to produce maximal inhibition.
Our measure of P-gp activity (percent increase in tissue distribution of verapamil-related 11C-radioactivity in the presence of CsA) is based on the assumption that the combination of verapamil and CsA results in inhibition of only P-gp (Sasongko et al., 2005; Eyal et al., 2009). However, we cannot exclude the possibility that in certain organs, verapamil and CsA could interact through organic cation transporters (OCTs), the OCT novel type II (OCTN2), or other transporters (Treiber et al., 2004; Endres et al., 2006). At the BBB, our assumption of P-gp specificity of verapamil and CsA is reasonable given the transporters expressed at this location and the lack of potential for verapamil and CsA to respectively be a substrate or inhibitor of BBB transporters other than P-gp.
The mechanisms involved in the tissue-specific increase in P-gp activity with gestational age are currently unknown, but may include tissue-specific expression of transcription factors/receptors that regulate P-gp or differential activation of these factors by hormonal or other pregnancy-associated changes (Ceckova-Novotna et al., 2006). P-gp expression can be modulated by oestrogens and progesterone (Piekarz et al., 1993; Kalabis et al., 2005) and, as we have shown in the human placenta, by several signaling pathways, including the Wnt pathway (Mikheev et al., 2008).
Tissue-specific inhibition of P-gp activity by CsA has implications for the consequences of drug interactions. CsA had the greatest effect on 11C-radioactivity distribution into the maternal brain followed by the fetal compartment. However, even at the highest CsA blood concentration, the maximum percent increase in brain AUCR of 11C-radioactivity was 3.2-fold. A similar increase of 2.3-fold was observed in male, unanaesthetized macaques (M. mulatta) (Lee et al., 2006). These data are in contrast to the effect of genetic or chemical ablation of P-gp activity in rodents where the increase in brain distribution of verapamil radioactivity was up to 24-fold (Hendrikse and Vaalburg, 2002; Hsiao et al., 2006; Lee et al., 2006). Based on these data, if replicated in humans, the rodent P-gp knockout models may overestimate the potential for P-gp-mediated drug interactions at the human BBB. This may seem at odds with our previous conclusion that the rodent is an excellent predictor of the verapamil-CsA interaction at the BBB (Hsiao et al., 2008). However, there is no discrepancy. Although there is an excellent agreement between the interaction observed at the rat and the human BBB at the lower CsA blood concentrations, our data suggest a divergence between the rat and human as the inhibitor concentration is increased and as P-gp inhibition approaches a maximum. To test this hypothesis, additional drug interaction studies in humans with inhibitors of P-gp more potent than CsA, such as quinidine or itraconazole, are needed.
Our study demonstrates the power of PET to non-invasively and serially measure P-gp inhibition at multiple tissue : blood barriers. This study as well as our previous report (Eyal et al., 2009) shows that tissue P-gp activity in the non-human primate is highest at the BBB and the placenta. In addition, here we provide the first evidence that tissue P-gp activity at these barriers increase with gestational age. If true in humans, such a change in P-gp activity has implications for the exposure of both the fetus and the maternal brain to drugs that are P-gp substrates. It is possible that drugs that are P-gp substrates and used to treat neurological disorders, such as risperidone, may become less effective as pregnancy proceeds. In contrast, the fetus will be better protected from P-gp substrate drugs as pregnancy proceeds. In addition, our data suggest that P-gp-mediated drug interactions at the placental P-gp barrier are possible but their magnitude, at therapeutic concentrations of CsA, are expected to be modest.
Acknowledgments
This study is a result of the joint effort of the following individuals who we would like to thank: Steve Shoner, Tony Park, Kathryn Bray, Barbara Lewellen, Pam Pham, Lisa Flint, Jeff Stevenson, Paul Chu and Jenne Hoard from the UW Department of Radiology; Mike Gough, Edward Novak, Pat Delio, Bruce Brown, Keith Vogel, Cliff Astley, Maggie Gillen, Carole Elliott, Steve Kelly and Melinda Young from the WaNPRC; Robin Olsen-Scribner from Healthcare Epidemiology and Infection Control UWMC. In addition, we would like to thank Dale Whittington, Andrei Mikheev, Mary Blonski, Suresh Babu Naraharisetti, Brian Kirby, Christopher Endres, Andrew Bostrom, Huixia Zhang and Xiaohui Wu from the UW Department of Pharmaceutics for their superb assistance in conducting this study, and Gene Sackett and Thomas Burbacher from the WaNPRC for fruitful discussions. We thank Knoll AG and Prof. W.L. Nelson from UW Department of Medicinal Chemistry for providing D-617 {3,4-dimethoxy-α-[3-(methylamino)propyl]-α-[1-methylethyl]-benzeneacetonitrile} and norverapamil.
Francisco Chung would like to dedicate this paper to his father who passed away last year.
This study was supported by National Institute of Health grants U10HD047892 (OPRU network), P50HD044404, GM032165 and RR00166.
Glossary
Abbreviations:
- AUC
area under the time–concentration curve
- AUCR
tissue : blood AUC ratio
- CsA
cyclosporin A
- P-gp
P-glycoprotein
Conflict of interest
None.
Supporting information
Additional Supporting Information may be found in the online version of this article:
Table S1 The effect of CsA on tissue AUC/plasma AUC ratios of 11C-radioactivity at mid-gestation and late gestation.
Please note: Wiley-Blackwell are not responsible for the content or functionality of any supporting materials supplied by the authors. Any queries (other than missing material) should be directed to the corresponding author for the article.
References
- Alexander S, Mathie A, Peters J. Guide to Receptors and Channels (GRAC), 3rd edition. Br J Pharmacol. 2008;153(Suppl 2):S1–S209. doi: 10.1038/sj.bjp.0707746. [DOI] [PMC free article] [PubMed] [Google Scholar]
- Altman PL, Dittmer D. Biology Data Book. 2th edn. Bethesda, MD: Federation of American Societies for Experimental Biology; 1974. Vol. III. [Google Scholar]
- Bart J, Willemsen A, Groen H, van der Graaf W, Wegman T, Vaalburg W, et al. Quantitative assessment of P-glycoprotein function in the rat blood-brain barrier by distribution volume of [11C]verapamil measured with PET. Neuroimage. 2003;20:1775–1782. doi: 10.1016/s1053-8119(03)00405-1. [DOI] [PubMed] [Google Scholar]
- Benveniste H, Fowler J, Rooney W, Moller D, Backus W, Warner D, et al. Maternal-fetal in vivo imaging: a combined PET and MRI study. J Nucl Med. 2003;44:1522–1530. [PubMed] [Google Scholar]
- Benveniste H, Fowler JS, Rooney W, Ding YS, Baumann AL, Moller DH, et al. Maternal and fetal 11C-cocaine uptake and kinetics measured in vivo by combined PET and MRI in pregnant nonhuman primates. J Nucl Med. 2005;46:312–320. [PubMed] [Google Scholar]
- Ceckova-Novotna M, Pavek P, Staud F. P-glycoprotein in the placenta: expression, localization, regulation and function. Reprod Toxicol. 2006;22:400–410. doi: 10.1016/j.reprotox.2006.01.007. [DOI] [PubMed] [Google Scholar]
- Choo EF, Kurnik D, Muszkat M, Ohkubo T, Shay SD, Higginbotham JN, et al. Differential in vivo sensitivity to inhibition of P-glycoprotein located in lymphocytes, testes, and the blood-brain barrier. J Pharmacol Exp Ther. 2006;317:1012–1018. doi: 10.1124/jpet.105.099648. [DOI] [PubMed] [Google Scholar]
- Christman DR, Finn RD, Karlstrom KI, Wolf AP. The production of ultra high activity 11C-labeled hydrogen cyanide, carbon dioxide, carabon monoxide and methane via the 14N(p,α)11C reaction (XV) Int J Appl Radiat Isot. 1975;26:435–442. [Google Scholar]
- Clark J, Buckingham P. Short-lived Radioactive Gases for Clinical Use. London, Boston: Butterworth; 1975. pp. 150–156. [Google Scholar]
- Cunningham F, Leveno K, Bloom S, Hauth J, Gilstrap L, Wenstrom K. Williams Obstetrics. New York: McGraw-Hill; 2005. [Google Scholar]
- Eichling J, Raichle M, Grubb RJ, Larson K, Ter-Pogossian M. In vivo determination of cerebral blood volume with radioactive oxygen-15 in the monkey. Circ Res. 1975;37:707–714. doi: 10.1161/01.res.37.6.707. [DOI] [PubMed] [Google Scholar]
- Endres C, Hsiao P, Chung F, Unadkat J. The role of transporters in drug interactions. Eur J Pharm Sci. 2006;27:501–517. doi: 10.1016/j.ejps.2005.11.002. [DOI] [PubMed] [Google Scholar]
- Eyal S, Chung F, Muzi M, Link J, Mankoff D, Kaddoumi A, et al. Simultaneous PET imaging of P-plycoprotein inhibition in multiple tissues in the pregnant non-human primate. J Nucl Med. 2009;50:798–806. doi: 10.2967/jnumed.108.059360. [DOI] [PMC free article] [PubMed] [Google Scholar]
- Gil S, Saura R, Forestier F, Farinotti R. P-glycoprotein expression of the human placenta during pregnancy. Placenta. 2005;26:268–270. doi: 10.1016/j.placenta.2004.05.013. [DOI] [PubMed] [Google Scholar]
- Hendrikse N, Vaalburg W. Dynamics of multidrug resistance: P-glycoprotein analyses with positron emission tomography. Methods. 2002;27:228–233. doi: 10.1016/s1046-2023(02)00079-8. [DOI] [PubMed] [Google Scholar]
- Hsiao P, Sasongko L, Link J, Mankoff D, Muzi M, Collier A, et al. Verapamil P-glycoprotein transport across the rat blood-brain barrier: cyclosporine, a concentration inhibition analysis, and comparison with human data. J Pharmacol Exp Ther. 2006;317:704–710. doi: 10.1124/jpet.105.097931. [DOI] [PubMed] [Google Scholar]
- Hsiao P, Bui T, Ho R, Unadkat J. In vitro to in vivo prediction of P-glycoprotein based drug interactions at the human and rodent blood-brain barrier. Drug Metab Dispos. 2008;36:481–484. doi: 10.1124/dmd.107.018176. [DOI] [PubMed] [Google Scholar]
- Kalabis G, Kostaki A, Andrews M, Petropoulos S, Gibb W, Matthews S. Multidrug resistance phosphoglycoprotein (ABCB1) in the mouse placenta: fetal protection. Biol Reprod. 2005;73:591–597. doi: 10.1095/biolreprod.105.042242. [DOI] [PubMed] [Google Scholar]
- Kety SS. The theory and application of the exchange of inert gas at the lungs and tissues. Pharmacol Rev. 1951;3:1–41. [PubMed] [Google Scholar]
- Koal T, Deters M, Casetta B, Kaever V. Simultaneous determination of four immunosuppressants by means of high speed and robust on-line solid phase extraction-high performance liquid chromatography-tandem mass spectrometry. J Chromatogr B Analyt Technol Biomed Life Sci. 2004;805:215–222. doi: 10.1016/j.jchromb.2004.02.040. [DOI] [PubMed] [Google Scholar]
- Kohlmeyer S, Vesselle H, Miyaoka R, Kaplan M, Lewellen T. Comparison of recovery coefficients for PET based on maximum and average ROI pixel values [abstract] Eur J Nucl Med Mol Imaging. 2000;27:1027. [Google Scholar]
- Kurdziel K, Kiesewetter D, Carson R, Eckelman W, Herscovitch P. Biodistribution, radiation dose estimates, and in vivo Pgp modulation studies of 18F-paclitaxel in nonhuman primates. J Nucl Med. 2003;44:1330–1339. [PubMed] [Google Scholar]
- Lankas G, Wise L, Cartwright ME, Pippert T, Umbenhauer DR. Placental P-glycoprotein deficiency enhances susceptibility to chemically induced birth defects in mice. Reprod Toxicol. 1998;12:457–463. doi: 10.1016/s0890-6238(98)00027-6. [DOI] [PubMed] [Google Scholar]
- Lee Y, Maeda J, Kusuhara H, Okauchi T, Inaji M, Nagai Y, et al. In vivo evaluation of P-glycoprotein function at the blood-brain barrier in nonhuman primates using [11C]verapamil. J Pharmacol Exp Ther. 2006;316:647–653. doi: 10.1124/jpet.105.088328. [DOI] [PubMed] [Google Scholar]
- Link J, Krohn K, Clark J. Production of [11C]CH3I by single pass reaction of [11C]CH4 with I2. Nucl Med Biol. 1997;24:93–97. doi: 10.1016/s0969-8051(96)00181-3. [DOI] [PubMed] [Google Scholar]
- Litman T, Skovgaard T, Stein W. Pumping of drugs by P-glycoprotein: a two-step process? J Pharmacol Exp Ther. 2003;307:846–853. doi: 10.1124/jpet.103.056960. [DOI] [PubMed] [Google Scholar]
- Mathias AA, Hitti J, Unadkat JD. P-glycoprotein and breast cancer resistance protein expression in human placentae of various gestational ages. Am J Physiol Regul Integr Comp Physiol. 2005;289:R963–R969. doi: 10.1152/ajpregu.00173.2005. [DOI] [PubMed] [Google Scholar]
- Mikheev A, Nabekura T, Kaddoumi A, Bammler T, Govindarajan R, Hebert M, et al. Profiling gene expression in human placentae of different gestational ages: an OPRU Network and UW SCOR Study. Reprod Sci. 2008;15:866–877. doi: 10.1177/1933719108322425. [DOI] [PMC free article] [PubMed] [Google Scholar]
- Mölsä M, Heikkinen T, Hakkola J, Hakala K, Wallerman O, Wadelius M, et al. Functional role of P-glycoprotein in the human blood-placental barrier. Clin Pharmacol Ther. 2005;78:123–131. doi: 10.1016/j.clpt.2005.04.014. [DOI] [PubMed] [Google Scholar]
- O'Sullivan F, Kirrane J, Muzi M, O'Sullivan J, Spence A, Krohn K. Bayesian use of historical data to guide blood input function extraction from dynamic PET studies [abstract] J Nucl Med. 2007;48:157P. [Google Scholar]
- Piekarz R, Cohen D, Horwitz S. Progesterone regulates the murine multidrug resistance mdr1b gene. J Biol Chem. 1993;268:7613–7616. [PubMed] [Google Scholar]
- Sackett G. Sires influence fetal death in pigtailed macaques (Macaca nemestrina) Am J Primatol. 1990;20:13–22. doi: 10.1002/ajp.1350200103. [DOI] [PubMed] [Google Scholar]
- Sasongko L, Link J, Muzi M, Mankoff D, Yang X, Collier A, et al. Imaging P-glycoprotein transport activity at the human blood-brain barrier with positron emission tomography. Clin Pharmacol Ther. 2005;77:503–514. doi: 10.1016/j.clpt.2005.01.022. [DOI] [PubMed] [Google Scholar]
- Sesbuppha W, Chantip S, Dick EJ, Schlabritz-Loutsevitch N, Guardado-Mendoza R, Butler S, et al. Stillbirths in Macaca fascicularis. J Med Primatol. 2008;37:169–172. doi: 10.1111/j.1600-0684.2007.00275.x. [DOI] [PMC free article] [PubMed] [Google Scholar]
- Smit J, Huisman M, van Tellingen O, Wiltshire H, Schinkel A. Absence or pharmacological blocking of placental P-glycoprotein profoundly increases fetal drug exposure. J Clin Invest. 1999;104:1441–1447. doi: 10.1172/JCI7963. [DOI] [PMC free article] [PubMed] [Google Scholar]
- Sudhakaran S, Rayner C, Li J, Kong D, Gude N, Nation R. Inhibition of placental P-glycoprotein: impact on indinavir transfer to the foetus. Br J Clin Pharmacol. 2008;65:667–673. doi: 10.1111/j.1365-2125.2007.03067.x. [DOI] [PMC free article] [PubMed] [Google Scholar]
- Sun M, Kingdom J, Baczyk D, Lye SJ, Matthews SG, Gibb W. Expression of the multidrug resistance P-glycoprotein, (ABCB1 glycoprotein) in the human placenta decreases with advancing gestation. Placenta. 2006;27:602–609. doi: 10.1016/j.placenta.2005.05.007. [DOI] [PubMed] [Google Scholar]
- Treiber A, Schneiter R, Delahaye S, Clozel M. Inhibition of organic anion transporting polypeptide-mediated hepatic uptake is the major determinant in the pharmacokinetic interaction between bosentan and cyclosporin A in the rat. J Pharmacol Exp Ther. 2004;308:1121–1129. doi: 10.1124/jpet.103.061614. [DOI] [PubMed] [Google Scholar]
- Unadkat J, Chung F, Sasongko L, Whittington D, Eyal S, Mankoff D, et al. Rapid solid-phase extraction method to quantify [11C]-verapamil, and its [11C]-metabolites, in human and macaque plasma. Nucl Med Biol. 2008;35:911–917. doi: 10.1016/j.nucmedbio.2008.08.001. [DOI] [PMC free article] [PubMed] [Google Scholar]
- van der Aa E, Peereboom-Stegeman J, Noordhoek J, Gribnau F, Russel F. Mechanisms of drug transfer across the human placenta. Pharm World Sci. 1998;20:139–148. doi: 10.1023/a:1008656928861. [DOI] [PubMed] [Google Scholar]
- Zhang H, Wu X, Naraharisetti SB, Chung F, Whittington D, Mirfazaelian A, et al. Pregnancy does not increase CYP3A or P-glycoprotein activity in the non-human primate, Macaca nemestrina. J Pharmacol Exp Ther. 2009;330:586–595. doi: 10.1124/jpet.109.153569. [DOI] [PMC free article] [PubMed] [Google Scholar]
Associated Data
This section collects any data citations, data availability statements, or supplementary materials included in this article.