Abstract
Our group tested three quality assessment functions in CASP8: a function which used only distance constraints derived from alignments (SAM-T08-MQAO), a function which added other single-model terms to the distance constraints (SAM-T08-MQAU), and a function which used both single-model and consensus terms (SAM-T08-MQAC).
We analyzed the functions both for ranking models for a single target and for producing an accurate estimate of GDT_TS. Our functions were optimized for the ranking problem, so are perhaps more appropriate for metaserver applications than for providing a trustworthiness estimate for single models.
On the CASP8 test, the functions with more terms performed better. The MQAC consensus method was substantially better than either single-model function, and the MQAU function was substantially better than the MQAO function that used only constraints from alignments.
1 Introduction
In CASP7 and CASP8, groups submitting QMode1 quality assessment predictions were asked to evaluate all protein structure predictions made by servers and assign a number between zero and one that predicts the quality as measured by GDT_TS.[1, 2, 3] In a previous paper, we compare our quality assessment method to other methods performing well on the CASP7 data set;[4, 5, 6, 7, 8] in this paper we examine how our methods fared during the CASP8 experiment. There are two possible goals of quality assessment. First, metaservers need to choose among possible predictions to select the best structure or structures. Second, the chemists and biologists who ultimately use structure predictions need to know how much to trust a prediction.
For a metaserver, one is interested in selecting the best model(s) out of a pool of models for a given target amino acid sequence. Each target’s structural predictions can be considered independently, and the ranking of the models is what matters, not the actual values assigned. This implies the use of a rank-based statistic like Spearman’s ρ or Kendall’s τ, except that we mainly care about the top-scoring models, as the detailed ranking of the models that are to be discarded is unimportant. We have previously defined a weighted version of Kendall’s τ that we called τα.[4] The measure is equivalent to Kendall’s τ when α = 0, but as α becomes larger, more weight is shifted to the predicted best models.
Determining the trustworthiness of a model is a different problem, as we want to be able to evaluate single models independent of a pool of models. Furthermore, for users to be able to interpret the results, the predicted quality of models must be on a similar scale irrespective of the target sequence. An obvious method for measuring this is to compute the correlation between predicted and actual quality for all models and targets pooled together. Pearson’s r is ideal for measuring linear correlation, but the metric, while still defined, often loses some of its intuitive statistical properties when the underlying data deviates dramatically from a bivariate normal. Consequently, a nonparametric measure may sometimes be appropriate; a high correlation from a rank-based measure at least suggests that some function is capable of transforming the predicted quality into something more linearly correlated with actual quality.
Not only do the two applications differ in how they should be evaluated, but they differ in what data they have available. For the metaserver application, we inherently have a pool of models, while for determining trustworthiness, we may have only a single model to work with. In either application, there may be additional information outside the model that can be used. For example, a metaserver may know the historical accuracy of different servers, and trustworthiness may be determined in part from the length and significance of alignments to templates that could have been used in creating a model.
For this paper, we look at the three functions we used for model quality assessment in CASP8: MQAO, MQAU, and MQAC. The first two are single-model evaluations that do not rely on having a pool of models, while the third includes a consensus term that predicts a model as being better if it is similar to other models in the pool. All three functions are anonymous, history-less methods, using only the models themselves, and not what servers created them nor how good the servers claimed the models to be.
One of the more disappointing results revealed at the CASP8 meeting is that nonconsensus functions are still substantially poorer than consensus functions at predicting the trustworthiness of a model.
2 Methods
When performing structure prediction, our lab uses Undertaker[9] to assemble alignments and fragments and to refine the resulting structures into more polished models. As part of this process Undertaker uses a cost function to rank structures. The cost function is a weighted sum of individual terms, each of which measures a feature that is (ideally) associated with better models. The terms measure consistency with neural-net-predicted local structure features; consistency with distance constraints derived from alignments or neural net predictions; deviations from physical reality, such as chain breaks or clashes; number and quality of hydrogen bonds; and many other features.
We submitted three sets of QMode1 predictions under three group names. The MQAO group used only distance constraints extracted from alignments to make quality predictions.[10] The MQAU group used Undertaker’s cost function terms in addition to the alignment-based constraints. MQAC included simple consensus terms previously described by Qiu et al.[5] in addition to the alignment constraints and Undertaker cost function terms.
2.1 Cost Function Optimization
To set weights on individual cost function components, we used a greedy algorithm described previously.[4] The training set consisted of all CASP7 targets for which structures were available in PDB.[11] We also used the same set to do a sigmoidal fit of the cost function to GDT_TS, and submitted the rescaled cost function values in CASP8. This rescaling does not affect the target rankings, but does increase the usefulness of the measure as an absolute trustworthiness predictor.
2.2 Consensus Terms
We did not develop new consensus methods, but included the median GDT_TS and median TM-score terms described by Qiu et al.[5] in the optimization for the MQAC function. As implemented for CASP8, the median GDT_TS was computed for each server model by computing GDT_TS for it compared to each model that was labeled model 1 by a server and taking the median. This simple anonymous consensus function is surprisingly effective at identifying good models.
2.3 High/Low E-value Split
For the MQAU and MQAC functions, we divided the targets into two sets: those for which the SAM-T08-server found a template with low E-value, and those for which it did not. We did optimizations separately for the low E-value and high E-value targets of CASP7, and chose which function to use based on the E-value for the CASP8 target. In analysis after CASP8, it appears that this split was not worthwhile, and we would have done as well or better by using a single cost function trained on all the CASP7 targets (the τ3 target correlation would have increased from 0.565 to 0.577). The supplementary material includes the weights and terms for both the high E-value and the low E-value cost functions for MQAC and MQAU.
3 Results
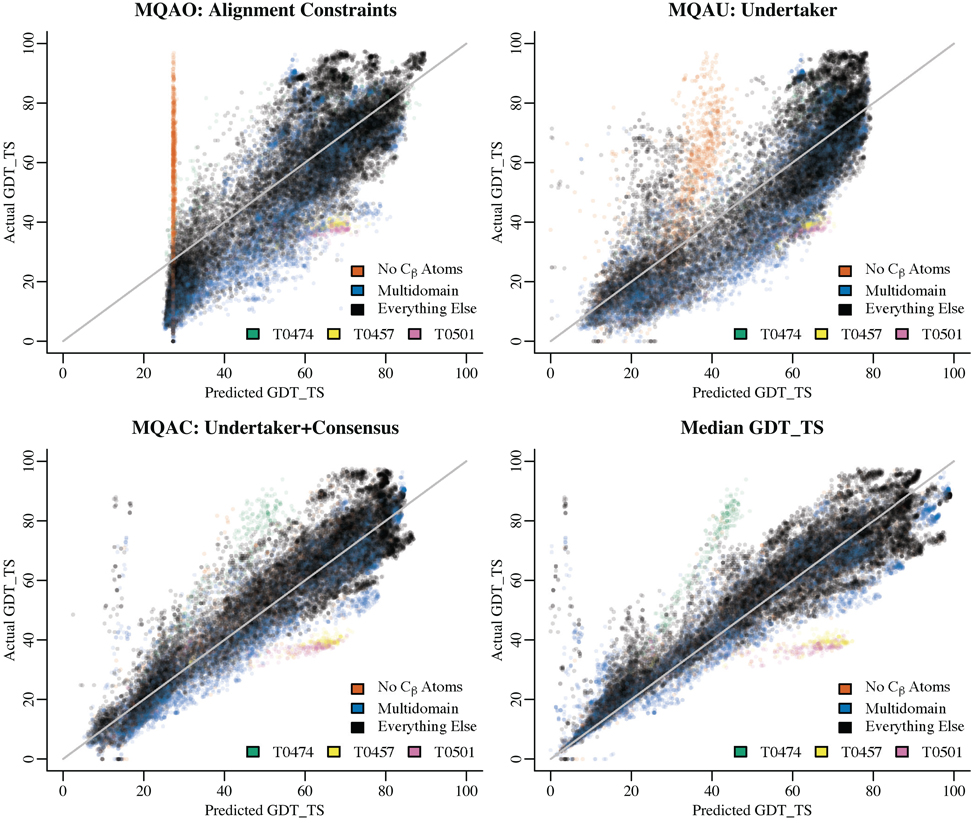
Figure 1 shows the distribution for GDT_TS versus each of our three functions and the pure median GDT_TS consensus method. These plots show how our functions perform as a trustworthiness measure. The supplementary material contains an identical figure for domains instead of targets which shows a greater spread, especially for multidomain models. Note that we compute GDT_TS scores locally and are missing data for targets where the experimental structures have not yet been deposited in the PDB.[11]
Figure 1.
Predicted and actual GDT_TS scores for all targets and all servers. For each QA function, a plot shows GDT_TS versus the predicted quality. Three of the plots are for submissions by groups MQAO, MQAU, and MQAC. Median GDT_TS is the pure consensus term, which we did not submit to CASP8. On the consensus plots, the models we examined with a near-zero predicted GDT_TS score but a high actual GDT score had file format issues such as an early TER record which likely prevented the reading of much of the PDB file. The outlying group at about (40, 80) on the median GDT_TS plot is target T0474 where much of the target is disordered. Predictions for T0474 were inconsistent for the disordered regions, resulting in a low predicted GDT_TS using the consensus-based measures. The outlying group at about (60, 40) on the median GDT_TS plot is composed of targets T0457 and T0501; both are two-domain targets with fairly consistent predictions. The predictions are accurate for each domain, but the domain packing is incorrect, resulting in a low GDT_TS score for the targets as a whole.
The function using only alignment constraints has a very large number of points near the minimum predicted GDT_TS value: these are from models that lack Cβ atoms, which are needed for the constraints. If we had run the models with missing sidechains through SCWRL[12] before scoring them, our nonconsensus functions would have been capable of assigning a meaningful score to these models.
The same set of models cause much of the left-hand cloud (low predicted GDT_TS and high observed GDT_TS) for the MQAU function, though the extra terms in the cost function help ameliorate the problem.
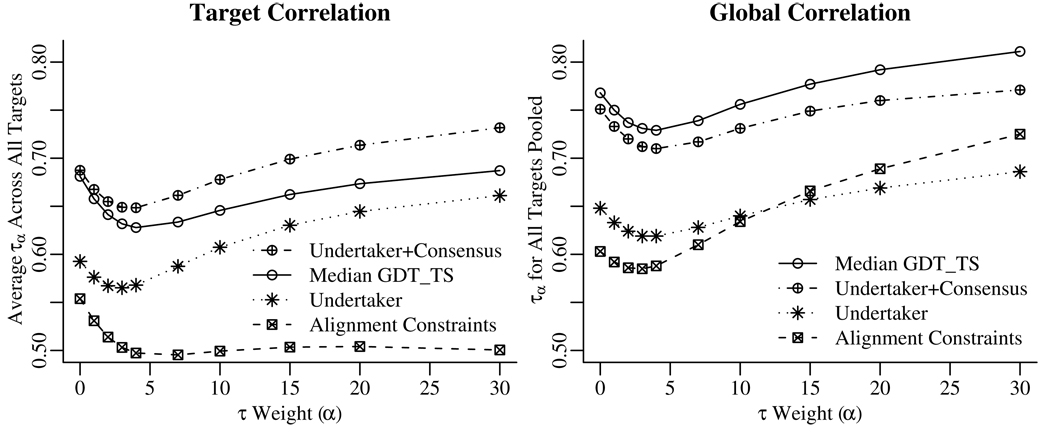
Figure 2 shows how the τα correlation value varies with α for each of the prediction functions. The target correlation plot shows that adding the undertaker cost function terms to the consensus functions does improve the ranking of models for a given target, particularly for the best-scoring models. The global correlation plot in Figure 2 shows that median GDT_TS provides a better between-target ordering than our MQA functions, especially for the easier targets.
Figure 2.
Correlation values for each function. Increasing values of α place increasing weight on the predicted-best set of models. An α value of 0 is equivalent to Kendall’s τ, treating all models equally. Values of 0, 3, 5, 15, and 30 place half of the weight on the top 50%, 23%, 14%, 5%, and 2.3% of models. The target correlation plot shows the average τα values over all targets, with correlation computed separately for each target. The global correlation plot shows the τα values computed from combining all predictions into a single set. Adding Undertaker cost function terms to the consensus median GDT_TS method improved the ranking of models within a target, particularly when concentrating on the top-scoring models. Median GDT_TS alone is a better predictor of raw GDT_TS value, especially for picking out the easy targets, but does not do as well at ranking models for a given target. Furthermore, the alignment based constraints do better globally than the Undertaker cost functions (which include the alignment based constraints) for ranking the most accurate models; thus, the quality of these models can be better judged by consistency with alignments alone. “Alignment Constraints” is MQAO, “Undertaker” is MQAU, “Undertaker+Consensus” is MQAC, and “Median GDT_TS” is the pure consensus term, which we did not submit to CASP8.
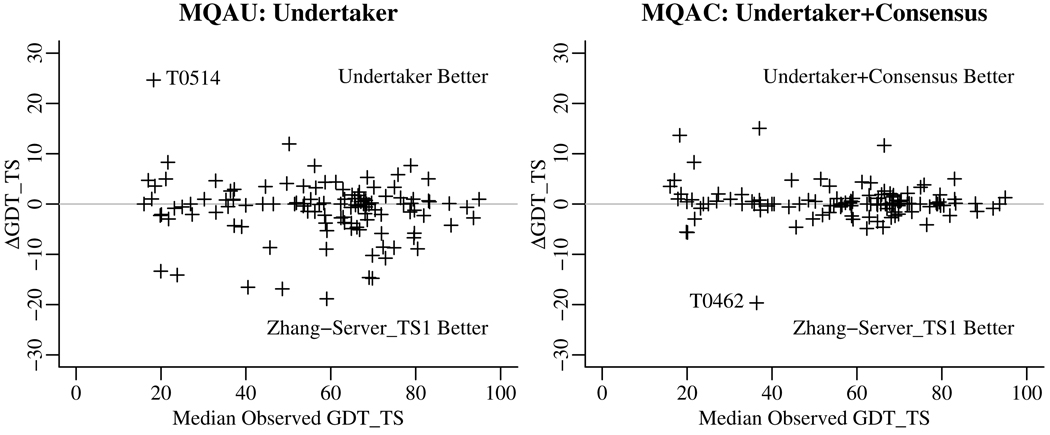
Because our MQA functions were optimized for within-target ranking, we were curious to see how they would have performed if used as a metaserver. Figure 3 compares how a metaserver given all the CASP8 servers as input would have performed compared to the best single server in the pool (the Zhang server[13]). The nonconsensus MQAU function does poorer than just selecting the Zhang server, but the MQAC function with the consensus term appears to do slightly better in some cases.
Figure 3.
Undertaker (MQAU) and Undertaker+Consensus (MQAC) functions as metaservers compared to the best single server in the pool. The median observed GDT_TS score of all server models is used as a proxy for target difficulty. The Zhang server seems to do better against the Undertaker cost functions alone, but the consensus measure fares better. Neither difference is statistically significant. T0514 was a target where the Zhang server prediction, uncharacteristically, was not among the top models. T0462 is a target where only a minority of the servers, including the Zhang server, had relatively good predictions, and the consensus score was less informative.
4 Conclusions
Single-model model quality assessment is still not as effective as consensus-based techniques. Some small technical corrections could make a substantial improvement in the single-model functions. Had we used the latest version of Undertaker (which fixes some bugs in the cost functions), trained on all the SCWRL’ed CASP7 predictions, and made quality predictions with the SCWRL’ed CASP8 server predictions (to add Cβ atoms), the τ3 target correlation would have increased from 0.565 to 0.590.
Simple anonymous consensus methods like median GDT_TS still do surprisingly well, both at ranking models for a single target and for getting between-target rankings. Within-target rankings can be improved by adding constraints from alignments and other terms to the cost functions.
Supplementary Material
Acknowledgments
This work was supported in part by NIH grants R01 GM068570 and T32 GM070386.
References
- 1.Moult J, Pedersen JT, Judson R, Fidelis K. A large-scale experiment to assess protein structure prediction methods. Proteins. 1995;23(3):ii–v. doi: 10.1002/prot.340230303. [DOI] [PubMed] [Google Scholar]
- 2.Cozzetto D, Kryshtafovych A, Ceriani M, Tramontano A. Assessment of predictions in the model quality assessment category. Proteins. 2007;69(S8):175–183. doi: 10.1002/prot.21669. [DOI] [PubMed] [Google Scholar]
- 3.Zemla A. LGA: A method for finding 3D similarities in protein structures. Nucleic Acids Res. 2003;31(13):3370–3374. doi: 10.1093/nar/gkg571. [DOI] [PMC free article] [PubMed] [Google Scholar]
- 4.Archie J, Karplus K. Applying Undertaker cost functions to model quality assessment. Proteins. 2009;75(3):550–555. doi: 10.1002/prot.22288. [DOI] [PMC free article] [PubMed] [Google Scholar]
- 5.Qiu J, Sheffler W, Baker D, Noble WS. Ranking predicted protein structures with support vector regression. Proteins. 2008;71(3):1175–1182. doi: 10.1002/prot.21809. [DOI] [PubMed] [Google Scholar]
- 6.Zhou H, Skolnick J. Protein model quality assessment prediction by combining fragment comparisons and a consensus Cα contact potential. Proteins. 2008;71(3):1211–1218. doi: 10.1002/prot.21813. [DOI] [PMC free article] [PubMed] [Google Scholar]
- 7.Wallner B, Elofsson A. Prediction of global and local model quality in CASP7 using Pcons and ProQ. Proteins. 2007;69(S8):184–193. doi: 10.1002/prot.21774. [DOI] [PubMed] [Google Scholar]
- 8.McGuffin LJ. Benchmarking consensus model quality assessment for protein fold recognition. BMC Bioinformatics. 2007;8:345. doi: 10.1186/1471-2105-8-345. [DOI] [PMC free article] [PubMed] [Google Scholar]
- 9.Karplus K, Karchin R, Draper J, Casper J, Mandel-Gutfreund Y, Diekhans M, Hughey R. Combining local-structure, fold-recognition, and new fold methods for protein structure prediction. Proteins. 2003;53(S6):491–496. doi: 10.1002/prot.10540. [DOI] [PubMed] [Google Scholar]
- 10.Paluszewski M, Karplus K. Model quality assessment using distance constraints from alignments. Proteins. 2009;75(3):540–549. doi: 10.1002/prot.22262. [DOI] [PMC free article] [PubMed] [Google Scholar]
- 11.Deshpande N, Addess KJ, Bluhm WF, Merino-Ott JC, Townsend-Merino W, Zhang Q, Knezevich C, Xie L, Chen L, Feng Z, Green RK, Flippen-Anderson JL, Westbrook J, Berman HM, Bourne PE. The RCSB protein data bank: a redesigned query and relational database based on the mmCIF schema. Nucleic Acids Res. 2005;33(Database issue):233–237. doi: 10.1093/nar/gki057. [DOI] [PMC free article] [PubMed] [Google Scholar]
- 12.Canutescu AA, Shelenkov AA, Dunbrack RLJ. A graph-theory algorithm for rapid protein side-chain prediction. Protein Sci. 2003;12(9):2001–2014. doi: 10.1110/ps.03154503. [DOI] [PMC free article] [PubMed] [Google Scholar]
- 13.Zhang Y. Template-based modeling and free modeling by I-TASSER in CASP7. Proteins. 2007;69(S8):108–117. doi: 10.1002/prot.21702. [DOI] [PubMed] [Google Scholar]
Associated Data
This section collects any data citations, data availability statements, or supplementary materials included in this article.


