

Abstract
Palmitoylation represents a common motif for anchorage of cytosolic proteins to the plasma membrane. Being reversible, it allows for controlled exchange between cytosolic and plasma membrane-bound subpopulations. In this study, we present a live cell single molecule approach for quantifying the exchange kinetics of plasma membrane and cytosolic populations of fluorescently labeled Lck, the key Src family kinase involved in early T cell signaling. Total internal reflection (TIR) fluorescence microscopy was employed for confining the analysis to membrane-proximal molecules. Upon photobleaching Lck-YFP in TIR configuration, fluorescence recovery proceeds first via the cytosol outside of the evanescent field, so that in the early phase fluorescence signal arises predominantly from membrane-proximal cytosolic Lck. The diffusion constant of each molecule allowed us to distinguish whether the molecule has already associated with the plasma membrane or was still freely diffusing in the cytosol. From the number of molecules that inserted during the recovery time we quantified the insertion kinetics: on average, membrane-proximal molecules within the evanescent field needed ∼400 ms to be inserted. The average lifetime of Lck in the plasma membrane was estimated at 50 s; together with the mobility of 0.26 μm2/s this provides sufficient time to explore the surface of the whole T cell before dissociation into the cytosol. Experiments on palmitoylation-deficient Lck mutants yielded similar on-rates, but substantially increased off-rates. We discuss our findings based on a model for the plasma membrane association and dissociation kinetics of Lck, which accounts for reversible palmitoylation on cysteine 3 and 5.
Keywords: Biophysics, Biophysics/Single molecule, Immunology, Membrane/Proteins, Methods/Microscopic Imaging, Protein, Protein/Intracellular Trafficking
Introduction
In recent years, ultrasensitive microscopy has provided a variety of novel insights into the mobility of plasma membrane constituents (1–15). Researchers characterized the motion of transmembrane proteins, but also of molecules that are associated with the plasma membrane via acyl chains such as glycosylphosphatidylinositol (GPI)2-anchored, palmitoylated, or myristoylated proteins. Various types of mobility were described, ranging from free diffusion (1–4) over a confined motion to periods of immobilization (5–15). All these types of motion can be regarded as two-dimensional, i.e. the path of the molecule is restricted to the plasma membrane surface. However, in particular for membrane proteins located in the cytosolic leaflet, the assumption that the molecular path is restricted to a two-dimensional plane may not be fully justified. For example, protein palmitoylation is reversible, and it can thus be expected to result in reversible plasma membrane association of molecules (16). In addition, vice versa, plasma membrane association of a cytosolic protein could be enabled e.g. by acylation via a membrane-bound acyltransferase (17). So in many cases, protein association with or dissociation from the membrane plane may well contribute to the observable path as well as function of the molecule.
Our knowledge of exchange between cytosolic- and membrane-associated fractions of proteins is still rather poor, mainly because of difficulties in determining the turnover rates. Henis et al. (18) described an approach based on Fluorescence Recovery After Photobleaching (FRAP), in which the dependence of recovery rates on the beam size was used to discriminate between recovery by lateral diffusion and by exchange with cytosolic pools. Hammond et al. (19) analyzed the shape of the recovering intensity profile to quantify the off-rate between GFP-labeled pleckstrin homology domains of cytosolic effector molecules and the polyphosphorylated membrane inositols PtdInsP2 and PtdInsP3. Mashanov et al. (20) determined the lifetime of GFP-labeled pleckstrin homology domain at the plasma membrane directly by measuring the length of single-molecule trajectories between association and dissociation, including a correction for photobleaching effects. This approach proved valid and suitable for immobile proteins, but is difficult to implement in the case of mobile proteins: single-molecule trajectories may be truncated not only because of dissociation or photobleaching of the molecule, but also fluorophore blinking (21), due to tracking ambiguities in case of overlapping segments or simply the movement of the molecule out of the observation window. In a recent study, Knight and Falke (22) took a further step by combining single-molecule tracking with total internal reflection (TIR) excitation to study the docking of purified pleckstrin homology domain to artificial supported lipid bilayers.
We present here an approach to study molecular exchange between the plasma membrane and the cytosol in living cells, which enables in particular the analysis of mobile proteins. It combines the advantages of TIR excitation, FRAP, and single-molecule tracking in a single assay and extends our previously introduced method for “thinning out clusters while conserving the stoichiometry of labeling” (TOCCSL) (23). Upon photobleaching of the bottom plasma membrane via an evanescent field, the first molecules entering the bleached regions are analyzed. In this configuration, the exchange from cytosolic pools can be easily discriminated from the recovery of membrane-anchored molecules via the spatial profile of the recovery signal. When performed at the single-molecule level, the method enables a more detailed analysis of the recovering species: for example, mobility analysis allows for identifying and counting those molecules that have inserted into the plasma membrane during the time course of the recovery process.
We used the method to address the exchange dynamics of Lck, the major Src family tyrosine kinase in early T cell signaling (24). Lck is membrane-anchored via N-terminal palmitoylation of the two cysteines at positions 3 and 5 and myristoylation of glycine 2. Double palmitoylation was shown to be required to fully target the protein to the plasma membrane and to function properly in T cell signaling (25). Frequently, we and others (26–30) have observed a significant Lck population in the cytosol of T cells, which may comprise molecules attached to transport vesicles, truncated molecules, or not fully acylated molecules. Here, we directly recorded the insertion of cytosolic Lck, quantified the association rate, and provided an estimate of the lifetime of Lck in the plasma membrane, assuming steady state conditions. Experiments on palmitoylation-deficient mutants yielded a dramatically increased off-rate and were interpreted on the basis of a model that explicitly accounts for reversible acylation on cysteines 3 and 5.
EXPERIMENTAL PROCEDURES
Cell Culture
The Lck-deficient Jurkat T cell line J.Cam1.6 was stably transfected with plasmids encoding Lck-mGFP (31), Lck-YFP (29), Lck-ΔN10-mGFP (31), Lck-C3A-mGFP, or Lck-C5A-mGFP. The cells were cultured in RPMI 1640 medium (with l-glutamine, without Phenol Red; PAA-Laboratories, Linz, Austria, cat. no. E15–848) supplemented with 10% fetal calf serum (PAA-Laboratories, cat. no. A15-151), 1% penicillin-streptomycin, and 1% 1 m Hepes buffer (N-2-hydroxyethylpiperazine-N'2-ethane-sulfonic acid) and incubated at 37 °C in a 5% CO2 atmosphere.
The GFP-GPI plasmid (a kind gift by Jennifer Lippincott-Schwartz, National Institutes of Health, Bethesda, MD) was constructed from the GPI sequence of the human folate receptor (hFR) in the eukaryotic expression vector pJB20. The GFP of this vector was mutated at amino acid position 206 from alanine to lysine to get a monomeric GFP (mGFP) variant (32).
Subcellular Fractionation
Jurkat T cells (1 × 10⁸) were washed in phosphate-buffered saline one time, followed by incubation in 1 ml of hypotonic buffer (42 mm KCl, 10 mm HEPES (pH 7.4) and 5 mm MgCl2) for 15 min at 4 °C. The cell suspension was passed through a 30-gauge needle 10 times. The postnuclear supernatant (PNS) was obtained by centrifugation at 300 × g for 5 min at 4 °C to remove nuclei and intact cells. The PNS was centrifuged further at 150,000 × g for 60 min at 4 °C to separate the cytoplasm from the membrane fraction. The resulting supernatant was collected as cytoplasmic fraction, and the membrane pellet was solubilized for 30 min at 4 °C in radioimmune precipitation assay buffer (50 mm Tris-HCl, pH 8.0, 150 mm NaCl, 1% Nonidet P-40, 0.5% sodium deoxycholate, 0.1% SDS, and protease inhibitors). Volumes of cytoplasmic and membrane fractions loaded for SDS-PAGE were adjusted to represent equal cell numbers.
Microscopy
Experiments were performed on a modified epi-fluorescence microscope (Axiovert 200, Zeiss, Germany), which was equipped with a temperature control system (POCmini (Zeiss)) and custom-built box. Samples were illuminated through a 100× NA = 1.45 Plan-Apochromat objective (Zeiss) using the 488 (excitation of GFP) or 514 nm line (excitation of YFP) of an Ar+-ion laser (Innova, Coherent) at excitation intensities of up to 25 kilowatts/cm2 using TIR configuration. An acousto-optic modulator (Isomet, 1205C) was used to achieve exact timing of the laser illumination till and the bleaching pulse tbleach. After filtering (custom-made dichroic and emission filters, Chroma), images were recorded on a back-illuminated liquid nitrogen-cooled CCD camera (Micro Max 1300-PB, Roper Scientific). Each CCD pixel corresponds to 200 nm × 200 nm in the sample plane.
For TOCCSL experiments, we recorded stripes of 11 images: the first represents the pre-bleach image, and 2–11, the post-bleach images used for single-molecule tracking; the second image contains the bleaching pulse and was not used for further analysis. The timing protocol is shown in Fig. 1A. The illumination time till was set to 0.8 ms for the pre- and post-bleach images, the delay between the illumination pulses tdelay was 0.7 ms; the bleaching time tbleach was kept constant at 500 ms, and the recovery time trec was varied between 1, 40, and 75 ms.
FIGURE 1.

Photobleaching and single-molecule tracking assay. A shows the timing protocol, B and C show original data. From left to right, pre-bleach image: first post-bleach image after a recovery time trec = 75 ms, second post-bleach image after an additional time lag of 1.5 ms. Dashed lines indicate the cell border, full lines circumscribe the analysis area for single-molecule tracking. B shows the recovery of Lck-YFP in living Jurkat T cells, C, the negative control on fixed cells (experimental condition identical to B). Whereas on living cells single-molecule signals are clearly observable in the post-bleach images, we found no signals on fixed cells, indicating that photoblinking does not affect the data analysis.
All live cell experiments were performed in Hank‘s balanced salt solution (HBSS; PAA) at 37 °C. For fixation, cells were incubated before the measurement for 10 min in HBSS containing 4% paraformaldehyde (Sigma) and then washed twice with HBSS. For degradation of microtubules, cells were incubated for 1 h with HBSS containing 67 μm nocodazole (Sigma-Aldrich) and then washed twice with HBSS. To test whether the degradation was successful, we analyzed intracellular vesicle trafficking before and after addition of nocodazole. Intracellular vesicles were stained by incubating the cells for 1 h with 5 μg/ml FM4–64 (Invitrogen) before nocodazole treatment.
Data Analysis
Images were analyzed using in-house algorithms implemented in MATLAB (Math-Works). Individual diffraction limited signals were selected and fitted with a Gaussian intensity profile, yielding the single-molecule position r̄(t) with a localization error σxy. Single-molecule trajectories were reconstructed according to previous studies (5), and the mean square displacement MSD(tlag) = <(δr̄(tlag))2 ; δr̄(tlag) = r̄(t + tlag) − r̄(t) was calculated as a function of the time lag tlag = till + tdelay. The diffusion constant of a single molecule was estimated in Equation 1,
with i as a natural number smaller than the length of the trajectory. We discriminated membrane inserted from cytosolic Lck via the difference in the single-molecule diffusion constants, based on a threshold criterion. This criterion contains cross-talk from cytosolic Lck erroneously assigned to membrane-anchored molecules (a) and vice versa (b). Molecules with mobilities lower (denoted L) or higher (H) than Dthresh follow, therefore, in Equations 2 and 3,
with ncyt and nins specifying the corrected numbers of molecules for the cytosolic and membrane-inserted fraction. a and b were determined as outlined under “Results.”
To determine the number of membrane-bound Lck-YFP in the pre-bleach image, the single molecule fluorescence signal of YFP had to be estimated. Therefore, the brightness of all detected Lck-YFP molecules in the 11th image of each stripe was determined according to Schmidt et al. (33). The peak of the distribution was ascribed to the single molecule YFP signal.
Modeling
In Fig. 7, we present our model for the association and dissociation pathways of Lck to and from the plasma membrane. We assumed mono-myristoylated Lck to be soluble. Addition of one or two palmitic acids by a palmitoyl acyltransferase (PAT) yields stable association with the plasma membrane; kPAT,1 and kPAT denote the rate constants for addition of the first and second palmitic acid, respectively. The rate constants for removal of the first and second palmitic acid (kThio) were assumed to be equal. We can calculate the lifetime of Lck in the plasma membrane by solving the differential Equation 4,
 |
with Equation 5.
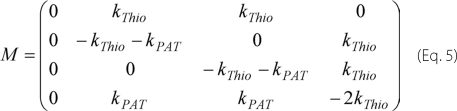 |
Here, ni denote the different acylation states of Lck as specified in Fig. 7. We assumed absorbing boundary conditions for the state n1 by setting all elements in the first column to zero (i.e. kPAT,1 = 0); this ensures that mono-myristoylated Lck leaves the membrane before re-palmitoylation. The differential equation was solved for n3(0)=1, i.e. we assigned the double acylated form of Lck as the most probable state; the assumption is valid for kThio << kPAT. In this approximation, we obtained the solution in Equation 6,
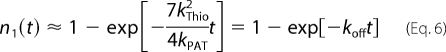 |
with koff denoting the dissociation rate constant of Lck from the plasma membrane.
FIGURE 7.

Model for the association and dissociation kinetics of Lck with the plasma membrane. Filled circles denote the first N-terminal amino acids; myristoylation on glycine 2, and palmitoylation on cysteines 3 and 5 are indicated by zig-zag lines. n1 indicates the mono-myristoylated state, n2 and n2′ the single palmitoylated state, n3 the double palmitoylated state. kThio specifies the rate constant for removal of a single palmitic acid by a thioesterase, kPAT,1 and kPAT the rate constants for addition of the first and second palmitic acid by a palmitoyl acyltransferase, respectively.
RESULTS
Direct Observation of Single Cytosolic Lck-YFP Molecules
A Lck-YFP fusion construct was stably expressed in the Lck-deficient Jurkat T cell line J.CaM1.6. In a recent report we have demonstrated the functionality of the construct in T cell signaling (29). Using TIR excitation, we observed homogenous staining in the bottom membrane (Fig. 1B). To study Lck-YFP mobility at the single-molecule level we totally photobleached the bottom membrane with a short intense laser pulse (bleaching time 500 ms). Immediately after the bleach pulse, we monitored the first non-bleached Lck-YFP molecules entering the bottom membrane. Interestingly, these molecules were randomly dispersed over the whole cell area and not preferentially localized at the cell border as it would be expected for two-dimensional diffusion of membrane-anchored Lck-YFP. We suspected that cytosolic Lck-YFP may enter from the top and transiently stay within the evanescent field. An alternative explanation would be that the fluorescent protein was not fully photobleached but remains in a transient dark state (21), from which it recovers stochastically. To check for such “blinking recovery,” we fixed the cells and performed the same type of experiment. In this case, no single molecule signals were observed after the photobleaching pulse (Fig. 1C). Moreover, experiments were repeated with Lck-mGFP, showing also the recovery of single molecule signals (Fig. 5A); on the contrary, using a glycosylphosphatidylinositol-anchored mGFP (mGFP-GPI) recovery proceeded exclusively from the borders of the photobleached region (data not shown). The observation of a substantial cytosolic Lck population agrees with data obtained by subcellular fractionation (Fig. 2).
FIGURE 5.

Quantification of Lck-YFP insertion into the plasma membrane. A, the number of inserted molecules divided by the total number of recovered cytosolic molecules is plotted for each recovery time. (○) shows the data for Lck-YFP, (▽) for Lck-mGFP, and (□) for Lck-ΔN10-mGFP. For Lck-YFP, the insertion is increasing linearly with recovery time. A different fluorophore (mGFP) fused to Lck does not change the insertion behavior. Lck-ΔN10-mGFP, which lacks the membrane anchor, does not insert into the membrane. B shows the average number of inserted molecules per cell divided by the number of membrane-bound Lck molecules estimated from the pre-bleach image. A linear increase is found with increasing recovery time. The inverse of the slope specifies the residence time of Lck-YFP in the plasma membrane of Jurkat T cells according to Equation 8, yielding τoff ∼ 50 s.
FIGURE 2.
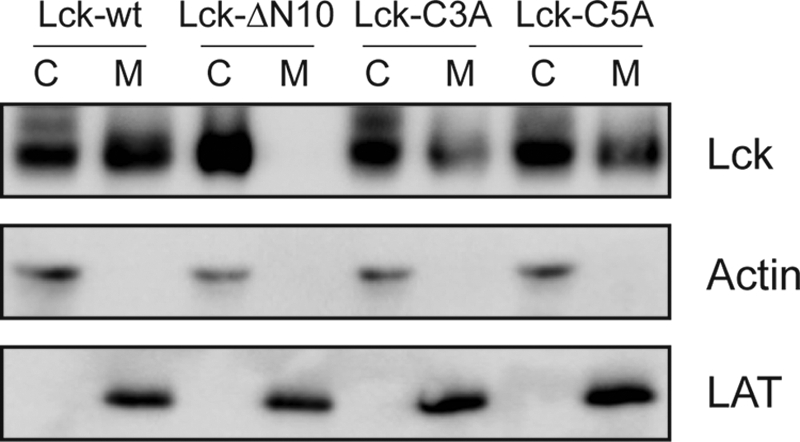
A fraction of Lck resides in the cytoplasm. Cytoplasmic (C) and membrane (M) fractions of JCaM1.6 T cells transduced with the indicated Lck constructs were analyzed by SDS-PAGE. The subcellular fractionation showed the following cytoplasmic/membrane distribution: Lck-wt (C: 47%, M: 53%); Lck-ΔN10 (C: 98–2%); Lck-C3A (C:65%, M: 35%) and Lck-C5A (C: 60%, M: 40%). LAT and actin served as quality control for membrane and cytosolic fractions, respectively.
Discrimination between Cytosolic and Membrane-bound Lck by Mobility Analysis
To characterize more closely the observed recovery process, we analyzed the diffusion constant of each recovered single molecule, D. The steady-state mobility of Lck-YFP in its membrane bound state was determined without photobleaching by analyzing cells with an extremely low expression level (Fig. 3A); in this case, single Lck-YFP molecules could be well resolved as diffraction-limited spots and could be tracked at a time delay of 10 ms without overlapping trajectories. We found a mean diffusion constant of <D> ∼0.26 μm2/s, slightly lower than previous reports on Lck-GFP mobility in Jurkat T cells (11, 34). Next, we analyzed the first Lck-YFP molecules reentering the photobleached spot from the top. Fig. 3, B–D show histograms of the single molecule mobility for various recovery times ranging from 1 ms up to 75 ms. To minimize contributions of recovering membrane-anchored Lck-YFP, we disregarded in this analysis all molecules close to the cell border (within a margin of 1 μm; the probability for a membrane-anchored molecule to cross this margin is ∼10−7). As expected, we found dramatically increased mobility with values around <D> ∼9.5 μm2/s, reflecting the motion of unbound cytosolic Lck diffusing through the evanescent field. For comparison, we also analyzed the mobility of the cytosolic Lck-variant Lck-ΔN10-mGFP, which lacks the first 10 N-terminal amino acids that contain the acylation sites for membrane anchorage, yielding similar results (<D> ∼10.6 μm2/s, Fig. 4).
FIGURE 3.

Statistical analysis of Lck-YFP trajectories. The top row shows a schematic representation of cytosolic (white trajectories) and membrane-bound Lck (black trajectories), the bottom row histograms for the distribution of the single molecule diffusion constants D; to facilitate readability, the logarithm of D is shown. Data with mobilities smaller than 10−3μm2/s were pooled. In the pre-bleach image (A), the predominant fraction of Lck-YFP is membrane-bound with an average diffusion constant D ∼ 0.26 μm2/s. B–D show post-bleach mobility distributions after a recovery time of 1 ms (B), 40 ms (C), and 75 ms (D). The peaks of the distributions are now located at much higher values, close to the diffusion constant of a cytosolic Lck variant (compare Fig. 4). We indicated the threshold for discrimination between membrane-bound and cytosolic molecules by a gray vertical line. With increasing recovery time, the percentage of inserted molecules increased.
FIGURE 4.

Discrimination between diffusion of membrane-bound versus cytosolic Lck. Histograms of the single molecule diffusion constants are shown for Lck-YFP (white bars) and Lck-ΔN10-mGFP (gray bars). To restrict the analysis to membrane-bound Lck-YFP, we recorded single-molecule trajectories in low-expressing Jurkat T cells at an increased time lag of 10 ms; at these settings, highly mobile cytosolic Lck could not be tracked. The mobility of cytosolic Lck was determined by measuring a truncated form of Lck (Lck-ΔN10-mGFP), which is missing the membrane anchor and is therefore located in the cytosol. A threshold value of D = 1 μm2/s was set between the two histograms, which minimizes the cross-talk values a and b.
Because it takes only δ2/4D ∼0.5 ms for cytosolic Lck-YFP to traverse the evanescent field of δ ∼100 nm, we expected the cytosolic fraction to be already close to equilibrium at a recovery time of 1 ms. Indeed, when counting the number of cytosolic Lck-YFP molecules in the evanescent field per cell, we found an equilibrium value of 3.9 molecules and 3.8 molecules at trec = 40 ms and trec = 75 ms, respectively, which is already reached to ∼60% within 1 ms (2.4 molecules).
Closer inspection of Fig. 3, B–D, however, revealed an interesting change in the distributions: whereas there was hardly any difference of cytosolic full-length Lck-YFP to Lck-ΔN10-mGFP at a recovery time trec = 1 ms, we found an increase in the shoulder of the histograms toward low diffusion constants with increasing recovery time. Apparently, an increasing fraction of cytosolic Lck-YFP reduced its mobility toward the level of the membrane-anchored variant, indicating that soluble Lck becomes membrane-anchored during the recovery process.
Kinetics of Lck-YFP Plasma Membrane Insertion
Because the full-length and membrane anchor-deleted variants of Lck displayed different mobility (Fig. 4), we were able to distinguish cytosolic from membrane-bound Lck. We set the arbitrary mobility threshold Dthresh = 1 μm2/s: molecules above this threshold were assigned to the cytosolic pool, molecules below to the membrane pool. We further used this experiment to determine the cross-talk of the analysis, i.e. the fraction of cytosolic molecules erroneously assigned to the membrane-anchored pool (a = p(DLck-ΔN10 < Dthresh) = 0.081), and the fraction of membrane-anchored molecules erroneously assigned to the cytosolic pool (b = p(DLck > Dthresh) = 0.064); all data presented in the following were cross-talk corrected.
Fig. 5A shows the amount of cytosolic Lck-YFP molecules that have inserted into the membrane during the recovery process, nins, normalized by the total number of recovered cytosolic Lck-YFP, ncyt. ncyt is proportional to the concentration of cytosolic Lck-YFP, ρcyt, therefore nins/ncyt ∝ kontrec. Consistently, we observed a linear increase of nins/ncyt with recovery time. The effect was similar for mGFP- and YFP-tagged Lck, indicating that spectroscopic properties of the two fluorescent proteins had no effect on the results. The observed non-zero offset can be attributed to insertion of Lck molecules at the end of the bleaching pulse, which have remained unbleached by chance. The slope can be interpreted as the rate constant for Lck molecules located within the detection area (essentially the evanescent field of ∼100 nm) to associate with the plasma membrane; we estimated an association rate constant of ∼2.6 s−1. Its reciprocal value of ∼400 ms can be interpreted as the time a membrane proximal Lck molecule needs to associate with the plasma membrane, when neglecting exchange with the cytosolic population outside the evanescent field. As a negative control, we also analyzed the cytosolic variant Lck-ΔN10-mGFP; for this molecule, no increase in the slow mobility fraction was observed (squares in Fig. 5A).
Finally, we asked whether the observed insertion was mediated by a non-vesicular pool of Lck-YFP. For this, we disrupted vesicular transport by incubation with nocodazole (supplemental Movies S1 and S2, blockage of transport was verified by staining cytosolic vesicles with FM4-64). Also under those conditions, we observed single Lck-YFP molecules recovering from the top in the post-bleach image, yielding no observable difference to data obtained without nocodazole treatment.
Estimation of Lck-YFP Lifetime in the Plasma Membrane
To quantify the Lck exchange at the plasma membrane in more detail, we considered the process to be at steady state. This assumption is justified, because no significant variations in the surface density of membrane-bound Lck were observable over time (not shown). Under steady state conditions, the membrane and cytosolic pools are related by Equation 7,
with koff the off-rate of Lck molecules from the plasma membrane, and nmem the number of membrane-anchored Lck within the detection area (i.e. the central portion of the bottom plasma membrane outside the 1 μm margin close to the border). Because konρcyt equals nins/trec, it is accessible in our experiment; insertion in Equation 7 yields Equation 8.
Plotting nins/nmem versus trec, therefore, allows estimating the Lck off-rate from the plasma membrane, given the additional information on nmem. We determined the number of membrane-bound Lck-YFP on each cell by dividing the signal in the pre-bleach image by the average brightness of single YFP molecules. Fig. 5B shows, indeed, a linear increase of nins/nmem with trec; from the slope, a lifetime τ = 1/koff ∼50 s was obtained.
Palmitoylation on cysteines 3 and 5 are known to be critical for Lck targeting to the plasma membrane (25); single palmitoylation at either position 3 or 5 leads to reduced plasma membrane association and induction of late signaling proteins (25). Intuitively, one may expect the additional acyl chain to stabilize membrane association, without affecting the kinetic on-rate. Because our method allows discriminating on- and off-rate contributions, we could test this prediction by further studying the two mutants Lck-C3A-mGFP and Lck-C5A-mGFP, which are deficient in palmitoylation at cysteines 3 or 5, respectively (Fig. 6). Within the error bars, we found no difference between the two mutants, both with respect to the association (Fig. 6A) and dissociation kinetics (Fig. 6B). For the association rate constant we determined ∼2.9 s−1 (C3A) and ∼2.6 s−1 (C5A), similar to the wild-type molecules. In contrast, the off-rate was dramatically increased for both molecules compared with wild-type Lck, yielding a lifetime of only ∼7 s (C3A) and ∼9 s (C5A).
FIGURE 6.

Characterization of the effect of palmitoylation on Lck-insertion into the plasma membrane. We compared the point mutations C3A (□) and C5A (○), which are deficient in palmitoylation on cysteine 3 or 5, respectively. A, the number of inserted molecules divided by the total number of recovered cytosolic molecules is plotted for each recovery time. Both data sets increase linearly with recovery time, quantitatively similar to the wild-type construct shown in Fig. 5A. B shows the average number of inserted molecules per cell divided by the number of membrane-bound molecules. Residence times were obtained from the linear fit, yielding τoff ∼ 7 s for Lck-C3A-mGFP and τoff ∼ 9 s for Lck-C5A-mGFP.
DISCUSSION
In this report, we applied single molecule fluorescence microscopy in combination with FRAP to study the exchange kinetics between cytosolic and membrane-bound Lck. A substantial population of cytosolic non-vesicular Lck-YFP was found in the immediate vicinity of the plasma membrane; from this population, we frequently observed individual molecules to associate with or incorporate into the membrane, as evidenced by mobility analysis.
The observation of cytosolic Lck is not new (27–30) and has been frequently ascribed to the presence of transport carriers for delivery to the plasma membrane (26, 30). Indeed, using standard epi-fluorescence microscopy, we also observed Lck-YFP-positive vesicular structures, with occasional periods of directed transport (data not shown). However, when switching to TIR illumination, we could efficiently restrict the analysis to non-vesicular Lck, as evidenced by the following observations. First, we hardly found directed transport of Lck-YFP-positive structures. Second, when blocking directed transport by degrading microtubules, we still observed Lck-YFP molecules entering the evanescent field after photobleaching. The measured diffusion constant of the cytosolic Lck population of D ∼10 μm2/s compares well with a purely cytosolic variant Lck-ΔN10-mGFP, and with data reported in the literature e.g. for the three-dimensional diffusion of a cytosolic pool of farnesylated EGFP (D∼11 μm2/s (35)); diffusing vesicular structures would be orders of magnitude slower (36). Together, our data indicate a substantial fraction of soluble non-vesicular Lck-YFP in Jurkat T cells.
We estimated the time constant for association of membrane-proximal Lck with the plasma membrane to be ∼400 ms. This association rate, as defined in our study, is independent of the protein expression levels, making it a valid parameter for comparison between the different Lck mutants. This association time appears extremely long compared with a time of ∼0.5 ms a cytosolic molecule needs to traverse the evanescent field (∼100 nm (37)). Thus, it takes about 1000 encounters for the molecule in order to be attached to the membrane. Once attached, molecules remain on average for ∼50 s in the plasma membrane. With D = 0.26 μm2/s, this time is sufficient for a given Lck molecule to reach the opposite side of the T cell via Brownian motion (x = 2√Dt ∼ 7 μm) before dissociation. Lck is therefore capable of transmitting signals over the whole T cell membrane, a property that is different for example for pleckstrin homology domains: their binding to inositol lipids shows a much lower lifetime of ∼2.5 s, making those interactions suitable for the formation of local concentration gradients (19).
How can membrane association of Lck be regulated? Lck is acylated via N-terminal palmitoylation of two cysteines at position 3 and 5 and myristoylation at glycine 2. Kabouridis et al. (25) showed that double palmitoylation is required for full membrane targeting: while a non-palmitoylated mutant was not detectable at the membrane, mono-palmitoylated mutants yielded a decreased membrane association compared with the wild-type. Therefore, reversible palmitoylation mediated by the interplay of membrane-associated palmitoyl transferases and thioesterases (16, 38–40) is most likely responsible for the observed exchange of the two pools.
In Fig. 7 we show a working model for the interpretation of our data. The model discriminates between the partitioning of mono-acylated proteins and proteins modified with two or more acyl chains: a single myristic acid modification leads to a soluble molecule (41) whereas additional palmitoylation at a single site, irrespective of whether at C3 or C5, yields a quasi infinite lifetime of the protein at the plasma membrane (42). In our study, we measured the same kinetic on-rates for all constructs (Lck-YFP, Lck-C3A-mGFP, Lck-C5A-mGFP). Noting the high numbers of encounters required before stable membrane association, we ascribe the observed rate-limiting step to the palmitoylation of cytosolic, single-myristoylated Lck. The characteristic time for action of palmitoyl transferases to transfer the first palmitic acid can be thus estimated by 400 ms. To point out that palmitoylation of the soluble versus the membrane-anchored protein may proceed with different kinetics, we discriminated the rate constants kPAT,1 and kPAT.
For the point mutants C3A and C5A, membrane association is terminated by the liberation of the mono-palmitate; we can therefore estimate the characteristic time constant for the action of the involved palmitoyl thioesterases by 1/kThio ∼7–9 s. For the wild-type construct Lck-YFP, mono-palmitoylation may be followed either by palmitoylation at the remaining free cysteine or by liberation of the attached palmitic acid. Note that according to the ∼6-fold difference in the rate constants of the mutants versus wild-type Lck, the likelihood for attachment of the second palmitic acid is much higher than for the removal of the mono-palmitate by thioesterases. The most probable state will thus be a double palmitoylated molecule. In consequence, wild-type Lck shows a much higher stability in the plasma membrane. We solved the model analytically (Equation 6). From the experimentally determined parameters for kThio (8 s)and koff (50 s), we estimated the average time constant for addition of the second palmitic acid, 1/kPAT ∼700 ms. This value is only slightly higher than the on-rate of Lck to the membrane; the difference may be due to the slower diffusion of the membrane-anchored protein compared with the cytosolic form, which thus will require a longer time until collision with a palmitoyl transferase.
Up to now, there is rather limited knowledge on the kinetics of protein palmitoylation or depalmitoylation, because of the limited time resolution of pulse-chase experiments. For Lck, Paige et al. (43) reported a turnover of palmitate within 60 min. For a G-protein α-subunit, palmitate turnover with a half-life shorter than 2 min was estimated (44). We show here that the kinetics can actually be much faster and that triple acylation represents another means to fine-tune the lifetime of the protein at the plasma membrane.
15 years ago, palmitoylation-depalmitoylation cycles were speculated to be responsible for the subcellular localization of intracellular proteins in general (42), which was recently confirmed experimentally for the Ras protein (45, 46). Exchange of Ras proteins between the plasma membrane and intracellular organelles enables the differential activity responses of Ras isoforms. An analogous mechanism appears to control Lck: within milliseconds, Lck can be anchored in the plasma membrane for modification of its own activity or that of substrates and can be released with similar speed to shut down this process or transport activated/modified Lck to other reaction centers in the cell. Therefore, we speculate that this high-speed shuttle of Lck between the cytosol and the plasma membrane may provide a primary way to regulate the enzyme, in addition to (de)phosphorylation of the known activation motifs.
Supplementary Material
Acknowledgments
We thank J. Lippincott-Schwartz (National Institutes of Health, Bethesda, MD) for providing pJB20 GFP-GPI and Verena Ruprecht for assistance in Mathematica.
This work was supported by the Austrian Science Fund (FWF Project Y250-B10), the GEN-AU Project of the Austrian Federal Ministry for Science and Research, and the European Union Project LipidomicNet (Grant 202272).

The on-line version of this article (available at http://www.jbc.org) contains supplemental Movies S1 and S2.
- GPI
- glycosylphosphatidylinositol
- FRAP
- fluorescence recovery after photobleaching
- D
- diffusion constant
- MSD
- mean square displacement
- YFP
- yellow fluorescent protein
- TIR
- total internal reflection
- GFP
- green fluorescent protein
- PAT
- palmitoyl acyltransferase
- TOCCSL
- thinning out clusters while conserving the stoichiometry of labeling.
REFERENCES
- 1.Wieser S., Schutz G. J., Cooper M. E., Stockinger H. (2007) Applied Physics Letters 91, 233901 [Google Scholar]
- 2.Wieser S., Axmann M., Schütz G. J. (2008) Biophys. J. 95, 5988–6001 [DOI] [PMC free article] [PubMed] [Google Scholar]
- 3.Wieser S., Moertelmaier M., Fuertbauer E., Stockinger H., Schütz G. J. (2007) Biophys. J. 92, 3719–3728 [DOI] [PMC free article] [PubMed] [Google Scholar]
- 4.Vrljic M., Nishimura S. Y., Brasselet S., Moerner W. E., McConnell H. M. (2002) Biophys. J. 83, 2681–2692 [DOI] [PMC free article] [PubMed] [Google Scholar]
- 5.Schütz G. J., Kada G., Pastushenko V. P., Schindler H. (2000) EMBO J. 19, 892–901 [DOI] [PMC free article] [PubMed] [Google Scholar]
- 6.Ritchie K., Shan X. Y., Kondo J., Iwasawa K., Fujiwara T., Kusumi A. (2005) Biophys. J. 88, 2266–2277 [DOI] [PMC free article] [PubMed] [Google Scholar]
- 7.Murase K., Fujiwara T., Umemura Y., Suzuki K., Iino R., Yamashita H., Saito M., Murakoshi H., Ritchie K., Kusumi A. (2004) Biophys. J. 86, 4075–4093 [DOI] [PMC free article] [PubMed] [Google Scholar]
- 8.Segura J. M., Guillaume P., Mark S., Dojcinovic D., Johannsen A., Bosshard G., Angelov G., Legler D. F., Vogel H., Luescher I. F. (2008) J. Biol. Chem. 283, 24254–24263 [DOI] [PMC free article] [PubMed] [Google Scholar]
- 9.Jacquier V., Prummer M., Segura J. M., Pick H., Vogel H. (2006) Proc. Natl. Acad. Sci. U.S.A. 103, 14325–14330 [DOI] [PMC free article] [PubMed] [Google Scholar]
- 10.Lommerse P. H., Vastenhoud K., Pirinen N. J., Magee A. I., Spaink H. P., Schmidt T. (2006) Biophys. J. 91, 1090–1097 [DOI] [PMC free article] [PubMed] [Google Scholar]
- 11.Douglass A. D., Vale R. D. (2005) Cell 121, 937–950 [DOI] [PMC free article] [PubMed] [Google Scholar]
- 12.Rhode S., Grurl R., Brameshuber M., Hermetter A., Schutz G. J. (2008) J. Biol. Chem. 284, 2258–2265 [DOI] [PubMed] [Google Scholar]
- 13.Lenne P. F., Wawrezinieck L., Conchonaud F., Wurtz O., Boned A., Guo X. J., Rigneault H., He H. T., Marguet D. (2006) EMBO J. 25, 3245–3256 [DOI] [PMC free article] [PubMed] [Google Scholar]
- 14.Andrews N. L., Lidke K. A., Pfeiffer J. R., Burns A. R., Wilson B. S., Oliver J. M., Lidke D. S. (2008) Nat. Cell Biol. 10, 955–963 [DOI] [PMC free article] [PubMed] [Google Scholar]
- 15.Espenel C., Margeat E., Dosset P., Arduise C., Le Grimellec C., Royer C. A., Boucheix C., Rubinstein E., Milhiet P. E. (2008) J. Cell Biol. 182, 765–776 [DOI] [PMC free article] [PubMed] [Google Scholar]
- 16.Bijlmakers M. J., Marsh M. (2003) Trends Cell Biol. 13, 32–42 [DOI] [PubMed] [Google Scholar]
- 17.Roth A. F., Feng Y., Chen L., Davis N. G. (2002) J. Cell Biol. 159, 23–28 [DOI] [PMC free article] [PubMed] [Google Scholar]
- 18.Henis Y. I., Rotblat B., Kloog Y. (2006) Methods 40, 183–190 [DOI] [PubMed] [Google Scholar]
- 19.Hammond G. R., Sim Y., Lagnado L., Irvine R. F. (2009) J. Cell Biol. 184, 297–308 [DOI] [PMC free article] [PubMed] [Google Scholar]
- 20.Mashanov G. I., Tacon D., Peckham M., Molloy J. E. (2004) J. Biol. Chem. 279, 15274–15280 [DOI] [PubMed] [Google Scholar]
- 21.Dickson R. M., Cubitt A. B., Tsien R. Y., Moerner W. E. (1997) Nature 388, 355–358 [DOI] [PubMed] [Google Scholar]
- 22.Knight J. D., Falke J. J. (2009) Biophys. J. 96, 566–582 [DOI] [PMC free article] [PubMed] [Google Scholar]
- 23.Moertelmaier M., Brameshuber M., Linimeier M., Schütz G. J., Stockinger H. (2005) Appl. Phys. Lett 87, 263903 [Google Scholar]
- 24.Davis M. M., Krogsgaard M., Huse M., Huppa J., Lillemeier B. F., Li Q. J. (2007) Annu. Rev. Immunol. 25, 681–695 [DOI] [PubMed] [Google Scholar]
- 25.Kabouridis P. S., Magee A. I., Ley S. C. (1997) EMBO J. 16, 4983–4998 [DOI] [PMC free article] [PubMed] [Google Scholar]
- 26.Bijlmakers M. J., Marsh M. (1999) J. Cell Biol. 145, 457–468 [DOI] [PMC free article] [PubMed] [Google Scholar]
- 27.Tuosto L., Parolini I., Schröder S., Sargiacomo M., Lanzavecchia A., Viola A. (2001) Eur. J. Immunol. 31, 345–349 [DOI] [PubMed] [Google Scholar]
- 28.Haughn L., Leung B., Boise L., Veillette A., Thompson C., Julius M. (1998) J. Exp. Med. 188, 1575–1586 [DOI] [PMC free article] [PubMed] [Google Scholar]
- 29.Paster W., Paar C., Eckerstorfer P., Jakober A., Drbal K., Schütz G. J., Sonnleitner A., Stockinger H. (2009) J. Immunol. 182, 2160–2167 [DOI] [PubMed] [Google Scholar]
- 30.Antón O., Batista A., Millán J., Andrés-Delgado L., Puertollano R., Correas I., Alonso M. A. (2008) J. Exp. Med. 205, 3201–3213 [DOI] [PMC free article] [PubMed] [Google Scholar]
- 31.Schwarzenbacher M., Kaltenbrunner M., Brameshuber M., Hesch C., Paster W., Weghuber J., Heise B., Sonnleitner A., Stockinger H., Schütz G. J. (2008) Nat. Methods 5, 1053–1060 [DOI] [PubMed] [Google Scholar]
- 32.Zacharias D. A., Violin J. D., Newton A. C., Tsien R. Y. (2002) Science 296, 913–916 [DOI] [PubMed] [Google Scholar]
- 33.Schmidt T., Schütz G. J., Gruber H. J., Schindler H. (1996) Anal. Chem. 68, 4397–4401 [DOI] [PubMed] [Google Scholar]
- 34.Ike H., Kosugi A., Kato A., Iino R., Hirano H., Fujiwara T., Ritchie K., Kusumi A. (2003) Chemphyschem. 4, 620–626 [DOI] [PubMed] [Google Scholar]
- 35.Ohsugi Y., Saito K., Tamura M., Kinjo M. (2006) Biophys. J. 91, 3456–3464 [DOI] [PMC free article] [PubMed] [Google Scholar]
- 36.Schütz G. J., Axmann M., Freudenthaler S., Schindler H., Kandror K., Roder J. C., Jeromin A. (2004) Microsc. Res. Tech. 63, 159–167 [DOI] [PubMed] [Google Scholar]
- 37.Mattheyses A. L., Axelrod D. (2006) J. Biomed. Opt. 11, 014006 [DOI] [PubMed] [Google Scholar]
- 38.Duncan J. A., Gilman A. G. (1998) J. Biol. Chem. 273, 15830–15837 [DOI] [PubMed] [Google Scholar]
- 39.Yeh D. C., Duncan J. A., Yamashita S., Michel T. (1999) J. Biol. Chem. 274, 33148–33154 [DOI] [PubMed] [Google Scholar]
- 40.Linder M. E., Deschenes R. J. (2007) Nat. Rev. Mol. Cell Biol. 8, 74–84 [DOI] [PubMed] [Google Scholar]
- 41.Peitzsch R. M., McLaughlin S. (1993) Biochemistry 32, 10436–10443 [DOI] [PubMed] [Google Scholar]
- 42.Shahinian S., Silvius J. R. (1995) Biochemistry 34, 3813–3822 [DOI] [PubMed] [Google Scholar]
- 43.Paige L. A., Nadler M. J., Harrison M. L., Cassady J. M., Geahlen R. L. (1993) J. Biol. Chem. 268, 8669–8674 [PubMed] [Google Scholar]
- 44.Wedegaertner P. B., Bourne H. R. (1994) Cell 77, 1063–1070 [DOI] [PubMed] [Google Scholar]
- 45.Rocks O., Peyker A., Kahms M., Verveer P. J., Koerner C., Lumbierres M., Kuhlmann J., Waldmann H., Wittinghofer A., Bastiaens P. I. (2005) Science 307, 1746–1752 [DOI] [PubMed] [Google Scholar]
- 46.Goodwin J. S., Drake K. R., Rogers C., Wright L., Lippincott-Schwartz J., Philips M. R., Kenworthy A. K. (2005) J. Cell Biol. 170, 261–272 [DOI] [PMC free article] [PubMed] [Google Scholar]
Associated Data
This section collects any data citations, data availability statements, or supplementary materials included in this article.