

Abstract
Bleomycin is used in combination with other antineoplastic agents to effectively treat lymphomas, testicular carcinomas, and squamous cell carcinomas of the cervix, head, and neck. However, resistance to bleomycin remains a persistent limitation in exploiting the full therapeutic benefit of the drug with other types of cancers. Previously, we documented that the Saccharomyces cerevisiae l-carnitine transporter Agp2 is responsible for the high affinity uptake of polyamines and of the polyamine analogue bleomycin-A5. Herein, we document that the human l-carnitine transporter hCT2 encoded by the SLC22A16 gene is involved in bleomycin-A5 uptake, as well as polyamines. We show that NT2/D1 human testicular cancer cells, which highly express hCT2, are extremely sensitive to bleomycin-A5, whereas HCT116 human colon carcinoma cells devoid of detectable hCT2 expression or MCF-7 human breast cancer cells that only weakly express the permease showed striking resistance to the drug. NT2/D1 cells accumulated fluorescein-labeled bleomycin-A5 to substantially higher levels than HCT116 cells. Moreover, l-carnitine protected NT2/D1 cells from the lethal effects of bleomycin-A5 by preventing its influx, and siRNA targeted to hCT2 induced resistance to bleomycin-A5-dependent genotoxicity. Furthermore, hCT2 overexpression induced by transient transfection of a functional hCT2-GFP fusion protein sensitized HCT116 cells to bleomycin-A5. Collectively, our data strongly suggest that hCT2 can mediate bleomycin-A5 and polyamine uptake, and that the rate of bleomycin-A5 accumulation may account for the differential response to the drug in patients.
Keywords: Anticancer Drug; Cancer Therapy; Drug Resistance; Drug Transport; Metabolic Tracers; Bleomycin, Polyamines; High Affinity Transport; Non-Hodgkin's Lymphoma; Polyamine Analogues; Testicular Cancer Cells
Introduction
Bleomycin (BLM)3 is a hydrophilic glycopeptide antibiotic produced by Streptomyces verticillus (1–3). This organism produces various species of BLM such as BLM-A1 to -A6 and BLM-B1 to -B6 that differ from each other in the DNA binding moiety (2). All BLM species are known to induce damage to DNA by creating a limited set of lesions similar to those induced by ionizing radiation, such as double- and single-strand breaks, and apurinic/apyrimidinic sites, thus accounting for the genotoxic effects of the drug (4–10). Blenoxane, a mixture consisting primarily of BLM-A2, BLM-B2, and minor amounts of other species such as BLM-A5, is used for treating various neoplasias including testicular cancer, lymphoma, Hodgkin's disease, squamous cell carcinoma of the cervix, and head and neck cancers (3, 11–13). Of these diseases, BLM yields a strikingly high cure rate specifically against testicular cancer when used in combination with cisplatin and etoposide, although a fraction (∼15–20%) of these patients are found to be resistant to this therapy (13, 14). It is noteworthy that BLM is ineffective against other types of cancers including Daudi lymphoma and colon carcinomas at the outset (15, 16). However, the underlying mechanism that causes these cancers to be unresponsive to BLM therapy is not known. Lack of tumor response to BLM could be caused by (i) enhanced repair of BLM-induced DNA lesions, (ii) increased drug detoxification, and/or (iii) reduced cellular uptake of the drug (reviewed in Ref. 17). Overproduction of the DNA repair enzyme hApe1/ref-1 in the NT2/D1 testicular cancer cells resulted in a ∼3-fold increased protection against BLM, although it remains to be shown whether hApe1 overexpression can account for the nearly 15% of patients that resist BLM therapy (18). In addition, data regarding the enzyme bleomycin hydrolase, which can hydrolyze BLM to confer drug resistance, remain controversial (17). Previous studies suggest that the plasma membrane acts as a barrier to limit drug entry into cells (17, 19). This is supported by the observation that electroporation can increase the level of BLM into mammalian cells thereby enhancing the genotoxicity of the drug (20–22). In fact, subsequent work demonstrated that a receptor exists on the surface of both yeast and mammalian cells that can bind to an inactive complex containing BLM-A2 with labeled cobalt, although no further studies were performed to characterize this putative receptor (23). Taken together, these findings raise the possibility that an active BLM uptake system exists in eukaryotic cells.
In a genome-wide screen performed with the yeast Saccharomyces cerevisiae haploid mutant collection, we recently identified the AGP2 gene, previously reported as encoding a l-carnitine permease (24), as directing the uptake of BLM-A5 in yeast (25, 26). Yeast lacking Agp2 was unable to take up BLM-A5 and showed extreme resistance to the drug (25), and Agp2 overexpression greatly sensitized cells to BLM-A5, which correlated with enhanced damage to DNA (25). In addition, Agp2 transports only one species of BLM, namely BLM-A5, which contains a spermidine moiety (27). This observation led to the remarkable discovery that Agp2 expression is responsible for high affinity polyamine transport (27). In short, our genome-wide screen has established for the first time that altered transport is a critical mechanism leading to BLM resistance in yeast. This therefore raised the possibility that mammalian cells might use related genes to regulate BLM influx.
Agp2 shares functional similarity with the human high affinity l-carnitine transporter hCT2 (SLC22A16 in the HUGO nomenclature), suggesting that hCT2 might also transport BLM in mammalian cells (24, 28, 29). In fact, hCT2 is robustly expressed in the testis and bone marrow (29), and is widely expressed at much weaker levels in most other adult cell types. However, there are some discrepancies regarding the tissue-wide distribution of hCT2, as pointed out by Eraly and Nigam (30) who reported the presence of two isoforms of the transcript, including a much larger one that is abundantly expressed in skeletal muscle. Interestingly, tumors originating from the former cell types, especially testicular cancer are highly responsive to BLM therapy (13). In this study, we provide striking evidence that hCT2 mediates the intracellular uptake of BLM by modulating its expression levels in two different cancer cell lines. We propose that a high hCT2 activity level in a tumor cell sample would be prognostic of sensitivity to BLM treatment, whereas hCT2 deficiency would correlate with drug resistance.
EXPERIMENTAL PROCEDURES
Cell Lines and Culture Conditions
NT2/D1 cells were obtained from the American Type Culture Collection (ATCC) and the HCT116 human colorectal carcinoma cell line was kindly provided by Dr. Bert Vogelstein (Johns Hopkins, Baltimore, MD). The lung fibroblast cell line LL47 and the breast cancer cell line MCF-7 were provided by Drs. Elliot Drobetsky and El Bachir Affar, respectively (University of Montreal). The lymphoma cell lines Namalwa, Raji, RL, Daudi, and SR were originally purchased from the ATCC, and the DHL16 and H2 lymphoma cells were obtained from the GmbH collection (Braunschweig, Germany). All cell lines were cultured according to the conditions recommended by the ATCC and GmbH, and as described previously (31).
Drugs and Compounds
The following drugs and compounds were used for this study. BLM-A5 (LKT, laboratories Inc), blenoxane (USP), BLM-A2, 4-nitroquinoline-1-oxide, cisplatin; N1-acetylspermine trihydrochloride, palmitoyl-l-carnitine hydrochloride, 1-naphthylacetyl spermine trihydrochloride, betaine hydrochloride, and l-carnitine were all from Sigma. [14C]Spermidine trihydrochloride and l-[methyl-14C]carnitine hydrochloride were from Amersham Biosciences.
Transient Transfection for Gene Expression and siRNA Knockdown
Cells (∼1 × 10⁶) were seeded and transfected with the indicated plasmid (10 μg), vector, or siRNA oligonucleotide (70 nm) (Ambion) using Lipofectamine 2000 (Invitrogen) as previously described (31). The sequences of the two siRNA, hCT2-siRNA2 and hCT2-siRNA3 used against hCT2 were 5′-GCAGUAGCAUGUUUUUGUUTT-3′ and 5′-GCUAUGGUUGGAAAUUUGTT-3′, respectively. The control siRNA used is scrambled siRNA (Ambion AM4611, Applied Biosystems-Ambion, Austin, TX).
Construction of phCT2-GFP
The phCT2-GFP expression plasmid was constructed using standard methods. Briefly, the primers 5′-CAGTGCACGGCCTCGAGATGGGGTCCCGCCACTTCGAGGGG-3′ and 5′-CACCATGGTGGCGACCGGTGGATCCCCTTCACCAAGACCAGAATC-3′ (containing the restriction sites BamHI and XhoI, respectively) were used to amplify the entire SLC22A16 gene (1983 bp) from human cDNA (NCBI accession no. BC047565) carried by the pBluescriptR plasmid (ATCC 9125940) by PCR. The amplified product was digested by BamHI and XhoI and then cloned next to the CMV promoter in the vector pEYFP-N1 (Clontech) to create the hCT2-GFP gene fusion. Positive clones were isolated, amplified, and confirmed by dideoxy sequencing.
In Vitro BLM Activity
Different BLM species were tested for the ability to convert covalently closed circular DNA (form I) into the nicked DNA (form II). Complex of BLM-Fe was prepared in the ratio 1:3 for 1 h at room temperature. The same amount of plasmid DNA (∼200 ng) was treated with increasing concentrations of BLM-Fe (0, 0.1, 0.5, 1, and 5 μg/ml) at room temperature for 15 min. The reaction was stopped by adding EDTA at 0.25 m final concentration, and reaction products were loaded on a 1% agarose gel, electrophorized for 1 h at 100 V, after which gels were photographed following staining with ethidium bromide.
Western Blotting
HCT116 cells were transfected as above with either pEYFP or phCT2-GFP and harvested after transfection. Cell pellets were resuspended in 100 μl of lysis buffer (31), and after a 1-h incubation, samples were centrifuged at 1,000 rpm for 1 min, and the protein concentration was then assayed in the low speed supernatant (total extract) (32). The total extract was resolved on 8% denaturing polyacrylamide gels (with 3% polyacrylamide stacking gel) and probed by Western blot using antibodies against GFP (Clontech, CA) (31).
RT-PCR Analysis
Total RNA was isolated from ∼2.0 × 10⁶ cells using the TRIzol reagent (Invitrogen). cDNA was synthesized from 5 μg of total RNA using the Superscript First-Strand Synthesis Systems for RT-PCR kit (Invitrogen) using random primers. hCT2 gene expression was analyzed by PCR using two sets of primers. One set of primers, namely hCT2-A and hCT2-B (5′-ACCACGTGGGGCACTTCGGCAGATTCCAGAGAGTCC-3′ and 5′-GCTTGTGGCCCACAAGACCACCCGGCGTCCTAGCC-3′, respectively), generated a 536-bp hCT2 PCR product (Frag. 1). The other set of primers, hCT2-C and hCT2-D (5′-GGCTAGGACGCCGGGTGGTCTTGTGGGCCACAAGCA-3′ and 5′-GGCGACACACCATGCTGCCGCTTCCCACAGCCAGCG-3′, respectively) generated a 932-bp hCT2 PCR product (Frag. 2). Established primers for the control genes human GAPDH and β-actin were used, and these generated 320-bp and 200-bp PCR products, respectively. The PCR program used for amplification was as follows: 2 min at 95 °C followed by 25 cycles of 1-min denaturation at 94 °C, 2 min of annealing at 64 °C (for the two hCT2 fragments) or 59 °C (for the GAPDH fragment) or 55 °C (for the β-actin fragment), and 4 min of primer extension at 72 °C. The final step was an extension at 72 °C for 7 min. Products were analyzed on a 1% agarose gel stained with ethidium bromide.
F-BLM Uptake and Fluorescence Microscopy
Cells (∼1 × 10⁶) were incubated for 1 h at 37 °C in the absence or presence of F-BLM (1.2 μm) in a final volume of 200 μl of the respective serum-free growth medium. Uptake was terminated by washing the cells three times with 1 ml of ice-cold PBS, resuspending the cells in 1 ml of 50 mm NaHCO3 (pH 9.0), and lysing by sonication (4 × 5 s). F-BLM uptake was quantified using a PerkinElmer LS-S spectrofluorometer (λexc 495 nm; λem 525 nm) and the uptake rate expressed as pmol per 1 × 10⁶ cells. For microscopy, cells grown as monolayers on coverslips were coincubated with increasing concentrations of l-carnitine and a fixed amount of F-BLM (1.2 μm) for 1 h, washed three times with PBS, and then fixed for epifluorescence microscopy, which was performed using a Leica DMRE epifluorescence microscope equipped with an imaging camera at 100× magnification as described (31). A similar protocol was used for confocal microscopy (33).
l-[14C]Carnitine and [14C]Spermidine Uptake
For siRNA, cells (∼1 × 10⁶) were incubated for 1 h at 37 °C with l-[14C]carnitine (10 μm) or vehicle in 200 μl of serum-free medium. For the determination of kinetics parameters, cells were incubated for 60 min with increasing concentrations of either l-[14C]carnitine or [14C]spermidine. Uptake was terminated by washing the cells with 3 × 1 ml of ice-cold PBS and resuspended in 200 μl of PBS and processed for liquid scintillation spectrometry. The Vmax and Km values were determined by Lineweaver-Burke analysis.
Cytotoxicity Assay
Clonogenic assays were conducted as previously described (31).
RESULTS
hCT2 Expression Levels Correlate with Sensitivity to BLM
As outlined in the Introduction, we recently identified the carnitine permease Agp2 as conferring also high affinity polyamine and BLM-A5 transport activity in yeast (25, 27). We reasoned that permeases having dual carnitine and polyamine transport activities might also be responsible in mammals for the transport of BLM-A5, a BLM species characterized by the presence of a spermidinyl moiety on the bithiazole group. A previous study indicated that the carnitine transporter hCT2 is expressed very strongly and specifically in human testis and is required for spermatogenesis (28). Of interest, BLM is used as a first line chemotherapeutic agent against testicular cancer (13). We first examined the expression of hCT2 in two distinct human carcinoma cell lines, namely the testicular NT2/D1 and colon carcinoma HCT116 cells. RT-PCR confirmed that hCT2 was indeed strongly expressed in NT2/D1, whereas its expression was undetectable in HCT116 cells (Fig. 1). We assessed whether hCT2 expression level correlated with sensitivity to BLM using a clonogenic assay (34). The NT2/D1 cells were 330-fold more sensitive to BLM-A5 than HCT116 with IC50 values of 0.01 μm and 3.33 μm, respectively (Fig. 2A). However, both cell lines showed similar sensitivity toward several other DNA-damaging agents including methyl methane sulfonate, 4-nitroquinoline-1-oxide, and cisplatin (Fig. 2, B–D). These data exclude the possibility that increased sensitivity of NT2/D1 cells to BLM-A5 results from a generalized higher susceptibility to genotoxic agents.
FIGURE 1.
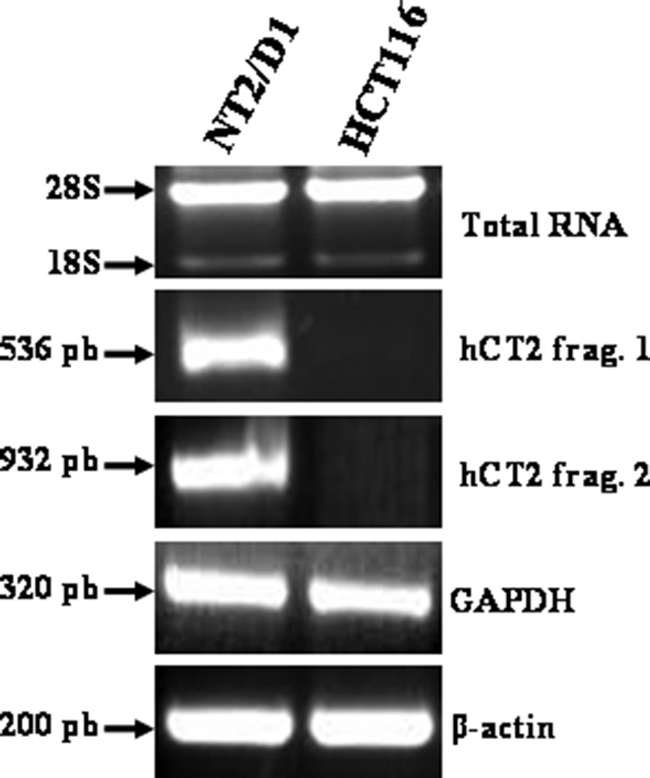
RT-PCR analysis of hCT2 expression in testicular and colon cancer cell lines. Briefly, total RNA was isolated from the cancer cell lines, and 5 μg were used to synthesize cDNA using Superscript First-Strand Synthesis Systems for RT-PCR with random primers. PCR products were separated by electrophoresis on a 1% agarose gel and detected with ethidium bromide. The GAPDH and β-actin genes were used as controls.
FIGURE 2.

Sensitivity of NT2/D1 and HCT116 cells toward various genotoxic agents. NT2/D1 and HCT116 cancer cells were treated with the indicated concentrations of bleomycin A5 (BLM-A5) (A), cisplatin (CPT) (B), 4-nitroquinoline-1-oxide (4-NQO) (C), and methyl methane sulfonate (MMS) (D) for 1 h and monitored for viability using clonogenic assay. Results are expressed as the mean ± S.D. from three separate experiments.
To further probe the correlation between hCT2 expression and BLM-A5 sensitivity, we checked two additional cell lines, the breast cancer MCF-7 and the lung fibroblast LL47. Both MCF-7 and LL47 showed a modest level of hCT2 expression and were clearly more resistant to BLM-A5 than NT2/D1, but showed the same level of sensitivity toward mitomycin C (see supplemental Fig. S1, panels A–C, respectively). Thus, it would appear that cellular sensitivity to BLM-A5 is specifically correlated with the level of hCT2 expression.
NT2/D1 Is More Sensitive to BLM-A5 Than to Other BLM Species
Because the clinical drug blenoxane consists of several species of BLMs including 69% of BLM-A2, 29.3% of BLM-B2, and 1.7% of other species such as BLM-A5 (35), we tested if the major specie BLM-A2 was equally active in killing NT2/D1 cells. BLM-A5, BLM-A2, and blenoxane used at the same concentration nicked superhelical plasmid DNA to the same extent, indicating that the BLMs are equally active at damaging DNA in vitro (Fig. 3A). Interestingly, the NT2/D1 cells were hypersensitive to BLM-A5, while it showed the same sensitivity to both BLM-A2 and blenoxane (Fig. 3B). We interpret these findings to suggest that BLM-A5 may enter the cells more specifically compared with the other species, although we cannot exclude, for example, that BLM-A5 might be more stable intracellularly, compared with BLM-A2.
FIGURE 3.

DNA damage potential by BLM-A5, BLM-A2, and blenoxane and cytotoxicity on NT2/D1 cells. A, damage to plasmid DNA by increasing concentrations of bleomycin species. Fixed amount of plasmid DNA (pCMV-hCT2-HA) was incubated at room temperature for 15 min with increasing concentrations of BLM-A5, BLM-A2, and blenoxane. Damaged to the DNA was assessed by monitoring the conversion of the covalently closed circular superhelical form (Form I) to the nicked form (Form II) or to the linear form (Form III). The DNA forms were analyzed on an agarose gel (1%) stained by ethidium bromide. Lane M, DNA size standard. B, NT2/D1 cells are hypersensitive to BLM-A5, as opposed to BLM-A2 or blenoxane. Cells were treated with the indicated concentrations of BLM for 1 h and monitor for viability using clonogenic assay. Results are expressed as the mean ± S.D. from three separate experiments with triplicate.
NT2/D1 Sensitivity Correlates with an Increased Level of F-BLM Uptake
We, therefore, assessed whether the level of hCT2 expression might correlate with the cellular entry of BLM-A5. This was examined using a fluorescein-BLM-A5 conjugate (F-BLM), which we previously characterized and showed to be genotoxically active, as well as demonstrated to enter yeast cells via the high affinity polyamine permease Agp2 (25, 26). NT2/D1 cells accumulated nearly 3× more F-BLM than HCT116 cells (Figs. 4, A and B). Quite notably, F-BLM was found to accumulate in acidic compartments (e.g. lysosomes and late endosomes) in NT2/D1 cells, as staining of these organelles with FM4–64 strongly co-localized with F-BLM (Fig. 4A).
FIGURE 4.

Increased accumulation of F-BLM in NT2/D1 cells. A, fluorescence analysis of F-BLM subcellular distribution in HCT116 and NT2/D1 cells. Cells were incubated with F-BLM (1.2 μm) for 1 h and prepared for microscopy as described under “Experimental Procedures.” DAPI and FM4–64 were used for nuclear and lysosomal staining, respectively. B, quantification of F-BLM levels in NT2/D1 and HCT116 cells. ***, p < 0.001.
l-Carnitine Blocks F-BLM Uptake in NT2/D1 Cells and Protects against BLM-A5 Genotoxicity
Because hCT2 is a high affinity l-carnitine permease, we examined whether l-carnitine could prevent BLM-A5 uptake and thus diminish BLM-A5 toxicity when cells are exposed to the drug. Coincubation with increasing concentrations of l-carnitine showed a drastic decrease in F-BLM uptake in NT2/D1, but not in HCT116 cells (Fig. 5A). These data are congruent with those shown in Fig. 4A, suggesting that there is indeed a basal uptake of F-BLM that might be mediated via a different transport pathway that is not competed by l-carnitine. Importantly, l-carnitine protected NT2/D1 (Fig. 5B), but not HCT116 cells (Fig. 5C) from BLM-A5-induced toxicity. Moreover, l-carnitine did not alter the sensitivity of NT2/D1 or HCT116 cells toward cisplatin (data not shown), which is believed to be transported via a different permease, namely the copper transporter (36). These data are consistent with the possibility that differential expression of a carnitine transporter such as hCT2 might be responsible for the differential sensitivity to BLM-A5 between both cell lines.
FIGURE 5.

l-carnitine blocks F-BLM uptake in NT2/D1, but not in HCT116 cells and protects against the cytotoxicity of BLM-A5. A, quantification of F-BLM uptake in NT2/D1 and HCT116 upon coincubation with l-carnitine. Cells were coincubated with increasing concentrations of l-carnitine (0–10 mm) and with F-BLM (1.2 μm) for 1 h, and the amount of internalized F-BLM measured using a spectrofluorometer. B and C, l-carnitine protects NT2/D1, but not HCT116, cells from the cytotoxic effects of BLM-A5. Cells were coincubated with l-carnitine and 1.2 μm BLM-A5 for 1 h and then monitored for survival using clonogenic assay. Results are expressed as the mean ± S.D. from three separate experiments. *, p < 0.05; **, p < 0.01; ***, p < 0.001.
hCT2-siRNA Knockdown in NT2/D1 Cells Causes Resistance to BLM-A5
To further evaluate whether hCT2 is involved in modulating BLM-A5 toxicity, we assessed the sensitivity of NT2/D1 cells to the drug following down-regulation of the transporter. We tested the effect of two siRNAs targeted to the knockdown of hCT2 that were derived from the middle portion and the C-terminal end of the hCT2 cDNA. Both were effective in down-regulating hCT2 expression by more than 75% following a 60-h transfection, as compared with control siRNA (Fig. 6A, lanes 2 and 3 versus 1). Consistent with the down-regulation of hCT2, l-[14C]carnitine uptake was significantly reduced in NT2/D1 cells treated with either siRNAs as opposed to control (Fig. 6B). Thus, both hCT2-siRNAs were effective in down-regulating the transport activity of hCT2.
FIGURE 6.

hCT2 siRNA knockdown in NT2/D1 cells protects against BLM-A5 toxicity. A, RT-PCR analysis showing siRNA knockdown of hCT2 expression in NT2/D1 cells. Cells were transfected with 70 nm of either the scrambled control siRNA (lane 1), siRNA2 derived from the middle portion (lane 2), or siRNA3 against the C terminus of hCT2 cDNA (lane 3), and 5 h later, growth medium was added to the transfected cells followed by incubation for another 60 h. Total RNA was extracted and RT-PCR was performed using specific primers for either hCT2, GAPDH, or β-actin (ACTB). PCR products were detected as in Fig. 1. B, hCT2-siRNA3 knockdown of hCT2 decreases l-carnitine uptake. Cells were transfected with the hCT2-siRNA3 as in panel A, harvested, washed, and resuspended in DMEM medium without serum. Uptake was monitored at the indicated times following the addition of l-[14C]carnitine (10 μm). Qualitatively similar results were obtained using siRNA2 (not shown). C and D, siRNA knockdown of hCT2 protects NT2/D1 cells against BLM-A5-, but not cisplatin-induced cytotoxicity. Cells were transfected with siRNA as in panel A and cells were treated with either BLM-A5 (C) or cisplatin (CPT) (D) for 1 h and then monitored for survival by a clonogenic assay as in Fig. 4.
To investigate the effect of hCT2 knockdown with respect to sensitivity to BLM-A5, we performed a clonogenic assay following exposure of NT2/D1 cells to BLM-A5 for 1 h. hCT2 knockdown conferred upon NT2/D1 cells increased resistance to BLM-A5 (Fig. 6C). Under these conditions, cells treated with 10 ng/ml of BLM-A5 showed a 35–45 ± 8% increase in resistance to the drug (Fig. 6C). Knockdown of hCT2 expression had no effect on the sensitivity of NT2/D1 cells toward cisplatin (Fig. 6D), in support of the specificity of hCT2 function toward BLM-A5 uptake.
hCT2-GFP Overexpression Sensitizes HCT116 to BLM-A5
To determine whether hCT2 overexpression could sensitize HCT116 cells to BLM-A5, we designed an expression system to drive hCT2 expression as a hCT2-GFP fusion protein from the CMV promoter in the vector pEYFP-N1 (31). RT-PCR analysis revealed that the plasmid expressed the hCT2 transgene within 6 h (data not shown), with the strongest expression being detected within 48 h after transfection (Fig. 7A). Western blot analysis revealed that the plasmid expressed a protein of the size (∼93 kDa) expected for a hCT2-GFP fusion (Fig. 7B) (28). To determine the subcellular localization of hCT2-GFP, we used confocal microscopy, which revealed that the fusion protein was specifically present on the plasma membrane (Fig. 7C). These data suggest that HCT116 cells can accommodate the ectopic expression of an hCT2-GFP fusion protein, and that this fusion protein is bound to the plasma membrane.
FIGURE 7.

hCT2 overexpression sensitizes HCT116 human colon cancer cells to BLM-A5. A, RT-PCR analysis for the transient expression of hCT2-EYFP in HCT116 cells. Cells (60–70% confluent) were transfected without or with either the empty vector pEYFP or the plasmid pCMV-hCT2-GFP and cells harvested at the indicated time to assess for hCT2-GFP expression. B, overexpression of hCT2-GFP fusion protein in transiently transfected HCT116 cells. Cells were transfected as in A, and total extracts (50 μg) were analyzed for hCT2-EYFP expression by Western blot probed with anti-GFP monoclonal antibody. The result is representative of three independent analyses. Molecular mass standards in kDa are indicated by arrows. C, plasma membrane localization of the hCT2-EYFP fusion protein in HCT116 cells. Cells were transiently transfected for 48 and 72 h with either the empty vector pEYFP or the plasmid pCMV-hCT2-GFP, and fixed for confocal microscopy. D, overexpression of hCT2-GFP enhances F-BLM uptake in HCT116 cells. Cells were transfected with either the EYFP or the pCMV-hCT2-GFP vectors for 48 h, followed by incubation with a fixed amount of F-BLM (2.3 μg/ml) for 1 h, and the level of drug uptake determined using a spectrofluorometer. E and F, hCT2 overexpression sensitizes HCT116 cells to BLM-A5, but not cisplatin toxicity. Cells were transiently transfected for 48 h with either the empty vector pEYFP or the pCMV-hCT2-GFP plasmid, followed by exposure to increasing concentrations of either BLM-A5 (E) or cisplatin (CPT) (F) for 1 h, and then monitored for survival by clonogenic assay. Results are expressed as the mean ± S.D. from three separate experiments.
We next monitored the uptake of F-BLM into HCT116 cells overproducing hCT2-GFP. As shown in Fig. 7D, these cells showed a 3-fold increase in F-BLM uptake, as compared with HCT116 cells transfected with vector alone. This finding suggests that the overexpressed hCT2-GFP hybrid is functionally active in BLM-A5 transport. Interestingly, hCT2-overexpressing HCT116 cells were significantly more sensitive to BLM-A5 (e.g. killing 30 ± 5% more cells with 50 ng/ml BLM-A5), than cells carrying the empty vector (Fig. 7E). hCT2 overexpression did not alter the sensitivity of HCT116 cells to cisplatin (Fig. 7F), keeping with the substrate specificity of hCT2. Altogether, our data strongly reinforce the notion that hCT2 confers the ability to transport BLM-A5 into cells.
hCT2 Displays a Higher Affinity for Polyamine Than l-Carnitine Transport
We previously showed that the yeast l-carnitine transporter gene AGP2 also directs high affinity polyamine transport (27). Because hCT2 has been reported to also transport other cations with varying affinities (28, 37), and that BLM-A5 has the unique characteristic of bearing a spermidine moiety on the bithiazole end of the molecule, we assessed whether it could mediate high affinity spermidine transport. For that purpose, we measured [14C]spermidine uptake in HCT116 cells overexpressing hCT2 or carrying the empty vector. hCT2 overexpression markedly increased the rate of both spermidine (Fig. 8A) and carnitine uptake (Fig. 8B) in HCT116 cells. Spermidine uptake in hCT2-overexpressing cells appeared to be saturable at ∼5 μm (Vmax of 23.1 ± 1.7 pmol/107 cells/h) with a Km of 0.35 ± 0.16 μm. On the other hand, l-carnitine uptake was not yet saturated at 5 μm of substrate (Vmax of 39 ± 2 pmol/107/h) with a Km of 8 ± 1 μm. It is noteworthy that HCT116 cells carrying the vector alone exhibited high affinity (Km = 2.7 ± 0.6 μm) and saturable spermidine transport activity (Vmax = 15.9 ± 1.4 pmol/107 cells/h) and l-carnitine uptake (Km = 7.8 ± 1.3 μm; Vmax = 8.0 ± 0.6 pmol/107 cells/h), indicating the presence of other endogenous transporter(s) able to use spermidine and l-carnitine as substrates. These results strongly suggest that hCT2 may act as a high affinity transporter for polyamines, and that the spermidinyl moiety of BLM-A5 may play a role in mediating the uptake of this drug by hCT2.
FIGURE 8.

hCT2 expression stimulates [14C]spermidine and l-carnitine uptake into HCT116 cells. A and B, concentration dependence and kinetic analysis of [14C]spermidine and l-carnitine uptake. Cells were incubated with increasing concentrations of radiolabeled spermidine or l-carnitine for 1 h, before determination of intracellular radioactivity. The Vmax and Km were determined by Lineweaver-Burke analysis and plotted using the GraphPad software Prism 5. The plot shows the real effect of hCT2-GFP.
Polyamine- and l-Carnitine-related Compounds Compete for hCT2-mediated [14C]Spermidine Uptake
If indeed hCT2 acts as dual transporter for polyamines and carnitine, one should expect that polyamine- and l-carnitine-related compounds such as N1-acetylspermine and palmitoyl-l-carnitine, respectively, to compete against [14C]spermidine uptake. As shown in Fig. 9A, the uptake of radiolabeled spermidine into HCT116 cells expressing hCT2-GFP was reduced to various extent when the cells were co-incubated with the putative competitive inhibitors. N1-Acetylspermine and N1-naphthylacetyl spermine completely blocked [14C]-spermidine uptake, whereas palmitoyl-l-carnitine and betaine showed only partial, yet significant (p < 0.01) inhibition at the concentration used (50 μm) (Fig. 9A, insets show the specific net effect on hCT2-mediated uptake). These data suggest that hCT2 has a higher affinity for polyamine-related compounds than l-carnitine. Quite surprisingly, l-carnitine was found to act as a competitive inhibitor of both basal and hCT2-dependent [14C]spermidine uptake (Fig. 9B). The Ki value for inhibition of the hCT2-specific component of spermidine transport by l-carnitine was calculated as 81.5 ± 14.3 μm. The present results demonstrate that both polyamine- and carnitine-related compounds interfere with basal as well as hCT2-mediated spermidine transport, polyamine-related compounds being the most potent inhibitors. The observation that l-carnitine and some of its derivatives are moderately good inhibitors of spermidine transport was unexpected since the carboxyl group of amino acids has generally been considered to be incompatible with recognition by the polyamine transport system (38).
FIGURE 9.

Polyamine- and l-carnitine-related compounds compete for hCT2-mediated uptake of [14C]spermidine uptake. A, the uptake levels of [14C]spermidine (1.5 μm) by HCT116 cells overexpressing hCT2 was determined in the absence or presence of the indicated compounds inhibitor at 50 μm for 30 min. Results are expressed as the mean ± S.D. from two separate experiments. B, concentration-dependent inhibition of [14C]spermidine (1.5 μm) by unlabeled l-carnitine using HCT116 cells overexpressing hCT2. The uptake was monitored after 30 min of incubation and the experiment was done twice. The inhibition constant was determined using the GraphPad Software Prism 5.
A Non-Hodgkin Lymphoma Cell Line Exhibiting High hCT2 Expression Displays Hypersensitivity to BLM-A5
To explore the potential significance of hCT2 in the context of BLM therapy, we monitored hCT2 expression in a panel of seven non-Hodgkin lymphoma cell lines. Currently, non-Hodgkin lymphoma patients are being treated with blenoxane, but it is not clear why only a fraction of patients are responsive to the drug (39). RT-PCR showed that among the seven cell lines only one, namely H2, expressed the highest level of hCT2 (Fig. 10, A and B). We then examined the sensitivity of H2 cells toward BLM-A5 and cisplatin. As shown in Fig. 10C, H2 cells were much more sensitive to BLM-A5 than the Namalwa cell line that expressed hCT2 at a much lower level, whereas both cell lines showed similar sensitivity to cisplatin (Fig. 10D). These latter findings suggest that lymphoma cells expressing high hCT2 levels might have a more favorable prognosis for a patient's response to blenoxane.
FIGURE 10.

BLM-A5 sensitivity of lymphoma cell lines with different levels of hCT2 expression. A and B, RT-PCR analysis showing the levels of hCT2 expression in several lymphoma cell lines. RT-PCR analysis was performed on cDNA derived from total RNA and the PCR products assessed as in Fig. 1. C and D, the high-level hCT2-expressing cells H2 exhibit hypersensitivity to BLM-A5, but not to cisplatin. Cells were treated with 0.5 μg/ml of either BLM-A5 (C) or cisplatin (CPT) (D) for 1 h and then monitored for survival using clonogenic assay.
DISCUSSION
In this study, we show that modulating the level of the l-carnitine transporter hCT2 plays a key role in specifically altering the sensitivity of cells to the anticancer polyamine analogue BLM-A5. This is supported by the findings that NT2/D1 testicular cancer cells that strongly express hCT2, have a higher net rate of F-BLM accumulation and are selectively much more sensitive to BLM-A5 in a l-carnitine-inhibitable manner, than HCT116 colon cancer cells that do not express hCT2 or the breast and lung cancer cells that weakly express the transporter. Quite strikingly, siRNA-directed hCT2 knockdown specifically suppresses F-BLM uptake and the genotoxic effect of BLM-A5. Moreover, transfecting HTC116 cells with a hCT2-GFP expression vector confers to these cells sensitivity to BLM-A5 while increasing both l-carnitine and spermidine transport activity in the host cells. Taken together, our data strongly suggest that modulating hCT2 levels could control sensitivity toward BLM-A5, and that hCT2 mediates BLM-A5 uptake into the cell. As such, we propose that hCT2 could be a determining factor for patients' responses to treatment regimens consisting of BLM. It is thus noteworthy that hCT2 is significantly expressed at widely heterogeneous levels in normal and tumor cells of hematopoietic origin (40), as clearly demonstrated in our survey for a panel of human non-Hodgkin lymphoma cell lines where the strongest hCT2 expression correlated with hypersensitivity to BLM-A5.
The observation that NT2/D1 cells are 4-fold more sensitive to BLM-A5 as compared with BLM-A2 or blenoxane is not likely related to the genotoxic potential of the different species, as each drug showed similar level of damage to plasmid DNA at the same concentration in vitro (Fig. 3). We postulate that this differential sensitivity might be related to the selective entry of the drug whereby hCT2 could recognize BLM-A5 and target its transport more efficiently into the cell. This seems reasonable in light of the fact that our study also shows that hCT2 is a high affinity polyamine transporter, and that BLM-A5, but not BLM-A2 nor BLM-B2, has a polyamine moiety (27).
Of interest is a report showing that stable transfectants of Jurkat cells (T-cell leukemia) overexpressing hCT2 display increased sensitivity to adriamycin, a drug used against various diseases including hematological malignancies (37). In that study, hCT2 was shown to mediate the high affinity, saturable uptake of adriamycin (Km of ∼5 μm) (37). Clearly, hCT2 behaves like a typical polyspecific organic cation antiporter with a broad spectrum of substrates albeit with diverse affinities (29, 37). We could not accurately measure the affinity for BLM-A5 uptake by hCT2 because radiolabeled BLM is not commercially available, and the bulky fluorescein-labeled BLM-A5 conjugate is unlikely to yield a Km value close to that of BLM-A5 as a single entity. Because hCT2 exhibits a high affinity for spermidine transport (Km = 0.35 μm), and BLM-A5 differs from the other BLM species by its spermidinyl moiety, we predict that SLC22A16 may also use BLM-A5 with an affinity comparable to or perhaps even higher than that measured for adriamycin (28, 37).
Current regimens use BLM, etoposide, and cisplatin for treating testicular cancer (13). Even though hCT2 transports both BLM-A5 and adriamycin, the effectiveness of these drugs or lack thereof against a given type of cancer must be influenced by other mechanisms of resistance such as DNA repair (17). The high affinity of hCT2 for polyamines suggests that altering the ratio of BLM species to increase the BLM-A5 fraction in blenoxane might increase the clinical efficacy of the drug. Furthermore, we propose that finding strategies to upregulate hCT2 expression (e.g. treatment with progesterone) (41) could extend the range of applications of BLM to other tumor types such as colon, breast, lung, and endometrial cancers that are generally refractory to BLM.
In addition to hCT2, the polyspecific OCTN organic cation antiporters SLC22A4 (OCTN1), SLC22A5 (OCTN2), and SLC22A21 (OCTN3) also transport l-carnitine, with SLC22A5 displaying the highest affinity (28, 29, 42–44). Interestingly, the closest homolog to hCT2 is the peroxisomal carnitine transporter SLC22A21 (45), which is most highly expressed in the testis (44), like hCT2. We are currently examining whether any of the three OCTN carnitine transporters can also transport BLM-A5 or other BLM species.
Our data from the yeast genome-wide screen revealed that in addition to the Agp2 transporter, other regulatory factors including the Sky1 SR kinase are involved in regulating resistance to BLM (25). In fact, AGP2 and SKY1 genetically interact in yeast,4 although the mechanism remains unclear. It is noteworthy that a similar SR kinase, SRPK1, exists in mammalian cells, and that a dominant negative form was shown to confer resistance to BLM, but not to other DNA-damaging agents (46). This observation strongly suggests that a conserved pathway might exist in eukaryotic cells that regulates the genotoxic effects of BLM (25, 46). Thus, unraveling the mechanism by which the dominant negative SRPK1 triggers BLM resistance could be an important clue to understand the nature of this drug-resistant pathway that would allow the development of better regimens using BLM.
Quite importantly, the present study identifies one of the first high affinity permeases directing polyamine import in vertebrates. A very recent report documented that SLC12A8A (CCC9a), a splice variant of the cation/Cl− cotransporter superfamily, mediates the uptake of polyamines and selected amino acids (e.g. aspartic and glutamic acids) with weak catalytic activity (47). However, SLC12A8A exhibits properties which are markedly at departure with those reported for the ubiquitous polyamine transport system found in mammalian cells (48), and its physiological relevance to polyamine transport remains to be clarified. In the present report, we have gathered evidence showing that hCT2 is a high affinity polyamine permease endowed with the ability to also transport large polyamine conjugates such as BLM-A5 and F-BLM, and l-carnitine, in addition to its already known ability to transport unrelated substrates such as adriamycin and tetraethylammonium (37). SLC22A16 is a member of the organic cation transport family within the major facilitator superfamily (29), and is thus phylogenetically very different from the diamine and polyamine permeases identified thus far in trypanosomatids, which are H+-dependent symporters belonging to an isolated group within the APC (amino acid-polyamine-polycation) superfamily (49). hCT2 also exhibits a fairly restricted pattern of tissue distribution, quite unlike the archetypical polyamine transport system that has been extensively described in mammalian cells of various tissue origins and has relatively homogeneous properties (48). It is thus unlikely to represent the major, ubiquitous polyamine permease whose biochemical properties have been reported by several laboratories (38, 48, 50). An intriguing possibility might be that hCT2, which is most highly expressed in the epididymis (28), functions as a polyamine:l-carnitine antiporter by exporting polyamines in exchange for l-carnitine during sperm capacitation, which has an absolute requirement for the latter amino acid (33). Quite intriguingly, the classical mammalian polyamine transport system is known to use a much narrower range of substrates that excludes amino acids and quaternary amines (51). Thus, the present finding that l-carnitine, which bears both a quaternary ammonium and a carboxyl groups, was able to competitively inhibit both basal and hCT2-mediated spermidine uptake with Ki values in the range of 80 to 100 μm was quite unexpected. Additional work is needed to verify whether inhibition by l-carnitine is a general property of polyamine transport in other mammalian cell types.
Supplementary Material
Acknowledgments
We thank Drs. Markus Tamas and Omar Tounekti for valuable comments. We thank Xiaoming Yang and Isabelle Savoie Rondeau, and Drs. Sonish Azam and Denis-Claude Roy for their expertise on cloning and sequencing, Western blot, clonogenic assays, confocal microscopy, and the non-Hodgkin's lymphoma cell lines. We are grateful to Dr. Elliot Drobetsky for his expertise on the carcinoma cell lines and for using his cell culture facilities.
This work was supported by Grant MOP-67196 (to D. R.) from the Canadian Institutes of Health Research.

The on-line version of this article (available at http://www.jbc.org) contains supplemental Fig. S1.
M. Aouida, A. Leduc, and D. Ramotar, unpublished data.
- BLM
- bleomycin
- GFP
- green fluorescent protein
- PBS
- phosphate-buffered saline.
REFERENCES
- 1.Umezawa H. (1965) Antimicrobial Agents Chemother. 5, 1079–1085 [PubMed] [Google Scholar]
- 2.Umezawa H., Maeda K., Takeuchi T., Okami Y. (1966) J. Antibiot. 19, 200–209 [PubMed] [Google Scholar]
- 3.Umezawa H. (1971) Pure. Appl. Chem. 28, 665–680 [DOI] [PubMed] [Google Scholar]
- 4.Giloni L., Takeshita M., Johnson F., Iden C., Grollman A. P. (1981) J. Biol. Chem. 256, 8608–8615 [PubMed] [Google Scholar]
- 5.Steighner R. J., Povirk L. F. (1990) Mutat. Res. 240, 93–100 [DOI] [PubMed] [Google Scholar]
- 6.Burger R. M. (1998) Chemical Reviews 98, 1153–1170 [DOI] [PubMed] [Google Scholar]
- 7.Worth L., Jr., Frank B. L., Christner D. F., Absalon M. J., Stubbe J., Kozarich J. W. (1993) Biochemistry 32, 2601–2609 [DOI] [PubMed] [Google Scholar]
- 8.Bennett R. A., Swerdlow P. S., Povirk L. F. (1993) Biochemistry 32, 3188–3195 [DOI] [PubMed] [Google Scholar]
- 9.Dar M. E., Jorgensen T. J. (1995) Nucleic Acids Res. 23, 3224–3230 [DOI] [PMC free article] [PubMed] [Google Scholar]
- 10.Tates A. D., van Dam F. J., Natarajan A. T., Zwinderman A. H., Osanto S. (1994) Mutat. Res. 307, 293–306 [DOI] [PubMed] [Google Scholar]
- 11.Miyaki M., Ono T., Hori S., Umezawa H. (1975) Cancer Res. 35, 2015–2019 [PubMed] [Google Scholar]
- 12.Lazo J. S., Sebti S. M., Schellens J. H. (1996) Cancer Chemother. Biol. Response Modif. 16, 39–47 [PubMed] [Google Scholar]
- 13.Einhorn L. H. (2002) Proc. Natl. Acad. Sci. U.S.A. 99, 4592–4595 [DOI] [PMC free article] [PubMed] [Google Scholar]
- 14.Nichols C. R., Roth B. J., Loehrer P. J., Williams S. D., Einhorn L. H. (1994) Semin Oncol. 21, 102–108 [PubMed] [Google Scholar]
- 15.Sebti S. M., Jani J. P., Mistry J. S., Gorelik E., Lazo J. S. (1991) Cancer Res. 51, 227–232 [PubMed] [Google Scholar]
- 16.Jani J. P., Mistry J. S., Morris G., Davies P., Lazo J. S., Sebti S. M. (1992) Cancer Res. 52, 2931–2937 [PubMed] [Google Scholar]
- 17.Ramotar D., Wang H. (2003) Curr. Genet. 43, 213–224 [DOI] [PubMed] [Google Scholar]
- 18.Robertson K. A., Bullock H. A., Xu Y., Tritt R., Zimmerman E., Ulbright T. M., Foster R. S., Einhorn L. H., Kelley M. R. (2001) Cancer Res. 61, 2220–2225 [PubMed] [Google Scholar]
- 19.Poddevin B., Orlowski S., Belehradek J., Jr., Mir L. M. (1991) Biochem. Pharmacol. 42, suppl., S67–S75 [DOI] [PubMed] [Google Scholar]
- 20.Orlowski S., Belehradek J., Jr., Paoletti C., Mir L. M. (1988) Biochem. Pharmacol. 37, 4727–4733 [DOI] [PubMed] [Google Scholar]
- 21.Aouida M., Tounekti O., Belhadj O., Mir L. M. (2003) Antimicrob. Agents Chemother. 47, 2012–2014 [DOI] [PMC free article] [PubMed] [Google Scholar]
- 22.Tounekti O., Pron G., Belehradek J., Jr., Mir L. M. (1993) Cancer Res. 53, 5462–5469 [PubMed] [Google Scholar]
- 23.Pron G., Belehradek J., Jr., Mir L. M. (1993) Biochem. Biophys. Res. Commun. 194, 333–337 [DOI] [PubMed] [Google Scholar]
- 24.van Roermund C. W., Hettema E. H., van den Berg M., Tabak H. F., Wanders R. J. (1999) EMBO J. 18, 5843–5852 [DOI] [PMC free article] [PubMed] [Google Scholar]
- 25.Aouida M., Pagé N., Leduc A., Peter M., Ramotar D. (2004) Cancer Res. 64, 1102–1109 [DOI] [PubMed] [Google Scholar]
- 26.Aouida M., Leduc A., Wang H., Ramotar D. (2004) Biochem. J. 384, 47–58 [DOI] [PMC free article] [PubMed] [Google Scholar]
- 27.Aouida M., Leduc A., Poulin R., Ramotar D. (2005) J. Biol. Chem. 280, 24267–24276 [DOI] [PubMed] [Google Scholar]
- 28.Enomoto A., Wempe M. F., Tsuchida H., Shin H. J., Cha S. H., Anzai N., Goto A., Sakamoto A., Niwa T., Kanai Y., Anders M. W., Endou H. (2002) J. Biol. Chem. 277, 36262–36271 [DOI] [PubMed] [Google Scholar]
- 29.Koepsell H., Lips K., Volk C. (2007) Pharm. Res. 24, 1227–1251 [DOI] [PubMed] [Google Scholar]
- 30.Eraly S. A., Nigam S. K. (2002) Biochem. Biophys. Res. Commun. 297, 1159–1166 [DOI] [PubMed] [Google Scholar]
- 31.Azam S., Drobetsky E., Ramotar D. (2007) Apoptosis 12, 1243–1255 [DOI] [PubMed] [Google Scholar]
- 32.Bradford M. M. (1976) Anal. Biochem. 72, 248–254 [DOI] [PubMed] [Google Scholar]
- 33.Soulet D., Gagnon B., Rivest S., Audette M., Poulin R. (2004) J. Biol. Chem. 279, 49355–49366 [DOI] [PubMed] [Google Scholar]
- 34.Azam S., Jouvet N., Jilani A., Vongsamphanh R., Yang X., Yang S., Ramotar D. (2008) J. Biol. Chem. 283, 30632–30641 [DOI] [PMC free article] [PubMed] [Google Scholar]
- 35.Dorr R. T., Meyers R., Snead K., Liddil J. D. (1998) Cancer Chemother. Pharmacol. 42, 149–154 [DOI] [PubMed] [Google Scholar]
- 36.Song I. S., Savaraj N., Siddik Z. H., Liu P., Wei Y., Wu C. J., Kuo M. T. (2004) Mol. Cancer Ther. 3, 1543–1549 [PubMed] [Google Scholar]
- 37.Okabe M., Unno M., Harigae H., Kaku M., Okitsu Y., Sasaki T., Mizoi T., Shiiba K., Takanaga H., Terasaki T., Matsuno S., Sasaki I., Ito S., Abe T. (2005) Biochem. Biophys. Res. Commun. 333, 754–762 [DOI] [PubMed] [Google Scholar]
- 38.Seiler N. (2003) Curr. Drug Targets 4, 565–585 [DOI] [PubMed] [Google Scholar]
- 39.Canellos G. P. (2004) Semin Hematol. 41, 26–31 [DOI] [PubMed] [Google Scholar]
- 40.Gong S., Lu X., Xu Y., Swiderski C. F., Jordan C. T., Moscow J. A. (2002) Exp. Hematol. 30, 1162–1169 [DOI] [PubMed] [Google Scholar]
- 41.Sato N., Ito K., Onogawa T., Akahira J., Unno M., Abe T., Niikura H., Yaegashi N. (2007) Int. J. Gynecol. Pathol. 26, 53–60 [DOI] [PubMed] [Google Scholar]
- 42.Tamai I., Ohashi R., Nezu J., Yabuuchi H., Oku A., Shimane M., Sai Y., Tsuji A. (1998) J. Biol. Chem. 273, 20378–20382 [DOI] [PubMed] [Google Scholar]
- 43.Alnouti Y., Petrick J. S., Klaassen C. D. (2006) Drug Metab. Dispos. 34, 477–482 [DOI] [PubMed] [Google Scholar]
- 44.Tamai I., Ohashi R., Nezu J. I., Sai Y., Kobayashi D., Oku A., Shimane M., Tsuji A. (2000) J. Biol. Chem. 275, 40064–40072 [DOI] [PubMed] [Google Scholar]
- 45.Lamhonwah A. M., Ackerley C. A., Tilups A., Edwards V. D., Wanders R. J., Tein I. (2005) Biochem. Biophys. Res. Commun. 338, 1966–1972 [DOI] [PubMed] [Google Scholar]
- 46.Sanz G., Mir L., Jacquemin-Sablon A. (2002) Cancer Res. 62, 4453–4458 [PubMed] [Google Scholar]
- 47.Daigle N. D., Carpentier G. A., Frenette-Cotton R., Simard M. G., Lefoll M. H., Noël M., Caron L., Noël J., Isenring P. (2009) J. Cell. Physiol. 220, 680–689 [DOI] [PubMed] [Google Scholar]
- 48.Seiler N., Dezeure F. (1990) Int. J. Biochem. 22, 211–218 [DOI] [PubMed] [Google Scholar]
- 49.Hasne M. P., Ullman B. (2005) J. Biol. Chem. 280, 15188–15194 [DOI] [PubMed] [Google Scholar]
- 50.Lessard M., Zhao C., Singh S. M., Poulin R. (1995) J. Biol. Chem. 270, 1685–1694 [PubMed] [Google Scholar]
- 51.Gordonsmith R. H., Brooke-Taylor S., Smith L. L., Cohen G. M. (1983) Biochem. Pharmacol. 32, 3701–3709 [DOI] [PubMed] [Google Scholar]
Associated Data
This section collects any data citations, data availability statements, or supplementary materials included in this article.