

Abstract
The receptor peroxisome proliferator-activated receptor γ (PPARγ) is considered a master regulator of adipocyte differentiation and promotes glucose and lipid metabolism in mature adipocytes. We recently identified the yeast Sterile 20 (Ste20) protein kinase ortholog, Map4k4, in an RNA interference-based screen as an inhibitor of PPARγ expression in cultured adipocytes. Here, we show that RNA interference-mediated silencing of Map4k4 elevates the levels of both PPARγ1 and PPARγ2 proteins in 3T3-L1 adipocytes without affecting PPARγ mRNA levels, suggesting that Map4k4 regulates PPARγ at a post-transcriptional step. PPARγ degradation rates are remarkably rapid as measured in the presence of cycloheximide (t½ = 2 h), but silencing Map4k4 had no effect on PPARγ degradation. However, depletion of Map4k4 significantly enhances [35S]methionine/cysteine incorporation into proteins, suggesting that Map4k4 signaling decreases protein translation. We show a function of Map4k4 is to inhibit rapamycin-sensitive mammalian target of rapamycin (mTOR) activity, decreasing 4E-BP1 phosphorylation. In addition, our results show mTOR and 4E-BP1 are required for the increased PPARγ protein expression upon Map4k4 knockdown. Consistent with this concept, adenovirus-mediated expression of Map4k4 decreased PPARγ protein levels and mTOR phosphorylation. These data show that Map4k4 negatively regulates PPARγ post-transcriptionally, by attenuating mTOR signaling and a 4E-BP1-dependent mechanism.
Keywords: Diseases/Metabolic, Phosphorylation, Phosphorylation/Kinases/Serine-Threonine, Protein/Biosynthesis, RNA/RNAi, Signal Transduction, Translation/Control, Viruses/Adenoviruses
Introduction
Adipose tissue has long been recognized as the major storage depot for excess food-derived energy and has more recently been identified as an endocrine organ critical in the hormonal regulation of energy homeostasis (1). Dysfunctions in these roles, which occur as a result of adipose tissue expansion in obesity, appear to be key elements in the development of insulin resistance and ultimately type 2 diabetes (2). Maintenance of adipose tissue functions, including lipid sequestration as triglyceride stores, depends in part on appropriate levels of expression of genes required for triglyceride synthesis and storage. Many such genes are regulated by the nuclear hormone receptor PPARγ,2 a nuclear hormone transcription factor. It is considered a master regulator of adipocyte differentiation (3) and essential for the increase in adipose mass associated with obesity (4). Additionally, PPARγ is activated by lipid ligands (5) and plays an important role in glucose homeostasis and regulation of lipid metabolism in mature adipocytes.
Understanding the regulation of PPARγ, a major metabolic modulator, would provide a better comprehension of its role in whole body homeostasis. PPARγ expression could be regulated at different levels, transcription, protein turnover and degradation, and possibly translation. Tumor necrosis factor-α-mediated IκB kinase stimulation activates NF-κB signaling thus potently decreasing PPARγ transcription (6–8). Studies have shown that phosphorylation of PPARγ promotes its degradation through a ubiquitin-proteasome-dependent pathway (9, 10). Stephens and co-workers (10) have shown that PPARγ protein has a rapid turnover, and interferon γ treatment further enhanced the protein turnover.
In a screen for regulators of adipocyte functions, including glucose uptake, we recently identified Map4k4 as an inhibitor of PPARγ expression (11). Map4k4 is a serine/threonine protein kinase that belongs to a large group of protein kinases related to Saccharomyces cerevisiae Ste20. The potential involvement of Map4k4 as an element in obesity-associated adipocyte dysfunction was suggested by the observations that it is acutely activated (12) and increased in expression by tumor necrosis factor-α (13), a cytokine overproduced in adipose tissue associated with obesity in animal models as well as human patients (14). Silencing Map4k4 has been shown to improve glucose uptake and insulin sensitivity as well as triglyceride synthesis in cultured adipocytes (11).
In our previous studies, enhanced expression of PPARγ upon Map4k4 gene silencing in 3T3-L1 adipocytes was observed (11). However, our preliminary data suggested that this enhancement is not the result of increased PPARγ mRNA levels. We have thus focused on the synthesis of PPARγ protein as a potential control point for Map4k4 effects.
Of the three phases of protein translation, initiation is a complex process that is mediated by many different proteins (15, 16). Global control of protein synthesis is achieved by changes in the phosphorylation state of initiation factors or their interacting regulators. One of the first steps of initiation of protein synthesis and a rate-limiting step is the formation of a “ternary complex” by Met-tRNA and GTP-bound eIF2-α. Another means of translation regulation involves modulation of eIF4e (cap-binding protein) availability that is achieved by eIF4e-binding proteins called 4e-BPs. Hypophosphorylated 4e-BPs bind to eIF4e and prevent interaction between the 43 S preinitiation complex and mRNA that leads to inhibition of translation initiation. Association of eIF4e and the scaffold protein eIF4G is through a small domain also present in 4e-BPs. Nonphosphorylated 4e-BP binds tightly to eIF4E preventing its association with eIF4G. Phosphorylated 4e-BP is inactive and dissociates allowing eIF4e to engage eIF4G to form the complex that facilitates translation initiation (17, 18). Mammalian target of rapamycin (mTOR) is a conserved Ser/Thr kinase and a major regulator of cell growth and proliferation via modulating protein synthesis in response to environmental cues. 4E-BP1 and S6K1 are well known downstream targets of mTOR and are phosphorylated upon insulin stimulation (19). Insulin is a major upstream effector of mTOR that enhances protein synthesis as part of regulating anabolic processes in response to glucose. Thus, impaired mTOR signaling might play a role in the development of glucose and insulin resistance and type 2 diabetes. In this study we have examined the role of Map4k4 in regulating PPARγ protein and embarked on identifying the players that are regulated by Map4k4 that potentially would regulate PPARγ protein expression.
EXPERIMENTAL PROCEDURES
Materials
Antibodies against eIF2-α (total (catalog no. 9722) and phospho-Ser-51 (catalog no. 9721)), 4E-BP1 (total (catalog no. 9452), phospho-Thr-37/46 (catalog no. 9459), Ser-65 (catalog no. 9451), and Thr-70 (catalog no. 9455)), 4e-BP2 (catalog no. 2845), and mTOR (total (catalog no. 2972) and phospho-Ser-2448 (catalog no. 2971)) were purchased from Cell Signaling Technology, Inc. Antibody against PPARγ (catalog no. sc-7273) was purchased from Santa Cruz Biotechnology. Antibody against actin was purchased from Sigma (catalog no. A2228). Rapamycin was purchased from Calbiochem (catalog no. 553210). All siRNA was purchased from Dharmacon (Lafayette, CO). [35S]Met protein labeling mix was purchased from PerkinElmer Life Sciences.
Cell Culture and siRNA Transfection
3T3-L1 fibroblasts were cultured and differentiated into adipocytes as described previously (20). For siRNA transfection, cells 4 days post-induction of differentiation were used as described previously (11). Briefly, 5.625 × 10⁵ cells were electroporated using 7.5 nmol of siRNA for scrambled, Map4k4, or 1.87 nmol of siRNA for 4E-BP1 and 4e-BP2 and then plated in 4 wells of a 24-well plate. Cells were recovered in complete Dulbecco's modified Eagle's medium (10% fetal bovine serum, 50 units/ml penicillin, and 50 μg/ml streptomycin) and were cultured for 48 or 72 h after the transfection before beginning the experiments.
[35S]Met/Cys Labeling
3T3-L1 adipocytes 4 days post-differentiation induction were transfected with 7.5 nmol of scrambled or Map4k4 siRNA. 56 h later, cells were starved for methionine and cysteine using methionine- and cysteine-free Dulbecco's modified Eagle's medium. 16 h later, 45 μCi/ml [35S]methionine/cysteine protein labeling mix was added to the cells for 1, 3, or 6 h. Cell lysates were prepared, and total DNA and RNA were harvested. An equal volume of protein was analyzed to measure 35S incorporation on a scintillation counter. Cell lysate was resolved on SDS-PAGE and transferred onto a nitrocellulose membrane, and 35S incorporation was detected by autoradiography. The incorporation of radioactivity was normalized to total DNA content of that sample.
Rapamycin Treatment
For 3T3-L1 adipocytes, 72-h post-siRNA transfections were treated with the indicated concentration of rapamycin for 0.5, 1, or 2 h. In all experiments, cells were washed with ice-cold phosphate-buffered saline and harvested on ice as described previously (21). Protein samples were separated on a 7% (for mTOR) or a 15% (for 4e-BP) SDS-polyacrylamide gel and transferred to a nitrocellulose membrane. Membranes were then analyzed by Western blot analysis. Changes in phosphorylation were determined through densitometry using Adobe Photoshop and normalized for loading against the nonphosphorylated protein or actin as appropriate.
Cell Size Determination
3T3-L1 adipocytes after transfection with the appropriate siRNA were seeded on coverslips in a 12-well plate. After 72 h, cells were washed in ice-cold phosphate-buffered saline. The cells were fixed in 4% formaldehyde at room temperature for 0.2 h, quickly rinsed three times in ice-cold phosphate-buffered saline, briefly dried, and mounted on Vectashield mounting medium (H1000). The coverslip was sealed using nail polish. Cell images were collected under a microscope (Zeiss inverted microscope) using bright field at ×20 magnification. Saved images were analyzed for cell size by measuring the cell circumference of 150 randomly picked cells using the ImageJ program (National Institutes of Health). Average cell circumference for each siRNA transfection was calculated and graphically represented using Microsoft EXCEL.
Isolation of RNA and Quantitative Real Time PCR
RNA isolation was performed according to the TRIzol reagent protocol (Invitrogen). Briefly, media were aspirated, and the cells were washed once with ice-cold phosphate-buffered saline. 1 ml of TRIzol reagent was added to each well. The concentration and the purity of the RNA were determined by measuring the absorbance at 260/280 nm. To further determine the quality of the RNA, 1 μg of total RNA was run on a 1% agarose gel, and the quality of the 28 S and 18 S ribosomal bands was inspected visually. cDNA was synthesized using 1 μg of RNA and the iScript cDNA synthesis kit (Bio-Rad). The cDNA was synthesized according to the protocol provided by the manufacturer in a 20-μl reaction volume. For real time PCR, 1 μl of the synthesized cDNA was loaded into 1 well of a 96-well plate for detection of a specific target gene. Primers were designed with primer bank (22) and listed in supplemental Fig. S5. 36B4 was used as an internal control because its expression did not change with the silencing of the genes used in this study. 10 pmol of forward and reverse primer along with 12.5 μl of the iQ SYBR Green Supermix (Bio-Rad) was added to each well along with DNase/RNase-free water for a final volume of 25 μl. Samples were analyzed on the MyIQ real time PCR system (Bio-Rad). Relative gene expression was determined using the ΔCt method (23).
Adenovirus Expression
Four days after differentiation, 3T3-L1 adipocytes were infected with the indicated amount of viral particles. Briefly, 10,000 cells were infected using 40 μl (1.43 × 10¹² particles/ml) of HA control virus or 3HA-Map4k4-HA virus. 72 h post-infection, cells were washed with ice-cold phosphate-buffered saline and harvested on ice as described previously (21). Protein samples were separated on a 7% SDS-polyacrylamide gel and transferred to a nitrocellulose membrane. Membranes were then analyzed by Western blot analysis. Changes in total protein level or phosphorylation were determined through densitometry using Adobe Photoshop and normalized for loading against actin or the nonphosphorylated protein as appropriate. The virus was generated as described previously (24).
Statistics
The characteristics of the outcomes were evaluated by visual inspection of histograms generated using Microsoft EXCEL, and the observed effects were evaluated by either one-way or multifactorial analysis of variance (ANOVA). Computations were performed using the ezANOVA program. Regression analysis was performed using Microsoft EXCEL. The data are presented as the means ± S.E.
RESULTS
Map4k4 Gene Silencing Enhances PPARγ Protein Expression at a Translational Step
We have previously shown that depletion of Map4k4/NIK enhances PPARγ expression in cultured adipocytes (11). To confirm the increase in PPARγ upon Map4k4 gene silencing, we examined the protein level of PPARγ in 3T3-L1 adipocytes upon siRNA-mediated depletion of Map4k4 mRNA (Fig. 1A). At 72 h post-transfection, cell lysates were prepared from either scrambled or Map4k4 siRNA-transfected 3T3-L1 adipocytes, and PPARγ protein levels were examined by SDS-PAGE and immunoblotting with PPARγ antibody. Map4k4 gene silencing resulted in a 2-fold increase in PPARγ1 as well as PPARγ2 protein levels (Fig. 1B), consistent with our previously published results (11). To determine whether the increase in the protein level is due to increased PPARγ transcription, RNA was isolated from similarly treated cells, and PPARγ as well as Map4k4 mRNA levels were compared using quantitative real time PCR. Map4k4 gene expression was decreased by about 80% (Fig. 1 D and E); however, the expression of PPARγ mRNA did not change upon Map4k4 gene silencing (Fig. 1C). These results suggest that Map4k4 regulation of PPARγ levels is mediated through increased translation and/or decreased degradation of PPARγ protein.
FIGURE 1.

Gene silencing of Map4k4 enhances PPARγ protein but not PPARγ mRNA in 3T3-L1 adipocytes. 3T3-L1 adipocytes 4 days post-differentiation induction were transfected with 7.5 nmol of either scrambled (Scr) or Map4k4 siRNA. 72 h later, cell lysates were examined by Western blot (A) and densitometry analysis for PPARγ1 and PPARγ2 (B). Total RNA was harvested and analyzed by quantitative real time PCR for PPARγ mRNA expression (C) and Map4k4 mRNA expression (E). D, Map4k4 protein expression. *, p < 0.01 when compared with scrambled siRNA-transfected samples by ANOVA (n = 4).
To test whether Map4k4 silencing decreased degradation of PPARγ protein, 3T3-L1 adipocytes were transfected with scrambled or Map4k4 siRNA and were then treated with 5 μg/ml of the protein synthesis inhibitor cycloheximide for the indicated times. Cell lysates were analyzed by SDS-PAGE and immunoblotting with anti-PPARγ antibody. As expected, initial PPARγ protein levels were enhanced with Map4k4 gene knockdown. In the absence of protein synthesis, we observed a rapid decrease in PPARγ protein levels with time (half-life 1.5–2 h) (10, 25) in scrambled as well as Map4k4 siRNA-treated conditions (Fig. 2A), indicating protein degradation. Densitometry (Fig. 2B) and regression analysis (supplemental Fig. S1) revealed that despite the higher initial level, Map4k4 gene silencing does not prolong the half-life of PPARγ proteins. These results show that the increase in PPARγ protein level is not due to decreased degradation upon Map4k4 gene knockdown. Rather, increased protein synthesis is the most likely mechanism for enhanced PPARγ protein levels.
FIGURE 2.

Depletion of Map4k4 does not prolong the half-life of PPARγ protein in 3T3-L1 adipocytes. 3T3-L1 adipocytes 4 days post-differentiation induction were transfected with 7.5 nmol of either scrambled (Scr) or Map4k4 siRNA. 72 h later, the cells were treated with 5 μg/ml cycloheximide for the indicated times. Cell lysates were examined by Western blot (A) and densitometry analysis (B) for PPARγ1 and PPARγ2. Densitometry is representative of three independent experiments.
Protein Synthesis and mTOR Activation Are Up-regulated upon Map4k4 Gene Silencing
To determine whether enhanced PPARγ protein levels with inhibition of Map4k4 expression is due to an increase in general protein synthesis, we exposed 3T3-L1 adipocytes for 1, 3, or 6 h to [35S]methionine after 72 h of scrambled or Map4k4 siRNA transfection. Total protein and RNA were harvested. Equal volumes of protein lysates were analyzed for 35S incorporation by scintillation counting, and counts were normalized to total DNA content analyzed in parallel. Map4k4 gene silencing resulted in about 30% higher protein synthesis as indicated by increased 35S incorporation at all time points tested (Fig. 3A). These results suggest that the increase in PPARγ protein levels after Map4k4 gene silencing is the result of increased protein synthesis. Thus, Map4k4 appears to suppress protein translation in cultured adipocytes.
FIGURE 3.

Map4k4 gene silencing enhances protein synthesis and mTOR phosphorylation. 3T3-L1 adipocytes were transfected with 7.5 nmol of either scrambled (Scr) or Map4k4 siRNA 4 days post-differentiation induction. 72 h later, [35S]Met/Cys protein labeling mix was added to cells for 1, 3, and 6 h. A, graphical representation of 35S incorporation as detected by a scintillation counter (n = 3). The counts/min from each knockdown condition were normalized to total DNA content of that sample. Cell lysates were examined for phospho-mTOR (Ser-2448) by Western blot (B) and densitometry analysis (C). D, model depicting possible mechanism of PPARγ translational regulation through mTOR. Densitometry and reverse transcription-PCR are representative of three independent experiments. **, p < 0.01, *, p < 0.05 when compared with scrambled siRNA-transfected samples by ANOVA.
We then sought to determine the pathways though which Map4k4 might modulate protein synthesis. mTOR is an evolutionarily conserved protein kinase that is a central component of the signaling mechanism regulating cell growth and proliferation by modulating protein synthesis (19). This is achieved by regulating phosphorylation of effectors of protein synthesis, including the mRNA translation repressor 4E-BP1 and the ribosomal S6 kinase S6K1 by inactivation and activation, respectively. Studies in rat skeletal muscle have suggested that modulation of Ser-2448 phosphorylation by upstream regulators of mTOR have an important role in the control of mTOR kinase activity and protein synthesis (26). We thus measured mTOR (Ser-2448) phosphorylation to test whether Map4k4 negatively regulates protein synthesis through modulation of the mTOR activation. 72 h after scrambled or Map4k4 siRNA transfection, cell lysates were analyzed by immunoblotting using phospho-mTOR (Ser-2448) antibody. Map4k4 gene silencing significantly enhanced basal mTOR phosphorylation without changing total mTOR levels (Fig. 3, B and C). These results suggest that Map4k4 could function as a negative regulator of mTOR activity via modulation of mTOR (Ser-2448) phosphorylation (Fig. 3D).
Map4k4 Depletion Enhances 4E-BP1 Phosphorylation
Because siRNA-mediated suppression of Map4k4 expression promotes activation of mTOR, we sought to examine whether downstream targets of mTOR involved in protein synthesis, such as 4E-BP1 and p70S6K1, were also affected by Map4k4 gene depletion. 4E-BP1 is a translational repressor protein that inhibits cap-dependent translation by binding to the eIF4e translation initiation factor (27). mTOR-mediated hyperphosphorylation of 4E-BP1 disrupts this interaction and results in activation of cap-dependent translation (18, 28). To determine whether Map4k4 gene silencing results in increased protein translation via enhanced 4E-BP1 phosphorylation, 3T3-L1 adipocytes were transfected with scrambled or Map4k4 siRNA, and then cell lysates were harvested and analyzed for changes in the phosphorylation state of 4E-BP1 protein by immunoblotting using phospho-4E-BP1 (Thr-36/45/69 and Ser-64) antibodies. As depicted in Fig. 4A, Map4k4 gene silencing enhanced 4E-BP1 phosphorylation at all sites tested. Depending on the extent of phosphorylation, 4E-BP1 migrates as three distinct bands, α (hypo-phosphorylated form), β, and γ (hyper-phosphorylated forms), on SDS-PAGE. Densitometry analyses revealed that there is a significant increase in the phosphorylation of sites that are responsible for the formation of slower migrating β as well as γ forms of 4E-BP1 upon Map4k4 gene silencing (Fig. 4B). We also examined other downstream targets of mTOR involved in the regulation of translation. S6K1 is another downstream effector of mTOR and is known to be the enzyme that phosphorylates ribosomal protein S6 (rpS6), a component of the small (40 S) ribosomal subunit (17). S6K1 Thr-389 phosphorylation by mTOR allows phosphorylation within the catalytic domain resulting in kinase activation (29). To test if Map4k4 gene silencing mediates changes in S6K1 phosphorylation, cell lysates from the above-mentioned experiment (as that in Fig. 4) were subjected to SDS-PAGE and immunoblot analysis. Surprisingly, Map4k4 gene silencing does not enhance S6K1 phosphorylation at Thr-389 (supplemental Fig. S2) despite the activation of mTOR. To test if Map4k4-mediated increases in PPARγ protein synthesis are due to regulation of other translation initiation factors, we also examined the changes in the phosphorylation of eIF2-α by SDS-PAGE and immunoblotting using phospho-eIF2-α antibody (Ser-51). There was no significant change in the phosphorylation state of eIF2-α (Ser-52 in mouse) upon Map4k4 gene silencing (supplemental Fig. S3). These results suggest that the mechanism whereby Map4k4 suppresses protein synthesis is primarily through down-regulation of mTOR and activation of 4E-BP1. Taken together, these results put forward a new mechanism of Map4k4-mediated regulation of PPARγ protein synthesis in an mTOR-dependent manner, through 4E-BP1.
FIGURE 4.

Map4k4 gene silencing in 3T3-L1 adipocytes enhances 4E-BP1 phosphorylation. 4 days post-differentiation induction, 3T3-L1 adipocytes were transfected with 7.5 nmol of either scrambled (Scr) or Map4k4 siRNA. 72 h later, cell lysates were examined for phospho-4E-BP1 (Thr-36/Thr-45) by Western blot (A) and densitometry analysis (B). *, p < 0.05 when compared with scrambled siRNA-transfected samples by ANOVA. Densitometry is representative of three independent experiments.
4E-BP1 and 4E-BP2 Are Required for Map4k4 Regulation of PPARγ Protein
4E-BP1 gene silencing should render eIF4e constitutively active, and hence protein synthesis should be enhanced. The eIF4e-binding protein exists in three isoforms 4E-BP1, 4E-BP2, and 4E-BP3. Isoforms 1 and 2 are well studied, and they share similar phosphorylation sites (30). To test if general protein synthesis is affected in the absence of 4E-BP1, we examined 35S incorporation in 3T3-L1 adipocytes after silencing 4E-BP1 and 4e-BP2. Scrambled or Map4k4 siRNA individual transfections were used as negative and positive controls, respectively. Total protein and RNA were harvested 72 h later. Equal volumes of protein were analyzed for 35S incorporation, using a scintillation counter. Global protein synthesis was found to be enhanced as reflected by significant increases in [35S]methionine incorporation, upon 4E-BP1 gene depletion (data not shown), similar to Map4k4 gene silencing.
To test if PPARγ protein synthesis is enhanced upon 4E-BP1 and 4E-BP2 gene silencing, cell lysates were analyzed for changes in PPARγ protein levels as well as efficiency of gene silencing of 4E-BP isoforms using SDS-PAGE and immunoblotting analysis. Map4k4 gene depletion resulted in significantly enhanced PPARγ1 as well as PPARγ2 protein levels as expected (Fig. 5A). Because 4E-BP1 is known to be a negative regulator of protein translation (31), phosphorylation of 4E-BP1 renders it inactive; silencing 4E-BP1 should mimic the hyperphosphorylated inactive state of 4E-BP1. Surprisingly, 4E-BP1 and 4E-BP2 knockdown did not result in an enhancement of either PPARγ1 or PPARγ2 protein levels as revealed by Western blot (Fig. 5A) and densitometry analysis (Fig. 5B).
FIGURE 5.
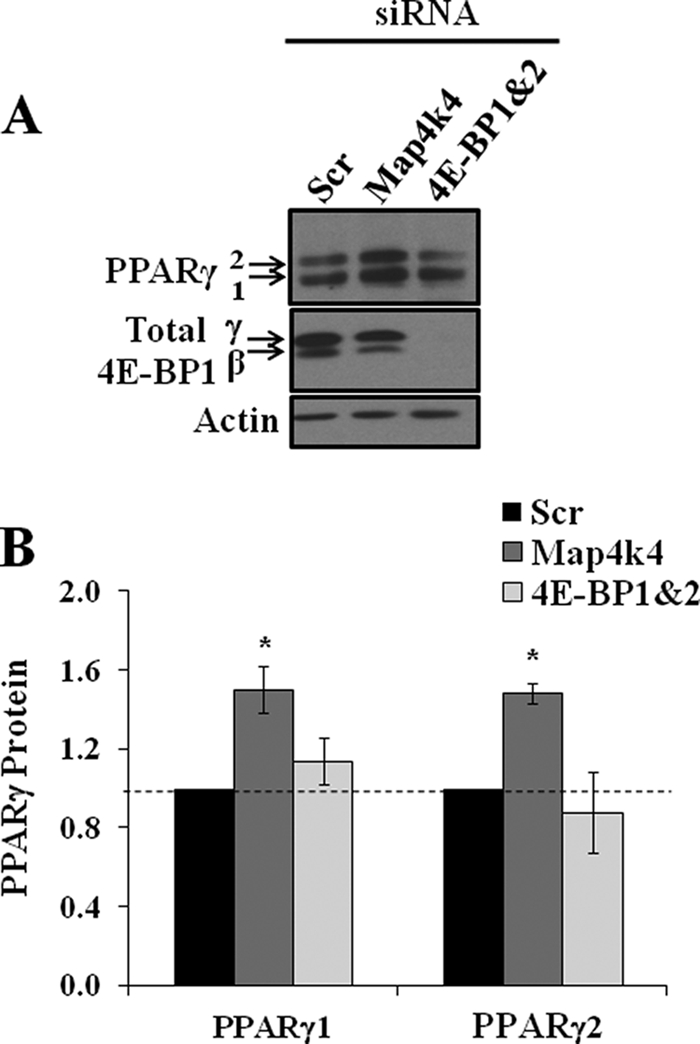
4E-BP1 and 4e-BP2 silencing does not enhance PPARγ protein level. 3T3-L1 adipocytes were transfected with 7.5 nmol of scrambled (Scr) or Map4k4 and 1.87 nmol of (each) 4E-BP1 and 4e-BP2 siRNA. 72 h later, cell lysates were examined for PPARγ protein levels as well as for efficiency of 4E-BP1 and 4e-BP2 gene silencing by SDS-PAGE followed by Western blot (A) and densitometry analysis (B). *, p < 0.05 when compared with scrambled siRNA transfected samples by ANOVA. Densitometry is representative of three independent experiments.
To determine whether expression of 4E-BP1 is necessary for the increase in PPARγ protein level mediated by Map4k4 silencing, a triple knockdown strategy using siRNA against Map4k4 together with 4E-BP1 and -2 was employed. 72 h after siRNA transfection, cell lysates were examined by Western blot (Fig. 6A), and densitometry analysis (Fig. 6B) for changes in PPARγ protein level. Map4k4 siRNA treatment caused an enhancement in PPARγ protein level as seen in Fig. 1A. Furthermore, the triple knockdown resulted in no enhancement of PPARγ protein level; additionally, enhancement in PPARγ protein level in response to Map4k4 silencing is attenuated in the absence of 4E-BP1 and 4E-BP2. These results suggest an important role for 4E-BP1 and 4E-BP2 in Map4k4 signaling in this pathway.
FIGURE 6.

4E-BP1 and 4e-BP2 are required for increased PPARγ protein levels upon Map4k4 gene silencing. 3T3-L1 adipocytes were transfected with 7.5 nmol of either scrambled (Scr) or Map4k4 and 1.87 nmol of 4E-BP1 and 4e-BP2 siRNA. 72 h later cell lysates were examined for PPARγ protein levels by Western blot (A) and densitometry analysis (B). *, p < 0.01 when compared with scrambled siRNA transfected samples by ANOVA. Densitometry is representative of three independent experiments.
Up-regulation of PPARγ Level upon Map4k4 Depletion Is Suppressed by mTOR Inhibition
As phosphorylation of mTOR as well as 4E-BP1 is enhanced upon Map4k4 knockdown, we tested to see if this increase in 4E-BP1 phosphorylation is mediated by mTOR. Rapamycin is known to be a potent inhibitor of mTOR function (32) and should result in dephosphorylation and activation of 4E-BP1. We thus treated 3T3-L1 adipocytes with 20 nm rapamycin for the indicated times, beginning 72 h after transfection with scrambled or Map4k4 siRNA. Cell lysates were analyzed by SDS-PAGE and immunoblotting using the respective antibodies (Fig. 7A). Phosphorylation of mTOR (Ser-2448) as well as 4E-BP1 (at Thr-69, Ser-64, and Thr-36/45) was enhanced upon Map4k4 gene silencing as expected, and both PPARγ1 and PPARγ2 protein levels were found to be increased. In the scrambled siRNA-transfected cells (control), treatment with rapamycin resulted in dephosphorylation of 4E-BP1 at all the phosphorylation sites tested in a time-dependent manner. Similarly, rapamycin-induced 4E-BP1 dephosphorylation (in all the sites tested) was not prevented in Map4k4 silenced cells (Fig. 7B). At the same time, PPARγ1 and PPARγ2 protein levels showed a significant decrease in expression upon rapamycin treatment in a time-dependent manner (Fig. 7B). These results are consistent with the hypothesis that enhanced 4E-BP1 phosphorylation that is observed upon Map4k4 gene silencing is mediated through an mTOR-dependent mechanism that regulates PPARγ protein synthesis.
FIGURE 7.

Rapamycin inhibits Map4k4 regulation of 4E-BP1 phosphorylation and PPARγ expression. 3T3-L1 adipocytes 4 days post-differentiation induction were transfected with 7.5 nmol of either scrambled (Scr) or Map4k4 siRNA. 72 h later, cells were treated with 20 nm of rapamycin for 0.5, 1, or 2 h. Cell lysates were examined for the appearance of the hypophosphorylated form (4E-BP1α), and changes in the phosphorylation levels of 4E-BP1 at Ser-64, Thr-69, and Thr-36/45 were analyzed using appropriate antibodies by Western blot (A) (representative blots) and densitometry (B) analysis (n = 5). *, p < 0.05 when compared with scrambled siRNA transfected samples by ANOVA.
Enhanced Cell Size upon Map4k4 Gene Silencing in 3T3-L1 Adipocytes
mTOR is known to be a central regulator of cell growth (33). To determine whether up-regulation of mTOR activity upon Map4k4 gene silencing affected cell growth, we measured the changes in cell size upon siRNA-mediated knockdown of these genes in 3T3-L1 adipocytes. After transfection of adipocytes with scrambled or specific siRNAs, bright field cell images were collected, and cell size was analyzed by measuring the circumference of 150 randomly chosen cells. Cell size was found to be significantly enhanced upon Map4k4 gene silencing (supplemental Fig. S4), consistent with increased growth as a result of increased mTOR activity.
Adenovirus-mediated Map4k4 Overexpression Decreases mTOR Phosphorylation Levels as well as PPARγ Protein
Because siRNA-mediated suppression of Map4k4 expression enhanced PPARγ expression, as well as promoted activation of mTOR in cultured adipocytes, we hypothesized that transgenic expression of Map4k4 would have the opposite effect. To test this, 72 h post-infection, cell lysates were prepared from either control adenovirus (Ad-control) or Map4k4 adenovirus (Ad-Map4k4) (3HA-Map4k4-HA)-infected 3T3-L1 adipocytes. We first assessed the level of Map4k4 evoked by adenovirus-mediated gene transfer. Analysis of cell lysates harvested from cells infected with the Map4k4 adenoviral vector (Ad-Map4k4) revealed efficient production of the 150-kDa protein. The protein level of Map4k4 was examined using both anti-Map4k4 and HA antibody by SDS-PAGE and immunoblotting (Fig. 8A). Increases in Map4k4 expression with higher multiplicities of infection (data not shown) were observed. PPARγ protein levels and mTOR phosphorylation at Ser-2448 were examined by Western blot analysis with PPARγ and phospho-mTOR antibody, respectively. Adenovirus-mediated expression of Map4k4 resulted in a modest but significant decrease in PPARγ1 as well as PPARγ2 protein levels (Fig. 8, A and B) without any change in the mRNA (data not shown). At the same time, there was also a diminished basal mTOR phosphorylation at Ser-2248, although total mTOR levels were unchanged (Fig. 8A). These results support the hypothesis that Map4k4 could function as a negative regulator of mTOR activity toward PPARγ protein synthesis via modulation of mTOR (Ser-2448) phosphorylation.
FIGURE 8.

Adenovirus-mediated overexpression of Map4k4 decreases PPARγ protein level as well as mTOR (Ser-2448) phosphorylation in 3T3-L1 adipocytes. 4 days post-differentiation induction, 3T3-L1 adipocytes were infected with 40 μl (1.4 × 10¹² particles/ml) of either HA control (Ad-control) or 3HA-Map4k4-HA (Ad-Map4k4) adenovirus. 72 h post-infection, cell lysates were examined for PPARγ protein levels as well as Map4k4, HA, phospho-mTOR (Ser-2448), and total mTOR by Western blot (A) (representative blots) and densitometry (B) analysis (n = 4). *, p = 0.05 when compared with control adenovirus infected samples by ANOVA.
DISCUSSION
mTOR plays a central role in mediating responses to many stimuli such as nutrients, hormones, and stress that result in the regulation of multiple cellular processes involved in cell growth and metabolism, including amino acid and protein biosynthesis and glucose homeostasis (33). Treatment with rapamycin, a specific inhibitor of mTOR, has been shown to prevent adipocyte differentiation and lipid accumulation (34). Although mTOR-mediated regulation of adipogenesis is not clearly understood, one mechanism could be through regulation of PPARγ, because its activity was attenuated by rapamycin treatment (34). mTOR is also known as an important regulator of protein synthesis by mediating activation or inhibition of several downstream translation initiation and elongation factors directly or indirectly through changing their phosphorylation state (35). The role of mTOR in regulating PPARγ protein synthesis has not previously been addressed. In this study, we show that Map4k4, a Ste20 serine/threonine protein kinase, regulates PPARγ protein expression in 3T3-L1 adipocytes, by a post-transcriptional mechanism via mTOR-mediated regulation of the 4E-BP1 initiation factor.
The specificity of the effect of Map4k4 silencing to up-regulate protein expression is not limited to PPARγ. Fig. 3A shows that there is a small but significant effect on incorporation of labeled amino acid into total protein in response to Map4k4 depletion, indicating that many proteins are up-regulated in addition to PPARγ. These may include proteins affected through direct mTOR-dependent modulation of translation (e.g. PPARγ), as well as proteins downstream of such transcription factors. Our previously published data (11) also showed a significant increase in protein expression of adipogenic genes like CCAAT/enhancer-binding protein α and CAAT/enhancer-binding protein β and Glut4 (insulin-responsive facilitated glucose transporter isoform 4), upon siRNA-mediated Map4k4 gene silencing. We have analyzed the mRNA levels of some additional genes known to be transcriptionally controlled by PPARγ, and we find that several are indeed also increased by Map4k4 knockdown. These include phosphoenolpyruvate carboxykinase, acetyl-CoA acyltransferase, and monoglyceride lipase (data not shown). However, other PPARγ-responsive and adipocyte-specific genes such as aP2 (or Fabp4, fatty acid-binding protein 4), adipsin, adiponectin, and leptin, which we analyzed by reverse transcription-PCR as well as immunoblotting, are not apparently affected by Map4k4 silencing in mature adipocytes (data not shown). The basis of this differential effect of Map4k4 knockdown on some PPARγ-responsive genes and not others is interesting but unknown.
Our overall findings are summarized in Fig. 9. Inhibition of Map4k4 expression results in an enhanced phosphorylation of mTOR as well as 4E-BP1. Inactivation by phosphorylation of 4E-BP1 results in an increase in PPARγ protein synthesis (Fig. 9). Active mTOR phosphorylates 4E-BP1 leading to the dissociation of the eIF4e-4E-BP1 complex (35). Therefore, stimulating mTOR activity could result in enhanced protein synthesis. Our finding of enhanced mTOR (Ser-2448) phosphorylation (Fig. 3) upon Map4k4 depletion could mean increased mTOR kinase activity, but whether phosphorylation of mTOR at Ser-2448 reflects its kinase activity is debatable (36). However, 4E-BP1 was not protected from dephosphorylation upon rapamycin treatment in Map4k4-depleted conditions (Fig. 9A) supporting the idea that knockdown of Map4k4 enhances kinase activity of mTOR in the absence of the inhibitor. How this elevated activity of mTOR occurs in Map4k4 knockdown conditions remains to be answered. The effect of Map4k4 gene silencing on activation of mTOR to regulate 4E-BP1 appears to be downstream to Akt in the insulin signaling pathway, as Akt phosphorylation is not affected upon Map4k4 depletion (11). Additionally, mTOR-mediated 4E-BP1 regulation appears to be distinct from S6K1 (the other well known mTOR substrate) regulation, because Map4k4 gene silencing did not affect basal phosphorylation of S6K1 (supplemental Fig. S2). These results are consistent with published data showing outputs from mTOR to 4E-BP1 and S6K1 to be distinct (37). Further work is required to address the question of how activation of mTOR is achieved upon Map4k4 gene silencing.
FIGURE 9.
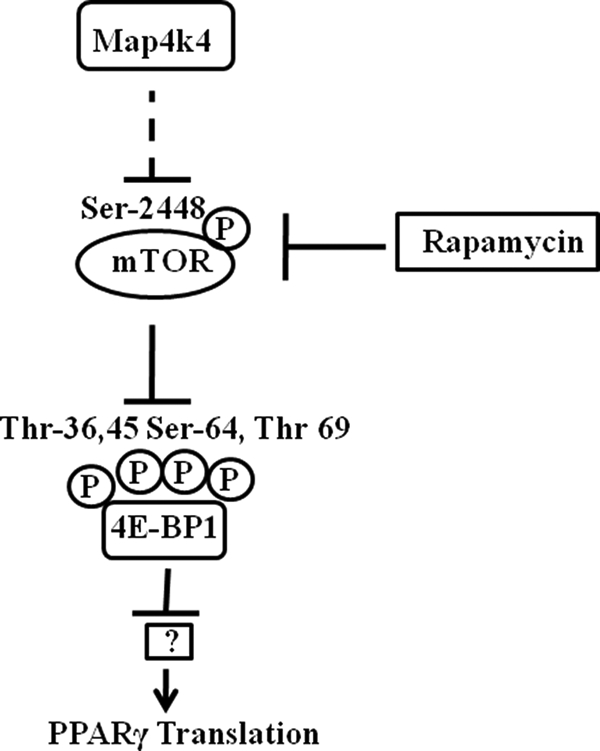
Model for Map4k4-mediated PPARγ protein regulation. Our data support the following hypothesis. Silencing Map4k4 in 3T3-L1 adipocytes using siRNA enhances mTOR activity, as indicated by an increase in phosphorylation at Ser-2448. This in turn inhibits 4E-BP1 activity by enhancing phosphorylation at Thr-36, Thr-45, Ser-64, and Thr-69. Phosphorylation of 4E-BP1 renders it inactive leading to its dissociation from the translational initiation factor eIF4E. Thus eIF4E is activated, and cap-dependent translational initiation, responsible for the increase in PPARγ protein levels, is enhanced. However, 4E-BP1 silencing alone does not mimic Map4k4 depletion but blocks the Map4k4 effect, indicating it plays an additional role in regulation of PPARγ protein expression.
Additionally, upon depletion of Map4k4, the increase in basal mTOR phosphorylation at Ser-2448, as well as enhanced 4E-BP1 phosphorylation, suggests the presence of an additional player upstream of mTOR. Alternatively, a component could be functioning in a complex with mTOR to regulate 4E-BP1 phosphorylation and mTOR kinase activity thereby enhancing PPARγ protein synthesis.
Our result shows a decrease in PPARγ protein level concomitant with diminished mTOR phosphorylation at Ser-2448 upon adenovirus-mediated transgenic expression of Map4k4. This result supports the hypothesis that Map4k4 is a negative regulator of PPARγ protein translation by suppressing phosphorylation of mTOR. However, a detailed analysis of the molecular mechanism involving the regulation of mTOR phosphorylation by Map4k4 either directly, by means of downstream substrates, or by interacting partners will be necessary to better understand PPARγ translational regulation. In summary, this study shows that Map4k4 regulation of PPARγ protein is a post-transcriptional mechanism that is coupled to mTOR signaling through regulation of 4E-BP1. Furthermore, 4E-BP1 is necessary for enhancement in the PPARγ protein upon Map4k4 depletion. Addressing this novel role of 4E-BP1 in PPARγ protein regulation may reveal new insights into post-transcriptional regulation of gene expression. Considering the central role played by PPARγ in regulating whole body metabolism and insulin sensitivity, its regulation by Map4k4 may have important physiological implications.
Supplementary Material
Acknowledgments
We thank Dr. Joseph V. Virbasius for help with manuscript preparation. We thank the University of Massachusetts Medical School Gene Therapy Core of the Diabetes and Endocrinology Research Center (supported by National Institutes of Health Grant DK032520) for generating the adenovirus.
This work was supported, in whole or in part, by National Institutes of Health Grants DK30898-25 and DK030638-25 (to M. P. C.).

The on-line version of this article (available at http://www.jbc.org) contains supplemental Figs. S1–S5.
- PPARγ
- peroxisome proliferator-activated receptor γ
- siRNA
- small interfering RNA
- ANOVA
- analysis of variance
- mTOR
- mammalian target of rapamycin
- HA
- hemagglutinin.
REFERENCES
- 1.Kershaw E. E., Flier J. S. (2004) J. Clin. Endocrinol. Metab. 89, 2548–2556 [DOI] [PubMed] [Google Scholar]
- 2.Rosen E. D., Spiegelman B. M. (2006) Nature 444, 847–853 [DOI] [PMC free article] [PubMed] [Google Scholar]
- 3.Tontonoz P., Hu E., Spiegelman B. M. (1994) Cell 79, 1147–1156 [DOI] [PubMed] [Google Scholar]
- 4.Vidal-Puig A. J., Considine R. V., Jimenez-Liñan M., Werman A., Pories W. J., Caro J. F., Flier J. S. (1997) J. Clin. Invest. 99, 2416–2422 [DOI] [PMC free article] [PubMed] [Google Scholar]
- 5.Chawla A., Repa J. J., Evans R. M., Mangelsdorf D. J. (2001) Science 294, 1866–1870 [DOI] [PubMed] [Google Scholar]
- 6.Zhang B., Berger J., Hu E., Szalkowski D., White-Carrington S., Spiegelman B. M., Moller D. E. (1996) Mol. Endocrinol. 10, 1457–1466 [DOI] [PubMed] [Google Scholar]
- 7.Stephens J. M., Lee J., Pilch P. F. (1997) J. Biol. Chem. 272, 971–976 [DOI] [PubMed] [Google Scholar]
- 8.Ruan H., Hacohen N., Golub T. R., Van Parijs L., Lodish H. F. (2002) Diabetes 51, 1319–1336 [DOI] [PubMed] [Google Scholar]
- 9.Hauser S., Adelmant G., Sarraf P., Wright H. M., Mueller E., Spiegelman B. M. (2000) J. Biol. Chem. 275, 18527–18533 [DOI] [PubMed] [Google Scholar]
- 10.Floyd Z. E., Stephens J. M. (2002) J. Biol. Chem. 277, 4062–4068 [DOI] [PubMed] [Google Scholar]
- 11.Tang X., Guilherme A., Chakladar A., Powelka A. M., Konda S., Virbasius J. V., Nicoloro S. M., Straubhaar J., Czech M. P. (2006) Proc. Natl. Acad. Sci. U.S.A. 103, 2087–2092 [DOI] [PMC free article] [PubMed] [Google Scholar]
- 12.Yao Z., Zhou G., Wang X. S., Brown A., Diener K., Gan H., Tan T. H. (1999) J. Biol. Chem. 274, 2118–2125 [DOI] [PubMed] [Google Scholar]
- 13.Tesz G. J., Guilherme A., Guntur K. V., Hubbard A. C., Tang X., Chawla A., Czech M. P. (2007) J. Biol. Chem. 282, 19302–19312 [DOI] [PubMed] [Google Scholar]
- 14.Hotamisligil G. S., Arner P., Caro J. F., Atkinson R. L., Spiegelman B. M. (1995) J. Clin. Invest. 95, 2409–2415 [DOI] [PMC free article] [PubMed] [Google Scholar]
- 15.Chinenov Y., Kerppola T. K. (2001) Oncogene 20, 2438–2452 [DOI] [PubMed] [Google Scholar]
- 16.Pestova T. V., Kolupaeva V. G., Lomakin I. B., Pilipenko E. V., Shatsky I. N., Agol V. I., Hellen C. U. (2001) Proc. Natl. Acad. Sci. U.S.A. 98, 7029–7036 [DOI] [PMC free article] [PubMed] [Google Scholar]
- 17.Preiss T., Hentze M. W. (2003) BioEssays 25, 1201–1211 [DOI] [PubMed] [Google Scholar]
- 18.Gingras A. C., Raught B., Sonenberg N. (1999) Annu. Rev. Biochem. 68, 913–963 [DOI] [PubMed] [Google Scholar]
- 19.Hay N., Sonenberg N. (2004) Genes Dev. 18, 1926–1945 [DOI] [PubMed] [Google Scholar]
- 20.Jiang Z. Y., Zhou Q. L., Coleman K. A., Chouinard M., Boese Q., Czech M. P. (2003) Proc. Natl. Acad. Sci. U.S.A. 100, 7569–7574 [DOI] [PMC free article] [PubMed] [Google Scholar]
- 21.Bose A., Guilherme A., Robida S. I., Nicoloro S. M., Zhou Q. L., Jiang Z. Y., Pomerleau D. P., Czech M. P. (2002) Nature 420, 821–824 [DOI] [PubMed] [Google Scholar]
- 22.Wang X., Seed B. (2003) Nucleic Acids Res. 31, e154. [DOI] [PMC free article] [PubMed] [Google Scholar]
- 23.Livak K. J., Schmittgen T. D. (2001) Methods 25, 402–408 [DOI] [PubMed] [Google Scholar]
- 24.Gao G., Zhou X., Alvira M. R., Tran P., Marsh J., Lynd K., Xiao W., Wilson J. M. (2003) Gene Ther. 10, 1926–1930 [DOI] [PubMed] [Google Scholar]
- 25.Christianson J. L., Nicoloro S., Straubhaar J., Czech M. P. (2008) J. Biol. Chem. 283, 2906–2916 [DOI] [PubMed] [Google Scholar]
- 26.Reynolds T. H., 4th, Bodine S. C., Lawrence J. C., Jr. (2002) J. Biol. Chem. 277, 17657–17662 [DOI] [PubMed] [Google Scholar]
- 27.Lin T. A., Kong X., Saltiel A. R., Blackshear P. J., Lawrence J. C., Jr. (1995) J. Biol. Chem. 270, 18531–18538 [DOI] [PubMed] [Google Scholar]
- 28.Lin T. A., Kong X., Haystead T. A., Pause A., Belsham G., Sonenberg N., Lawrence J. C., Jr. (1994) Science 266, 653–656 [DOI] [PubMed] [Google Scholar]
- 29.Murakami M., Ichisaka T., Maeda M., Oshiro N., Hara K., Edenhofer F., Kiyama H., Yonezawa K., Yamanaka S. (2004) Mol. Cell. Biol. 24, 6710–6718 [DOI] [PMC free article] [PubMed] [Google Scholar]
- 30.Lin T. A., Lawrence J. C., Jr. (1996) J. Biol. Chem. 271, 30199–30204 [DOI] [PubMed] [Google Scholar]
- 31.Pause A., Belsham G. J., Gingras A. C., Donzé O., Lin T. A., Lawrence J. C., Jr., Sonenberg N. (1994) Nature 371, 762–767 [DOI] [PubMed] [Google Scholar]
- 32.Dumont F. J., Su Q. (1996) Life Sci. 58, 373–395 [DOI] [PubMed] [Google Scholar]
- 33.Wullschleger S., Loewith R., Hall M. N. (2006) Cell 124, 471–484 [DOI] [PubMed] [Google Scholar]
- 34.Kim J. E., Chen J. (2004) Diabetes 53, 2748–2756 [DOI] [PubMed] [Google Scholar]
- 35.Wang X., Proud C. G. (2006) Physiology 21, 362–369 [DOI] [PubMed] [Google Scholar]
- 36.Mothe-Satney I., Gautier N., Hinault C., Lawrence J. C., Jr., Van Obberghen E. (2004) J. Biol. Chem. 279, 42628–42637 [DOI] [PubMed] [Google Scholar]
- 37.Wang X., Beugnet A., Murakami M., Yamanaka S., Proud C. G. (2005) Mol. Cell. Biol. 25, 2558–2572 [DOI] [PMC free article] [PubMed] [Google Scholar]
Associated Data
This section collects any data citations, data availability statements, or supplementary materials included in this article.