Abstract
Identifying biologically useful genes from massive gene expression data is a critical issue in DNA microarray data analysis. Recent studies on gene module discovery have shown a substantial effect on identifying transcriptional regulatory networks involved in complex diseases for different sample subsets. These have targeted a single disease class, but discovering discriminative modules in different classes has remained to be addressed. In this paper, we propose a novel method that can discover differentially expressed gene modules from two-class DNA microarray data. The proposed method is applied to breast cancer and leukemia datasets, and the biological functions of the extracted modules are evaluated by functional enrichment analysis. As a result, we show that our method can extract genes well reflecting known biological functions compared to a traditional t-test-based approach.
Keywords: DNA, microarray, gene expression, two-class
Background
DNA microarray technology has enabled us to measure expression levels of thousands of genes simultaneously under certain condition and has yielded various biological applications such as functional analysis of genes or identification of up- and down-expressed genes in complex diseases like cancer. An important step of microarray data analysis is to identify groups of genes showing similar expression patterns across multiple samples (e.g., normal/disease cells) in a gene expression dataset. Although traditional clustering algorithms like hierarchical clustering provide natural solutions to this problem, these are constrained by the limitation that all dimensions of samples are used to compare pair of genes even if those genes actually exhibit relevance only in a subset of samples.
On the other hand, a new clustering technique called biclustering has focused on finding gene expression modules (“modules” for short) with locally similar expression pattern across a subset of samples in a gene expression dataset [1–6]. A module is defined as a subset of genes with a common expression pattern across a subset of samples. We previously developed an exhaustive and efficient biclustering algorithm (BiModule) for module search, and reported that it shows the highest enrichment of gene function sets as well as the fastest running time among salient algorithms in yeast dataset and human cell/tissue dataset [6].
So far, existing module search methods including BiModule have targeted single class dataset, but there has been no application to multiple classes. We expect that such extension can be useful for identifying genetic subtypes of medically similar but different disease classes as well as for screening for biomarker candidates. In this paper, we propose a novel method that discovers differentially expressed modules between different two classes in gene expression dataset. The major contribution of this paper is to provide a new module ranking approach based on specificity score (“specificity” for short) that represents the discriminative powers in two classes, and verify the usefulness of the method. In this study, our method is applied to two public cancer datasets, and its performance is evaluated through functional enrichment analysis for obtained discriminative modules and comparison with the traditional t-test-based approach.
Methodology
We search for modules separately from respective classes by using a biclustering method and then extract discriminative modules based on their specificity scores.
Module extraction by biclustering
In this study, BiModule [6] is utilized to extract modules from each class. Typically, biclustering requires high computational complexity due to combinatorial searches for both of genes and samples, whereas BiModule can search for maximal modules exhaustively from normalized and discretized expression data in real time by using a closed itemset mining algorithm called LCM [7]. This tool requires the number of the discretization bins and the minimum size of modules as the input parameters. In this study, we use 7 as the discretization bins, and specify 10 genes and 4 samples as the minimum size of modules.
Module ranking by the specificities
As the candidates of discriminative modules, we pick up only the constant modules in which discretized values all have an identical sign. Here we define the specificity score that represents the discrimination power between the classes. The specificities of the constant modules are calculated in each class separately. Hereinafter the targeting class and another class are respectively referred to as class A and class B, where the targeting class means the class in which the specificity calculations are performed. Now, we consider calculating the specificity of a constant module X in class A. First, in class B, we enumerate all combinations of modules Yi (i=1,2,..,c) in the same genes and the same size of samples as the module X. Next the specificity of the module X is calculated by the expression in equation 1 (see supplementary material)
Discussion
Experiments
To evaluate the usefulness of our method, we use the two-class gene expression datasets: breast cancer [8] and leukemia [9]. The breast cancer dataset includes gene expression values for 7,129 genes in samples of 25 positive and 24 negative statuses. The leukemia dataset is composed of gene expression values for 12,582 genes in 24 ALL (Acute Lymphocytic leukemia) samples and 28 AML (Acute Myeloid Leukemia) samples.
We evaluate if the genes composing each discriminative module (called “module genes” below) reflect properly known biological functions. In this study, the functions of module genes are identified by using a functional enrichment analysis tool called GeneCoDis [10]. GeneCoDis provides a statistical probability (p-value) that a certain biological function occurs x-times by chance in a given list of genes. This tool enables functional analyses in terms of the various biological themes. In this paper, we test on the following four themes: Gene Ontology biological function annotations (GO), KEGG molecular interaction annotations (KEGG), InterPro Motif annotations (IPM) and transcription factors from TransFAC (TF).
Module ranking and biological functions
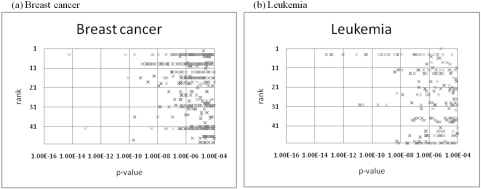
To examine correlation between the module ranking and the biological functions, we use the top 50 discriminative modules in descending order of the specificities, and conduct functional enrichment analyses for each discriminative module. Subsequently, we generate the pvalues of statistically over-represented functions in those modules. Figure 1 shows the p-values judged to be significant functions (p less than 0.0001) in the respective rank orders for the breast cancer (Figure 1a) and leukemia datasets (Figure 1b), where the p-values for the four biological themes are plotted all together. From these two figures, we can see that discriminative modules with larger specificities are characterized by more significant functions. This result suggests that our scoring method reflects successfully the functional enrichments of the discriminative modules.
Figure 1.
Correlation between the specificity scores vs. module ranking
Comparison with the t-test-based approach
In addition, we compare our method with the t-test-based approach (called t-test approach below) that has been widely used in differentially expressed gene analysis. The t-test approach used here consists of the following steps; first, t-test is applied to each gene separately, and only genes with smaller p-values than a certain significant level are selected. Next, these selected genes are grouped into gene clusters showing similar expression patterns by using a hierarchical clustering. After that, we utilize the cluster boundary discovery tool ASIAN [11] to obtain the optimal cluster separation. Finally, functional enrichment analysis for each cluster is conducted by GeneCoDis.
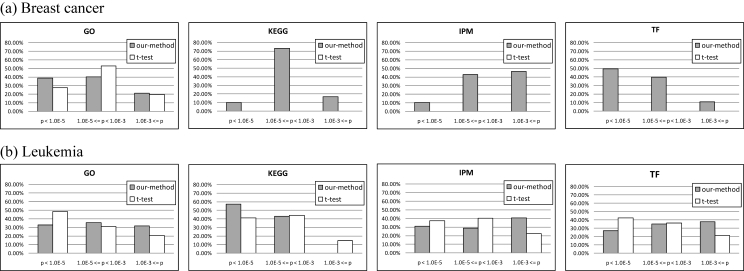
The significant functions of discriminative modules are compared to those of the clusters generated by the t-test approach. The comparison test is performed using the relative frequency distributions of p-values for the four biological themes. Figure 2 shows the results for breast cancer (Figure 2a) and leukemia datasets (Figure 2b), where the gray bar and the white bar show the results for our method and the t-test approach, respectively. In the breast cancer dataset (Figure 2a), our method shows significant functions in all of the themes. In contrast, the t-test approach presents no significant functions except for GO. As for the leukemia dataset (Figure 2b), although the both of two approaches exhibit significant functions in all themes, we cannot see obvious differences between them. However, from these two figures, we can see that our method shows better results than the t-test approach in the KEGG functions. Namely, this suggests that our method outperforms the t-test approach in the ability of finding unknown genetic pathways of the actual living cells.
Figure 2.
Relative frequency distribution of p-value in four biological themes
Conclusion
In this paper, we proposed a new method for extracting differentially expressed gene modules from two-class gene expression dataset and applied it to the breast cancer and leukemia datasets. The results of functional enrichment analysis revealed that the discriminative modules show significantly over-represented biological functions at the multiple genetic levels compared to clusters generated by the traditional t-test approach. From these results, we conclude that our method would become a promising approach for not only discovering differentially expressed gene sets in different classes but also identifying candidates of gene biomarkers in intractable diseases like cancer.
However, in this paper, we have not provided any valid criteria for the threshold of specificities. Thus the top 50 discriminative modules used in this study might include indifferent modules. In the future work, we will develop a method to detect automatically the valid threshold for specificity. In addition, we will extend the method to a new classification approach based on the discriminative modules.
Supplementary material
Acknowledgments
This work was supported by Grant-in-Aid for Young Scientists (B) No.21700233 from MEXT Japan and A Research for Promoting Technological Seeds from JSTA.
Footnotes
Citation:Okada & Inoue , Bioinformation 4(4): 134-137 (2009)
References
- 1.Cheng Y, Church G. Proc Int Conf Intell Syst Mol Biol. 2000 [PubMed] [Google Scholar]
- 2.Tanay A, et al. Bioinformatics. 2002;18:S136. doi: 10.1093/bioinformatics/18.suppl_1.s136. [DOI] [PubMed] [Google Scholar]
- 3.Ben-Dor A, et al. J Comput Biol. 2003;10:373. doi: 10.1089/10665270360688075. [DOI] [PubMed] [Google Scholar]
- 4.Ihmels J, et al. Bioinformatics. 2004;20:1993. doi: 10.1093/bioinformatics/bth166. [DOI] [PubMed] [Google Scholar]
- 5.Prelic A, et al. Bioinformatics. 2006;22:1122. doi: 10.1093/bioinformatics/btl060. [DOI] [PubMed] [Google Scholar]
- 6.Okada Y, et al. IPSJ Trans on Bioinformatics. 2007;48:39. [Google Scholar]
- 7.Uno T, et al. Proc of the 1st Int. Workshop on Open Source Data Mining: Frequent Pattern Mining Implementations; 2005. [Google Scholar]
- 8.West M, et al. Proc Natl Acad Sci USA. 2001;98:11462. doi: 10.1073/pnas.201162998. [DOI] [PMC free article] [PubMed] [Google Scholar]
- 9.Armstrong SA, et al. Nat Genet. 2002;30:41. doi: 10.1038/ng765. [DOI] [PubMed] [Google Scholar]
- 10.Carmona-Saez P, et al. Genome Biology. 2007;8:R3. doi: 10.1186/gb-2007-8-1-r3. [DOI] [PMC free article] [PubMed] [Google Scholar]
- 11.Horimoto K, Toh H. Bioinformatics. 2001;17:1143. doi: 10.1093/bioinformatics/17.12.1143. [DOI] [PubMed] [Google Scholar]
Associated Data
This section collects any data citations, data availability statements, or supplementary materials included in this article.


