

Abstract
Background
The objective of this study was to understand the level of performance of blood glucose monitors as assessed in the published literature.
Methods
Medline from January 2000 to October 2009 and reference lists of included articles were searched to identify eligible studies. Key information was abstracted from eligible studies: blood glucose meters tested, blood sample, meter operators, setting, sample of people (number, diabetes type, age, sex, and race), duration of diabetes, years using a glucose meter, insulin use, recommendations followed, performance evaluation measures, and specific factors affecting the accuracy evaluation of blood glucose monitors.
Results
Thirty-one articles were included in this review. Articles were categorized as review articles of blood glucose accuracy (6 articles), original studies that reported the performance of blood glucose meters in laboratory settings (14 articles) or clinical settings (9 articles), and simulation studies (2 articles). A variety of performance evaluation measures were used in the studies. The authors did not identify any studies that demonstrated a difference in clinical outcomes. Examples of analytical tools used in the description of accuracy (e.g., correlation coefficient, linear regression equations, and International Organization for Standardization standards) and how these traditional measures can complicate the achievement of target blood glucose levels for the patient were presented. The benefits of using error grid analysis to quantify the clinical accuracy of patient-determined blood glucose values were discussed.
Conclusions
When examining blood glucose monitor performance in the real world, it is important to consider if an improvement in analytical accuracy would lead to improved clinical outcomes for patients. There are several examples of how analytical tools used in the description of self-monitoring of blood glucose accuracy could be irrelevant to treatment decisions.
Keywords: diabetes mellitus, glucose, glycemic control, laboratory techniques and procedures, point of care
Introduction
When performed and utilized properly, monitoring of blood glucose (BG) permits people with diabetes to determine their BG level and use the information as part of their treatment program. The overall performance of self-monitoring of blood glucose (SMBG) systems is a combination of the analytical performance of the instrument, quality of the test strips, and proficiency of the user. Considerations for improving the accuracy of glucose monitoring systems emphasize technical improvements and improved patient education to decrease user error.1 The term “accuracy” as applied to analytical performance is defined by the International Organization for Standardization (ISO) as “the difference between the expectation of measurement results and the true value of the measured quantity.” In essence, it is a measure of the difference between obtained results (by the blood glucose monitor) and the true value (determined by an accepted reference method). To our knowledge, an internationally accepted reference method for the determination of whole BG concentration does not exist. There is currently a lack of consensus on the performance standards for blood glucose monitors and whether target values of an expanded ISO 15197 standard would be appropriate.
The authors undertook an analysis of the literature to understand the performance of blood glucose monitors in the real world. This article reports on the review of the published literature to provide information on current blood glucose monitor performance. Also discussed are differences between what level of accuracy is needed for appropriate analytical performance and appropriate clinical performance and why different settings might require different levels of accuracy.
Methods
Data Sources
Medline (January 2000–October 2009) was searched for eligible articles using combinations of the following search terms: (1) diabetes mellitus, or type 1 diabetes mellitus, or type 2 diabetes mellitus; (2) blood chemical analysis, or blood glucose, or blood glucose self-monitoring, or point-of-care systems; (3) calibration, or laboratory techniques and procedures, or quality control, or reference standards, or reference values, or reproducibility of results; and (4) humans. The reference lists of included studies were also searched.
Study Selection and Data Extraction
Titles and abstracts of identified citations were screened, and articles were identified as eligible based on the following criteria. Inclusion criteria were review articles of BG accuracy, original articles that reported the performance of blood glucose meters in laboratory settings, original articles that reported the performance of blood glucose meters in clinical settings, and simulation modeling of BG. The following information was collected from eligible articles for each of the categories: (1) review articles of blood glucose accuracy—specific factors affecting the accuracy evaluation of blood glucose monitors; (2) original articles that reported the performance of blood glucose meters in laboratory settings—blood glucose meters tested, blood sample, meter operators, and performance evaluation measures; (3) original articles that reported the performance of blood glucose meters in clinical settings—blood glucose meters tested, setting, sample (number, diabetes type, age, sex, and race), duration of diabetes, years using a glucose meter, insulin use, recommendations followed, and performance evaluation measures; and (4) simulation modeling of blood glucose—sample, results, and conclusions.
Results
Comprehensive literature searches identified 563 articles. Articles were screened and 31 articles met eligibility criteria. Twenty-three of the 31 articles (74%) were published in the past 4 years.
Review Articles of Blood Glucose Meter Accuracy
Five of the six review articles focused on factors affecting evaluation of the accuracy of blood glucose monitors.1–5Factors can be categorized as patient/user knowledge, methods and analyses, sources of interference, and reporting of results. Patient/user knowledge factors include educating patients in the proper techniques of glucose meter use,2,3 proper handling and storage of test strips,2,5 proper storage of control solution,5 meter cleanliness,5timing of sample collection after eating or insulin dose,2–5 size and placement of blood sample,5 and removal of blood from the strip.5 Education would provide an opportunity to reduce operator error2,4 and falsification of results by the patient.3 A poor user interface4 can also impact proper glucose meter use. Factors related to the methods and analyses include blood versus plasma/serum glucose,1,2,4 source of sample (arterial, capillary, and venous),1,2,4 calibration of instrument,1,5 different enzymatic methods,2 between-lot variability of glucose strips,1,4,5 analytic imprecision of laboratory reference method,2 and study design.2,6
Several substances and patient factors are sources of interference. Substances include galactose,3 xylose,3 sodium fluoride,1 glutathione,1 cysteine,1 uric acid,1,3 hemolysis,1,2,5 and drugs (e.g., ascorbic acid,1–5 aspirin,2,5 acetaminophen,1,3–5 dopamine,4 icodextrin,4,5 maltose,3,5 mannitol,4 and tolbutamide1). Patient factors include hypotension,1,4 hypertriglyceridemia,1,2 hypothermia,4 pH,4 oxygen (e.g., hypoxia and oxygen therapy),1–4 hematocrit (e.g., anemia and polycythemia),1,3–5 and bilirubin.3 Factors of reporting results of accuracy include statistical methods (e.g., correlation coefficients, linear regression, percent deviation, and mean differences),1,2 bias plots,2 and error grids.1,2,4 A sixth review article examined best practices for conducting and reporting glucose monitor evaluation studies.6 A checklist is presented in the article that outlines an approach for a protocol that is evidence based and provides enough details for reproducibility of methods and results.6
Performance of Blood Glucose Meters in Laboratory Settings
Fourteen articles reported on the performance of blood glucose meters in laboratory settings7–20 (Table 1). In each article, 17 to 3019 blood glucose meters were tested. Most commonly, 3,11,17,18 4,7,9,14,16,20 or 510,12,13 blood glucose meters were compared. Meter operators were specified in only three of the articles.8,9,13 The most common performance evaluation types included accuracy (e.g., bias,9,10,12,15,18,19 Bland–Altman plots,7,8,10,14–16,20 or error grid analysis8–10,15,18), analytical range,9,12,16 effect of chemical interference on meter accuracy,7,8,12,20 effect of hematocrit interference on meter accuracy,7,11,12,14,17,19,20 effect of PO2 on meter accuracy,14,17 locally smoothed median absolute difference curves,8,14,15 precision,7,8–12,16,20 and performance criteria (e.g., ISO 15197,8,11,14–16 The Netherlands Organization for Applied Scientific Research,19 or other professional and regulatory agencies9). Performance evaluation measures of blood glucose meters in laboratory settings are presented in Table 2. Two9,18 of the five8–10,15,18 studies that provided results from an error grid analysis (EGA) included measurements that fell outside of zones A and B.
Table 1.
Blood Glucose Meters in Laboratory Settingsa
| Author | Blood glucose meter tested | Sample | Meter operators | Performance evaluation types |
|---|---|---|---|---|
| Bewley et al.7 | StatStrip glucose meter (Nova Biomedical, Waltham, MA) compared with three conventional glucose meter technologies | Whole blood samples from 37 patients on peritoneal dialysis in the dialysis center of the nephrology clinic | NR | Accuracy (Bland–Altman plots), effect of chemical interference on meter accuracy, effect of hematocrit interference on meter accuracy, method comparison, precision (within run) |
| Chan et al.8 | StatStrip (Nova Biomedical, Waltham, MA) | Samples from six clinical locations within a university-affiliated, tertiary care hospital: capillary blood samples (NICU), capillary blood sample (diabetes clinic), arterial blood (CVICU), arterial blood (stat lab), cord blood (delivery suite), arterial/venous blood (dialysis unit) | Four laboratory technologists and 20 front line nurses | Accuracy (Bland–Altman plots), accuracy (error grid analysis), effect of chemical interference on meter accuracy, locally-smoothed median absolute difference curves, performance criteria recommended by ISO 15197, precision (within run) |
| Chen et al.9 | Four brands of commonly used glucose meters | Whole blood samples from 503 patients | Five medical technologists, three research assistants, and one medical doctor | Accuracy (bias), accuracy (error grid analysis), analytical range, performance criteria recommended by professional and regulatory agencies, precision |
| Cohen et al.10 | Five currently available blood glucose meters in Australia: Accu-Chek Go (Roche), Accu-Chek Advantage (Roche), CareSens (i-Sens), GlucoMen PC (Menarini), and Optium (Abbott) | Capillary blood samples from 49 patients attending a diabetes clinic | NR | Accuracy (bias), accuracy (Bland–Altman plots), accuracy (error grid analysis), precision |
| Flore et al.11 | Three representative point-of-care testing systems: Bayer Rapidlab 855 (Seimens, Brussels, Belgium), RapidPoint 400 (Seimens, Brussels, Belgium), and Accu-Chek Inform (Roche Diagnostics, Basel, Switzerland) | Control materials | NR | Effect of hematocrit interference on meter accuracy, performance criteria recommended by ISO 15197, precision, total error |
| Karon et al.12 | Four glucose meter technologies representing the major hospital-based technologies currently available: Accu-Chek Inform (Roche Diagnostics, Indianapolis, IN), Precision PCx (Abbott Diabetes, Alameda, CA), SureStepFlexx (LifeScan, Milpitas, CA), and StatStrip (Nova Biomedical, Waltham, MA) | Control materials and whole blood samples from 185 patients in the intensive care unit | NR | Accuracy (bias), analytical range, correlation with reference method, effect of chemical interference on meter accuracy, effect of hematocrit interference on meter accuracy, precision (day-to-day), precision (within run) |
| Kimberly et al.13 | Five of the most common monitors: MediSense Precision Xtra, Ascencia Dex, Prestige Smart System, OneTouch Ultra, and Accu-Chek Advantage | 12 capillary blood samples from 22 people without diabetes and 71 people with diabetes | One trained operator | Among strip lot within-monitor CV, total within-monitor CV, within-strip lot within-monitor CV |
| Kost et al.14 | Four hospital glucose meter systems: Accu-Chek Inform (Roche Diagnostics, Indianapolis, IN), One Touch SureStep (LifeScan, Milpitas, CA), HemoCue Glucose 201 (HemoCue AB, Angelholm, Sweden), and Precision PCx (Abbott Laboratories, Abbott Park, IL) | 613 arterial blood samples from a university hospital blood gas laboratory | NR | Accuracy (Bland–Altman plots), accuracy (error grid analysis), effect of chemical interference on meter accuracy, locally smoothed median absolute difference curves, performance criteria recommended by ISO 15197, precision (within run), effect of O2 interference on meter accuracy, locally smoothed median absolute difference curves, performance criteria recommended by ISO 15197 |
| Kost et al.15 | StatStrip glucose meter (Nova Biomedical, Waltham, MA) compared with 20 clinical laboratory chemistry analyzer reference instruments | 1703 venous samples were analyzed at 35 hospitals that used 20 types of chemistry analyzers | NR | Accuracy (bias), accuracy (Bland–Altman plots), locally smoothed median absolute difference curves, performance criteria recommended by ISO 15197 |
| Lippi et al.16 | Four marketed portable glucose meters: Glucomen PC (A. Menarini Diagnostics, Florence, Italy), One Touch II (LifeScan, Milpitas, CA), Accu-Check Comfort (Roche Diagnostics, Indianapolis, IN), and Ascensia Glocometer Elite XL (Bayer Corporation, Elkhart, IN) | 45 whole blood specimens | NR | Accuracy (Bland–Altman plots), analytical range, performance criteria recommended by ISO 15197, precision (within run) |
| Rao et al.17 | Three blood glucose meters | Venous whole blood samples from healthy volunteers | NR | Effect of hematocrit interference on meter accuracy, effect of O2 interference on meter accuracy |
| Savoca et al.18 | 3 plasma calibrated blood glucose meters: Precision Xcceed (Abbott), Ascensia Contour (Bayer Corporation, Elkhart, IN), Accu-Chek Aviva (Roche Diagnostics, Indianapolis, IN) | 115 capillary blood samples | NR | Accuracy (bias), accuracy (error grid analysis) |
| Slingerland et al.19 | Thirty blood glucose meters available on the Dutch market | 50 capillary blood samples and 10 venous whole blood samples | NR | Accuracy (bias), effect of hematocrit interference on meter accuracy, performance criteria recommended by The Netherlands Organization for Applied Scientific Research |
| Thomas et al.20 | StatStrip glucose meter (Nova Biomedical, Waltham, MA) compared with three glucose meter systems: Advantage (Roche Diagnostics, Indianapolis, IN), Optium Xceed (Abbott Diabetes, Alameda, CA), and Contour TS (Bayer Healthcare Diabetes Care) | 109 capillary blood specimens from 39 NICU patients | NR | Accuracy (Bland–Altman plots), effect of chemical interference on meter accuracy, effect of hematocrit interference on meter accuracy, method comparison, precision (within run) |
CV, coefficient of variance; CVICU, cardiovascular intensive care unit; NICU, neonatal intensive care unit; NR, not reported in article; O2, oxygen.
Table 2.
Performance Measures of Blood Glucose Meters in Laboratory Settingsa
| Author | Performance evaluation measures |
|---|---|
| Bewley et al.7 |
|
| Chan et al.8 |
|
| Chen et al.9 |
|
| Cohen et al.10 |
|
| Flore et al.11 |
|
| Karon et al.12 |
|
| Kimberly et al.13 |
|
| Kost et al.14 |
|
| Kost et al.15 |
|
| Lippi et al.16 |
|
| Rao et al.17 |
|
| Savoca et al.18 |
|
| Slingerland et al.19 |
|
| Thomas et al.20 |
|
ADA, American Diabetes Association; βHB, β-hydroxybutyrate; CV, coefficient of variance; HK, hexokinase; LS, locally smoothed; MAD, medial absolute difference.
Performance of Blood Glucose Meters in Clinical Settings
Nine articles reported 12 studies on the performance of blood glucose meters in clinical settings21–29 (Table 3). In each protocol, 123,26,29 to 2121 blood glucose meters were tested. Settings included hospital,22,26,29 outpatient clinics,21,23–26 and home.27,28 A total of 1990 patients participated in the studies (median 101, range 32 to 715). The patient used a blood glucose meter in all but three studies, where a health care provider used a meter instead.22,23,29 Each of the studies involved people with type 1 or type 2 diabetes except for studies of women with gestational diabetes,24 of children with only type 1 diabetes,22 and of lay users and health care professionals.26,29 Five studies included children22,23,25,27,28; however, only 1 of the studies involved children exclusively.22 Two of the studies applied their findings to American Diabetes Association guidelines21,24 and almost all other studies applied findings to the ISO 15197 standard.22,23,25,26,28,29 Performance measures of blood glucose meters in clinical settings are presented in Table 4. Only 5 of the studies (presented in three of the articles)23,25,26 provided results from an EGA. All measurements in these studies fell into zones A and B.
Table 3.
Blood Glucose Meters in Clinical Settingsa
| Author | Blood glucose meter tested | Setting | Sample | Age | Sex | Duration of diabetes | Years using glucose meter | Using insulin |
|---|---|---|---|---|---|---|---|---|
| Alto et al.21 | Twenty-one different glucose monitors compared with laboratory value from handheld glucose monitor (One Touch II hospital blood glucose monitoring system) | Two family practice residency sites | 111 patients with T1 or T2 diabetes | 56.0 (±14.1) years | 54.6% female | NR | 2.8 (±3.0) (range 0 to 15 years) | 45 (40.9%) |
| DirecNet22 | Two blood glucose meters: FreeStyle Flash (Abbott Diabetes Care, Alameda, CA) and OneTouch Ultra (LifeScan, Milpitas, CA) | In patient (24-hour stay) | 50 children with T1 diabetes | 14.8 (±1.7) years (range 10 to 17 years) | 44% female | 7.0 (±3.7) years | NR | 50 (100%) |
| Garg et al.23 | Ascensia Breeze (Bayer HealthCare LLC, Elkhart, IN) | Two outpatient diabetes centers | 100 patients with T1 or T2 diabetes | 39 years (range 15 to 79 years) | 50% female | 12 years (range <1 to 56 years) | NR | NR |
| Henry et al.24 | Six different unspecified home blood glucose meters compared with the HemoCue B glucose analyzer | Outpatient clinic visits | 500 patients with diabetes during pregnancy | 32.4 years | 100% female | NR | NR | NR |
| Kilo et al.25 (lay user protocol) | Two blood glucose meters: Ascensia Contour and Ascensia Microlet Vaculance (Bayer HealthCare LLC, Elkhart, IN) | Four outpatient diabetes clinics | 101 patients with diabetes T1 diabetes, T2 diabetes, or gestational diabetes | 44 years (range 17 to 79 years) | 48% female | 9 years (range 0.1 to 50 years) | 8.1 years (range 0.1 to 45 years) | NR |
| Kilo et al.25 (high altitude protocol) | Two blood glucose meters: Ascensia Contour and Ascensia Microlet Vaculance (Bayer HealthCare LLC, Elkhart, IN) | Four outpatient diabetes clinics | 54 patients with T1 or T2 diabetes | 56 years (range 31 to 80 years) | 52% female | NR | NR | NR |
| Kilo et al.25 (alternative site protocol) | Two blood glucose meters: Ascensia Contour and Ascensia Microlet Vaculance (Bayer HealthCare LLC, Elkhart, IN) | Four outpatient diabetes clinics | 40 patients with T1 or T2 diabetes | Range 12 to 77 years | 68% female | NR | NR | NR |
| Kilo et al.26 (lay user protocol) | Ascensia Countour (Bayer HealthCare LLC, Elkhart, IN) | Two outpatient clinical sites | 101 lay users and health care professionals | 45.1 years (range 17 to 79) | 48% female | 9 years (range 0.1 to 50 years) | 8.1 years (range 0.1 to 45 years) | NR |
| Kilo et al.26 (hospital bedside protocol) | Ascensia Countour (Bayer HealthCare LLC, Elkhart, IN) | Inpatient hospital bedside | 60 patients with T1 diabetes, T2 diabetes, or hyperglycemic condition | 56 years (range 18 to 93) | 40% female | NR | NR | NR |
| Kristensen et al.27 | Six blood glucose meters: OneTouch Basic/II/Profile and GlucoTouch (LifeScan, Milpitas, CA); Accu-Chek Sensor (Roche Diagnostics, Basel, Switzerland); Glucometer Dex/Dex2 and Ascensia Elite (Bayer Diagnositcs, Leverkusen, Germany); Precision QID, MediSense Pen, MediSense Card, and Precision Xtra (Abbott Laboratories/MediSense, Abbott Park, IL) | Home | 126 patients with T1 or T2 diabetes | 55 years (range 6 to 84) | 50% female | 9 years (range 2 to 61 years) | 9 years (range 2 to 25 years) | 83 (66%) |
| Kristensen et al.28 | Nine blood glucose meters: OneTouch Ultra and OneTouch GlucoTouch (LifeScan, Milpitas, CA), Precision Xceed/Precision Xtra Plus (Abbott, Abbott Park, IL), Accu-Chek Aviva, Accu-Chek Sensor/Accu-Chek Sensor Comfort Glucose, and Accu-Chek Compact Plus (Roche Diagnostics, Basel, Switzerland), Glucocard X-Meter/Glucocard X-Sensor (Arkray, Kyoto, Japan), HemoCue Monitor (HemoCue AB, Angelholm, Sweden), Ascensia Contour/Ascensia Microfill (Bayer Healthcare, Leverkusen, Germany) | Home | 715 patients with T1 or T2 diabetes | 53.8 years (range 10 to 75) | 45% female | NR | NR | NR |
| Maynaar et al.29 | AccuChek (Roche Diagnostics, Mannheim, Germany) | Intensive care unit in a general hospital | 32 critically ill patients | 71.6 (±11.9) years | 72% female | NR | NR | NR |
ADA, American Diabetes Association; NR, not reported in article; T1, type 1; T2, type 2.
Table 4.
Performance Measures of Blood Glucose Meters in Clinical Settingsa
| Author | Performance evaluation measures |
|---|---|
| Alto et al.21 |
|
| DirecNet22 |
|
| Garg et al.23 |
|
| Henry et al.24 |
|
| Kilo et al.25 (lay user protocol) |
|
| Kilo et al.25 (high-altitude protocol) |
|
| Kilo et al.25 (alternative site protocol) |
|
| Kilo el at.26 (lay user protocol) |
|
| Kilo et al.26 (hospital bedside protocol) |
|
| Kristensen et al.27 |
|
| Kristensen et al.28 |
|
| Maynaar et al.29 |
|
CV, coefficient of variance; EQA, external quality assessment; HCP, health care provider; MLT, medical lab technician; RAD, relative absolute difference.
Simulation Modeling of Blood Glucose
Two articles reported the use of simulation to investigate insulin dosing errors.30,31 One study calculated that insulin dosage errors would occur 8 to 23% of the time in a meter with a total analytical error of 5%.30 Insulin dosage errors also were calculated to occur 16 to 45% of the time in a meter with a total analytical error of 10%.30 This study concluded that glucose meters meeting current quality standards permit a large percentage of administered doses to differ from intended doses.30 The other study focused on intravenous insulin therapy in critically ill patients and used a sample of 29,920 glucose values to simulate glucose values with error.31 In the simulation, when 10, 15, or 20% total error was modeled, one category insulin errors occurred with 39, 46, or 46% of simulated glucose values and two category insulin errors occurred with 3, 9, or 16% of simulated glucose values.31 The study concluded that permitting a 10% total error in glucose measurement would result in safer management of patients on intravenous insulin therapy.31
Analytical versus Clinical Performance Accuracy
Self-blood glucose monitors (SBGM) were introduced widely during the early 1980s and became commonly used in the 1990s as a replacement for urine testing as a means for patients with diabetes to determine their current level of glycemia. Patients were taught to use these SBGM readings to guide their decisions regarding immediate treatment. While analytical or statistical accuracy of SBGM systems is necessary for Food and Drug Administration (FDA) approval and may be useful for demonstrating relative differences among systems, presentations of accuracy using analytical terms alone may not describe accuracy in its entirety.
Several examples of how analytical tools used in the description of SBGM accuracy could be irrelevant to treatment decisions are presented. First, correlation coefficients, which describe relationships between two variables—reference BG and SBGM BG— can be close to unity and highly significant when large numbers of data points are analyzed, yet individual data point may differ by large amounts.32 Pohl and colleagues33 have shown that even when the correlation coefficient of a large set of reference and SBGM determinations is highly significant across the entire BG range, correlation coefficients for that same data may differ significantly in the three critical BG ranges—hypoglycemia, euglycemia, and hyperglycemia. Linear regression equations present the slope of the “best-fitting” line relating two sets of data, but even when that slope approaches unity, the relationship between two data points is not assured. ISO standards acknowledge that percentage differences between reference and SBGM BG values do not apply across the entire BG reference range; however, these criteria are not sufficient to prevent the possibility of serious errors in treatment decision making.34 For instance, if the reference value is 74 mg/dl, a level that would signal impending hypoglycemia, a SBGM BG value would be considered accurate if it were between 59 and 89 mg/dl. These two values signal entirely different clinical responses. Likewise if the reference BG were 76 mg/dl, then a 20% deviation of SBGM values from 51 to 91 mg/dl would be considered accurate.
These examples clearly suggest that traditional analytical methods, even though widely accepted as standards for reporting accuracy of SBGM systems, may confer a level of accuracy that could complicate a patient's ability to achieve BG targets, including the detection and prevention of hypoglycemia.
Patients and clinicians use SBGM systems to guide very specific clinical decisions. Thus a different method for describing the accuracy of SBGM is needed to reduce potential clinical errors that could be associated with traditional statistical analyses. EGA was the first method developed to quantify the clinical accuracy of patient-determined BG values.32 EGA categorizes the relationship between a patient-generated BG level and a reference BG levels in terms of the clinical status that would result from a treatment decision based on the patient-generated result. Subsequently, Parkes and colleagues35 developed the consensus error grid (CEG), a similar method for describing the accuracy of SBGM based on clinical decision making. Both of these analyses are designed to emphasize the importance of obtaining clinically accurate information across the entire BG range (hypoglycemia, euglycemia, and hyperglycemia).36
The EGA is a graph of reference vs SBGM BG data pairs, which is divided into five zones of clinical accuracy (Figure 1). The basic assumptions of EGA are that the target BG range is between 70 and 180 mg/dl and that any patient-generated BG value outside that range will be treated according to protocols or algorithms selected by the health care provider and the patient. Zone A (upper and lower) data pairs represent patient-generated values, which are within 20% of the reference values and/or ≤70 mg/dl when the reference is ≤70 mg/dl. Zone A points are categorized as clinically accurate because they could lead to accurate treatment decisions. Zone C (upper and lower) data pairs represent possible “overcorrection errors,” as patient-generated values in these zones could trigger treatment responses that might result in the subsequent BG value being outside the target range. Zone D (upper and lower) values are “failure to treat” errors because the patient-generated values are within the target range when the reference value is either low (≤70 mg/dl) or high (≥240 mg/dl). Zone E values are “erroneous errors” where the patient-generated values are either high (>180 mg/dl) when the reference is low (≤70 mg/dl) or low (≤70 mg/dl) when the reference is high (>240 mg/dl). Patient self-treatment based on these errors could result in serious hypoglycemia or hyperglycemia. Zone B data pairs are those where the patient-generated value deviates from the reference by more than 20% but may not result in clinically significant treatment errors. They are designated clinically acceptable.
Figure 1.
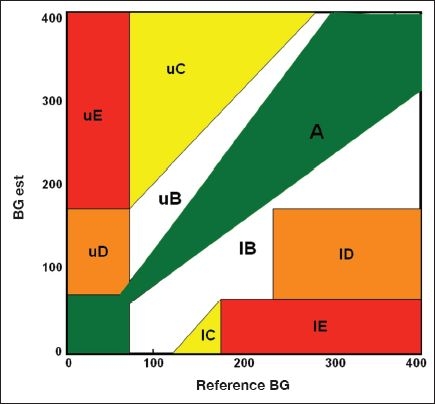
Five zones of clinical accuracy of EGA.
Since the late 1980s, EGA has been used by most manufacturers of SBGM devices to demonstrate the clinical accuracy of their systems and reported along with more traditional statistical analyses to the FDA as part of premarketing applications.37 In the original presentation of the EGA, results from a variety of SBGM were presented.32 In no case was the clinically accurate/acceptable (zones A+B) percentage less than 94%. Indeed, even when results of visually interpreted BG strips were plotted on the EGA, few errors in clinical decision making would have been expected. Thus, it appears, from over 20 years of data collection, that the clinical accuracy of SBGM systems analyzed using either EGA or CEG is sufficient to permit patients to make appropriate treatment. SBGM systems were used by subjects participating in the Diabetes Control and Complications Trial (DCCT) to achieve intensive control of their BG levels and to reduce their risk of diabetic complications.38
It is important to point out that clinical accuracy depends on the BG target range. Although the target range used most commonly for FDA submissions of clinical accuracy of SBGM systems using EGA is 70 to 180 mg/dl, that range is not fixed. It may differ depending on the clinical situation and the treatment goals of an individual patient. In the original description of EGA, an example is presented where the target range of a data set is changed from 70–180 to 60–120 mg/dl, a target being used as a goal for managing glycemia during pregnancy. As a result of that change, the clinically accurate/acceptable (zones A+B) percentage increased while the clinically inaccurate (zones C, D, and E) percentage decreased.32 Thus selecting a different target range for BG alters the size and/or position of the EGA zones and the clinical accuracy of a given SBGM system, but does not change its statistical accuracy. A careful examination of the EGA (Figure 1) and its zones of clinical accuracy permits one to evaluate the potential consequences of selecting different target ranges. For instance, use of a narrow target range (80–110 mg/dl) for hospitalized intensive care patients would shift lower zone C (overcorrection) as well as lower zone E (erroneous) to the left such that the reported fivefold increase in hypoglycemia might have been anticipated.39
Because the clinical accuracy of SBGM assumes that the patient will take treatment action to return his/her BG into the target range, it is clear that patient education and technical performance play a role in the clinical accuracy of SBGM systems. These patient factors and their contribution to accuracy have been reviewed in this article.
Discussion
The American Diabetes Association has suggested that SBGM systems be developed to achieve an analytical plus user error of less than 10% at BG levels between 30 and 400 mg/dl.40 The analytical error goal for such SBGM systems is 5% or less. We have reviewed recent publications describing the analytical and clinical performance accuracy of current systems and the numerous factors, physiologic, environmental, and educational, that affect accuracy. Researchers and clinicians must ask the following obvious questions. “What are the potential benefits to patients that would accompany an improvement in analytical accuracy? Would an improvement in analytical accuracy be logically accompanied by any improvement in clinical outcomes, such as reduced morbidity and mortality in hospitalized patients, or lower hemoglobin A1c (HbA1c) levels, reductions in glycemic verticality, and/or reductions in acute and chronic complications in outpatients?”
Simulation studies suggest that a reduced SBGM analytical error could be associated with fewer incorrect insulin doses given to ICU patients being treated with tight glucose control protocols.39 However, in these simulations, SBGM error had to be reduced to <2% to ensure 95% correct insulin dosing. A lower analytical error might also permit a more rapid and accurate diagnosis of diabetes based on a single fasting BG level.
As stated earlier, SBGM systems were not developed to be substitutes for the precise analytical instruments used to determine BG in hospital laboratories. They were developed to provide immediate BG information to patients with diabetes so that they might make their own treatment decisions. SBGM systems have been used since the late 1970s with varying degrees of success by educated and motivated patients in clinical trials such as the DCCT and in routine self-management. The authors are unaware of any clinical studies that demonstrate a difference in clinical outcomes—HbA1c, glycemic variability, pregnancy, hypoglycemia, diabetic ketoacidosis, or chronic complications—when subjects used SBGM systems with different analytical accuracy. It is possible that this may be due to the limited amount of information provided by a single BG determination. Without information regarding recent BG values and the current rate and direction of BG change, as provided by continuous glucose monitoring technology, reductions in the analytical error of single BG determinations may be insufficient to affect changes in clinical outcomes.
Abbreviations
- BG
blood glucose
- CEG
consensus error grid
- DCCT
Diabetes Control and Complications Trial
- EGA
error grid analysis
- FDA
Food and Drug Administration
- HbA1c
hemoglobin A1c
- ISO
International Organization for Standardization
- SBGM
self-blood glucose monitor
- SMBG
self-monitoring of blood glucose
References
- 1.Bergenstal RM. Evaluating the accuracy of modern glucose meters. Insulin. 2008;3:5–14. [Google Scholar]
- 2.Arabadjief D, Nichols JH. Assessing glucose meter accuracy. Curr Med Res Opin. 2006;22(11):2167–2174. doi: 10.1185/030079906X148274. [DOI] [PubMed] [Google Scholar]
- 3.Bode BW. The accuracy and interferences in self-monitoring of blood glucose. US Endocr Dis Touch Brief. 2007:4–6. [Google Scholar]
- 4.Dungan K, Braithwaite SS, Chapman J, Buse J. Glucose measurement: confounding issues in setting targets for inpatient management. Diabetes Care. 2007;30(2):403–409. doi: 10.2337/dc06-1679. [DOI] [PubMed] [Google Scholar]
- 5.Hirsch IB, Bode BW, Childs BP, Close KL, Fisher WA, Gavin JR, Ginsberg BH, Raine CH, Verderese CA. Self-monitoring of blood glucose (SMBG) in insulin- and non-insulin-using adults with diabetes: consensus recommendations for improving SMBG accuracy, utilization, and research. Diabetes Technol Ther. 2008;10(6):419–439. doi: 10.1089/dia.2008.0104. [DOI] [PubMed] [Google Scholar]
- 6.Mahoney JJ, Ellison JM. Assessing glucose monitor performance—-a standardized approach. Diabetes Technol Ther. 2007;9(6):545–552. doi: 10.1089/dia.2007.0245. [DOI] [PubMed] [Google Scholar]
- 7.Bewley B, O'Rahilly S, Tassell R, DuBois J, Donald E. Evaluation of the analytical specificity and clincal application of a new generation hospital-based glucose meter in a dialysis setting. Point Care. 2009;8(2):61–67. [Google Scholar]
- 8.Chan PC, Rozmanc M, Seiden-Long I, Kwan J. Evaluation of a point-of-care glucose meter for general use in complex tertiary care facilities. Clin Biochem. 2009;42(10–11):1104–1112. doi: 10.1016/j.clinbiochem.2009.03.023. [DOI] [PubMed] [Google Scholar]
- 9.Chen ET, Nichols JH, Duh SH, Hortin G. Performance evaluation of blood glucose monitoring devices. Diabetes Technol Ther. 2003;5(5):749–768. doi: 10.1089/152091503322526969. [DOI] [PubMed] [Google Scholar]
- 10.Cohen M, Boyle E, Delaney C, Shaw J. A comparison of blood glucose meters in Australia. Diabetes Res Clin Pract. 2006;71(2):113–118. doi: 10.1016/j.diabres.2005.05.013. [DOI] [PubMed] [Google Scholar]
- 11.Flore KM, Fiers T, Delanghe JR. Critical evaluation of connectivity-based point of care testing systems of glucose in a hospital environment. Clin Chem Lab Med. 2008;46(12):1763–1768. doi: 10.1515/CCLM.2008.332. [DOI] [PubMed] [Google Scholar]
- 12.Karon BS, Griesmann L, Scott R, Bryant SC, Dubois JA, Shirey TL, Presti S, Santrach PJ. Evaluation of the impact of hematocrit and other interference on the accuracy of hospital-based glucose meters. Diabetes Technol Ther. 2008;10(2):111–120. doi: 10.1089/dia.2007.0257. [DOI] [PubMed] [Google Scholar]
- 13.Kimberly MM, Vesper HW, Caudill SP, Ethridge SF, Archibold E, Porter KH, Myers GL. Variability among five over-the-counter blood glucose monitors. Clin Chim Acta. 2006;364(1–2):292–297. doi: 10.1016/j.cca.2005.07.027. [DOI] [PubMed] [Google Scholar]
- 14.Kost GJ, Tran NK, Abad VJ, Louie RF. Evaluation of point-of-care glucose testing accuracy using locally-smoothed median absolute difference curves. Clin Chim Acta. 2008;389(1–2):31–39. doi: 10.1016/j.cca.2007.11.019. [DOI] [PMC free article] [PubMed] [Google Scholar]
- 15.Kost GJ, Tran NK, Louie RF, Gentile NL, Abad VJ. Assessing the performance of handheld glucose testing for critical care. Diabetes Technol Ther. 2008;10(6):445–451. doi: 10.1089/dia.2008.0049. [DOI] [PMC free article] [PubMed] [Google Scholar]
- 16.Lippi G, Salvagno GL, Guidi GC, Negri M, Rizzotti P. Evaluation of four portable self-monitoring blood glucose meters. Ann Clin Biochem. 2006;43(Pt 5):408–413. doi: 10.1258/000456306778520007. [DOI] [PubMed] [Google Scholar]
- 17.Rao LV, Jakubiak F, Sidwell JS, Winkelman JW, Snyder ML. Accuracy evaluation of a new glucometer with automated hematocrit measurement and correction. Clin Chim Acta. 2005;356(1–2):178–183. doi: 10.1016/j.cccn.2005.01.027. [DOI] [PubMed] [Google Scholar]
- 18.Savoca R, Jaworek B, Huber AR. New “plasma referenced” POCT glucose monitoring systems—-are they suitable for glucose monitoring and diagnosis of diabetes? Clin Chim Acta. 2006;372(1–2):199–201. doi: 10.1016/j.cca.2006.03.012. [DOI] [PubMed] [Google Scholar]
- 19.Slingerland RJ, Muller W, Meeues JT, Van Blerk I, Gouka-Tseng C, Dollahmoersid R, Witteveen C, Vroonhof K. The quality of blood glucose meters in the Netherlands 5 years after introduction of the CE/IVD directive. Ned Tijdschr Klin Chem Labgeneesk. 2007;32:202–204. [Google Scholar]
- 20.Thomas A, Sall S, Roberts C, Drayton M, DuBois J, Clampitt R. An evaluation of the analytical performance of a new-generation hospital-based glucose meter and an assessment of its clinical reliability in a neonatal care unit. Point Care. 2009;8:68–73. [Google Scholar]
- 21.Alto WA, Meyer D, Schneid J, Bryson P, Kindig J. Assuring the accuracy of home glucose monitoring. J Am Board Fam Pract. 2002;15(1):1–6. [PubMed] [Google Scholar]
- 22.Weinzimer SA, Beck RW, Chase HP, Fox LA, Buckingham BA, Tamborlane WV, Kollman C, Coffey J, Xing D, Ruedy KJ Diabetes Research in Children Network Study Group. Accuracy of newer generation home blood glucose meters in a diabetes research in children network (DirecNet) inpatient exercise study. Diabetes Technol Ther. 2005;7(5):675–683. doi: 10.1089/dia.2005.7.675. [DOI] [PMC free article] [PubMed] [Google Scholar]
- 23.Garg SK, Carter JA, Mullen L, Folker AC, Parkes JL, Tideman AM. The clinical performance and ease of use of a blood glucose meter that uses a 10-test disk. Diabetes Technol Ther. 2004;6(4):495–502. doi: 10.1089/1520915041705983. [DOI] [PubMed] [Google Scholar]
- 24.Henry MJ, Major CA, Reinsch S. Accuracy of self-monitoring of blood glucose: impact on diabetes management decisions during pregnancy. Diabetes Educ. 2001;27(4):521–529. doi: 10.1177/014572170102700407. [DOI] [PubMed] [Google Scholar]
- 25.Kilo C, Pinson M, Joynes JO, Joseph H, Monhaut N, Parkes JL, Baum J. Evaluation of a new blood glucose monitoring system with auto-calibration. Diabetes Technol Ther. 2005;7(2):283–294. doi: 10.1089/dia.2005.7.283. [DOI] [PubMed] [Google Scholar]
- 26.Kilo C Sr, Dickey WT Jr, Joynes JO, Pinson MB, Baum JM, Parkes JL, Parker DR. Evaluation of a new blood glucose monitoring system with auto-calibration for home and hospital bedside use. Diabetes Res Clin Pract. 2006;74(1):66–74. doi: 10.1016/j.diabres.2006.02.012. [DOI] [PubMed] [Google Scholar]
- 27.Kristensen GB, Nerhus K, Thue G, Sandberg S. Results and feasibility of an external quality assessment scheme for self-monitoring of blood glucose. Clin Chem. 2006;52(7):1311–1317. doi: 10.1373/clinchem.2006.068114. [DOI] [PubMed] [Google Scholar]
- 28.Kristensen GB, Monsen G, Skeie S, Sandberg S. Standardized evaluation of nine instruments for self-monitoring of blood glucose. Diabetes Technol Ther. 2008;10(6):467–477. doi: 10.1089/dia.2008.0034. [DOI] [PubMed] [Google Scholar]
- 29.Meynaar IA, van Spreuwel M, Tangkau PL, Dawson L, Visser SS, Rijks L, Vlieland TV. Accuracy of AccuChek glucose measurement in intensive care patients. Crit Care Med. 2009;37(10):2691–2696. doi: 10.1097/ccm.0b013e3181a564fe. [DOI] [PubMed] [Google Scholar]
- 30.Boyd JC, Bruns DE. Quality specifications for glucose meters: assessment by simulation modeling of errors in insulin dose. Clin Chem. 2001;47(2):209–214. [PubMed] [Google Scholar]
- 31.Karon BS, Deobald G, Klee GG. Effect of different glucose meter error tolerances on dosing errors during intravenous insulin administration. Point Care. 2008;7(3):124. [Google Scholar]
- 32.Clarke W, Cox D, Gonder-Frederick L, Carter W, Pohl S. Evaluating clinical accuracy of systems for self-monitoring of blood glucose. Diabetes Care. 1987;10(5):622–628. doi: 10.2337/diacare.10.5.622. [DOI] [PubMed] [Google Scholar]
- 33.Pohl S, Gonder-Frederick L, Cox D, Evans W. Self-measurement of blood glucose concentration: clinical significance of patient-generated measurements. Diabetes Care. 1985;8(6):617–619. doi: 10.2337/diacare.8.6.617. [DOI] [PubMed] [Google Scholar]
- 34.International Organization for Standardization. In vitro diagnostic test systems: requirements for blood glucose monitoring systems for self-testing in managing diabetes mellitus (ISO 15197) Geneva: International Organization for Standardization; 2003. [Google Scholar]
- 35.Parkes JL, Pardo S, Slatin SL, Ginsberg BH. A new consensus error grid to evaluate the clinical significance of inaccuracies in the measurement of blood glucose. Diabetes Care. 2000;23(8):1143–1148. doi: 10.2337/diacare.23.8.1143. [DOI] [PubMed] [Google Scholar]
- 36.Klonoff D. The need for separate performance goals for glucose sensors in the hypoglycemic, normoglycemia, and hyperglycemic ranges. Diabetes Care. 2004;27:834–836. doi: 10.2337/diacare.27.3.834. [DOI] [PubMed] [Google Scholar]
- 37.US Food and Drug Administration. Review criteria assessment of portable blood glucose monitoring in vitro diagnostic devices using glucose oxidase, dehydrogenase, or hexokinase methodology (version 02/14/96) Available from: www.fds.cdrh/ode/glu.html.
- 38.The Diabetes Control and Complications Trial Research Group. The effect of intensive treatment of diabetes on the development and progression of long-term complications in insulin-dependent diabetes. N Engl J Med. 1993;329(14):977–986. doi: 10.1056/NEJM199309303291401. [DOI] [PubMed] [Google Scholar]
- 39.Scott MG, Bruns DE, Boyd JC, Sacks DB. Tight glucose control in the intensive care unit: are glucose meters up to the task? Clin Chem. 2009;55(1):18–20. doi: 10.1373/clinchem.2008.117291. [DOI] [PubMed] [Google Scholar]
- 40.American Diabetes Association. Self-monitoring of blood glucose. Diabetes Care. 1994;17(1):81–86. doi: 10.2337/diacare.17.1.81. [DOI] [PubMed] [Google Scholar]