

Abstract
Background
Closed-loop insulin delivery systems linking subcutaneous insulin infusion to real-time continuous glucose monitoring need to be evaluated in humans, but progress can be accelerated with the use of in silico testing. We present a simulation environment designed to support the development and testing of closed-loop insulin delivery systems in type 1 diabetes mellitus (T1DM).
Methods
The principal components of the simulation environment include a mathematical model of glucose regulation representing a virtual population with T1DM, the glucose measurement model, and the insulin delivery model. The simulation environment is highly flexible. The user can specify an experimental protocol, define a population of virtual subjects, choose glucose measurement and insulin delivery models, and specify outcome measures. The environment provides graphical as well as numerical outputs to enable a comprehensive analysis of in silico study results. The simulation environment is validated by comparing its predictions against a clinical study evaluating overnight closed-loop insulin delivery in young people with T1DM using a model predictive controller.
Results
The simulation model of glucose regulation is described, and population values of 18 synthetic subjects are provided. The validation study demonstrated that the simulation environment was able to reproduce the population results of the clinical study conducted in young people with T1DM.
Conclusions
Closed-loop trials in humans should be preceded and concurrently guided by highly efficient and resource-saving computer-based simulations. We demonstrate validity of population-based predictions obtained with our simulation environment.
Keywords: artificial pancreas, compartment modeling, computer simulation, glucose regulation, simulation model
Introduction
Commercial availability of real-time continuous glucose monitoring (CGM) devices has promoted research toward closed-loop insulin delivery systems, also known as the artificial pancreas.1,2 The artificial pancreas consists of three components: a CGM device to measure glucose concentration in the subcutaneous (sc) tissue, a titrating algorithm to compute the amount of insulin to be delivered, and an insulin pump to deliver computed insulin doses subcutaneously. The closed-loop insulin delivery systems have the potential to revolutionize the treatment of type 1 diabetes mellitus (T1DM) within a decade or less.3,4 Clinical trials are currently underway. Promising results and early system prototypes have been reported.1,3,5 However, more extensive clinical testing is needed before closed-loop systems become commercially available and widespread.
Preclinical proof-of-concept testing of closed-loop insulin delivery systems, often required by regulatory bodies, is typically carried out in animals, whereas further testing and optimization is performed in humans. Human and, to a lesser degree, animal testing is resource demanding, time-consuming, and restrained by ethical issues, hampering the fast-track development and efforts leading to commercialization of closed-loop systems. Testing in a computer (virtual) environment, known as in silico testing, can accelerate the development process while facilitating resource savings.
In silico testing can be used to tune and evaluate closed-loop algorithms in a timely fashion and to optimize the design of clinical studies. Importantly, vital information about limitations and safety of control algorithms can be obtained by testing unethical and hazardous scenarios. A critical feature of a computer simulation environment designed for testing control algorithms is its capability to simulate glucose–insulin dynamics in a cohort of in silico subjects, referred to as a virtual population, and to predict the outcome of real clinical studies. For simulation predictions to be reliable, this “virtual population” needs to be representative of the target population, including the observed between- and within-subject variability of glucose responses. Although a useful prerequisite to clinical trials, simulation studies are not a substitute for clinical trials in humans. Human trials are of fundamental importance for the final assessment of efficacy, safety, and usability of closed-loop insulin delivery systems. A methodology and guidance for preclinical simulation-based testing of glucose controllers has been proposed.6
In this paper, we describe and validate a simulation environment to support the development of closed-loop insulin delivery systems. As a member of a larger consortium,4 we are developing an artificial pancreas system for young people with T1DM using commercially available devices.7,8 We use the simulation environment extensively to evaluate and optimize control algorithms and to assess safety, efficacy, and usability of the prototype closed-loop system in various high-risk scenarios and failure modes associated with the component devices. The simulation studies support the design of clinical studies in human subjects by allowing comparisons of various experimental protocols and device characteristics such as the CGM measurement error or the insulin pump delivery error.9
Other simulation environments to support the development of glucose control algorithms have been reported.10–13 Kovatchev and colleagues, also members of the Juvenile Diabetes Research Foundation-funded Artificial Pancreas Project consortium, developed a simulation environment and used it for in silico testing of closed-loop insulin delivery systems in T1DM.10 In 2008, their simulator was accepted by the Food and Drug Administration agency as a substitute for animal testing. Chase et al.,12,14 Hovorka and colleagues.,11,15 and Van Herpe and associates13 conducted simulation studies in the intensive care unit setting.
Simulation Environment
Overview
The simulation environment was designed to support the development and evaluation of closed-loop insulin delivery systems. It mirrors the experimental setup of closed-loop studies and replicates the data flow between a subject with T1DM, a CGM device, a control algorithm, and an insulin pump. Figure 1 shows an overview of the simulation environment.
Figure 1.
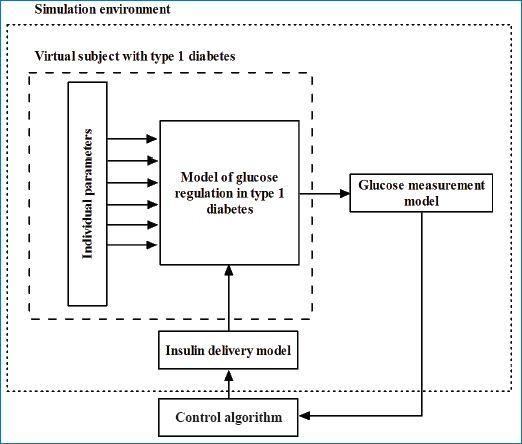
An overview of the simulation environment, which consists of a set of virtual subjects with T1DM, a glucose measurement model, and an insulin delivery model. The control algorithm resides outside the simulation environment but interacts with it.
A flexible design allows modification of the following components of the simulation environment: a virtual population with T1DM, a glucose measurement model, an insulin delivery model, a study protocol, and a set of outcome measures. Although other populations such as the critically ill have been implemented, the present description of the simulation environment is limited to subjects with T1DM using a model of the glucose regulation proposed by Hovorka and associates.16
During a simulated closed-loop study at the beginning of each closed-loop cycle, the tested control algorithm receives sc glucose concentration generated by a model of glucose regulation confounded by a measurement error generated by the glucose measurement model. The control algorithm calculates the insulin infusion rate to achieve and maintain normoglycemia. Insulin is delivered via the insulin pump delivery model to mirror the insulin delivery error. A generic interface allows interaction with stand-alone control algorithms, which reside outside the simulation environment.
Virtual Subject with Type 1 Diabetes
A virtual subject with T1DM is represented by a model of glucose regulation and its parameters. The simulation environment includes 18 synthetic subjects defined by 18 parameter sets (see Figure 2).
Figure 2.
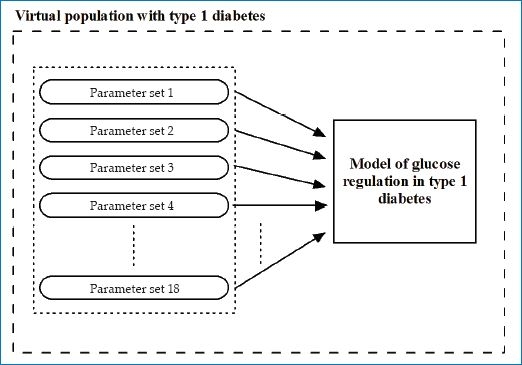
Schematic representation of the virtual population of 18 subjects with T1DM.
Glucose Measurement Model
Two types of glucose measurement error are implemented: (i) a generic model represented as a random uncorrelated process with a zero mean and a constant coefficient of variation (CV) and (ii) an experimentally derived CGM error model. The latter is, at present, available for the FreeStyle Navigator® (FSN) CGM system to simulate overnight closed-loop studies. The experimentally derived CGM error model consists of two components: transient differences between sensor glucose and plasma glucose, also known as “dropouts,” and persistent differences associated with the FSN calibration error.
Insulin Delivery Model
The insulin pump delivery error is assumed uncorrelated, with a zero mean and a constant CV for both the continuous insulin infusion and the insulin bolus bracketed by minimum and maximum values.
Study Protocol
Protocols of simulated experiments specify duration of the experiment, duration of the run-in period, duration of the control cycle, frequency of glucose sampling, CGM calibration points, the time and size of meals, and the time and size of prandial insulin boluses. Unannounced meals and insulin boluses can be specified, which the control algorithm will not be aware of. Failure mode scenarios associated with closed-loop devices can also be specified, including insulin pump occlusion and CGM data transmission gaps. An example of an experimental protocol is shown in Figure 3.
Figure 3.

Example of an in silico study protocol. The protocol is subdivided into sections. The first section, basic information, contains the duration and starting time of the in silico experiment, the time steps, and frequencies of various tasks such as sampling, closed-loop cycle, or logging the events. The meal section contains meal details, their timing, size (CHO contents), and whether the meal bolus should be advised by the controller. The third section, called other inputs, contains information about intravenous glucose bolus and infusion, enteral glucose infusion, and the details of rescue CHO treatment. The disturbances section provides information about any unannounced insulin bolus or meals. The system failures section includes the characteristics of system failure such as pump occlusion and the loss of sensor signal. In the starting glucose section, the user is able to specify plasma glucose at the start of the simulated experiment, while in the past insulin infusion section, insulin infusion rate prior to the start can be specified. The final two sections deal with the timing of sensor calibration and the sensor error characteristics.
Outcome Measures
A variety of statistical measures can be generated at the end of a simulated experiment. The details of those metrics are defined by the user as part of the experiment setup. For each measure, the user defines the variable and the time period to be used in the calculation. There are currently 30 different metrics implemented in the simulator. These include the mean; the median; the standard deviation; the standard deviation rate of change; the percentage of time spent within, above, and below a prespecified target glucose band; the incidence of hypoglycemia; Kovatchev and coworkers' low blood glucose index (LBGI) and high blood glucose index (HBGI);17 and Chassin and colleagues' grading system.18
Two examples of an overnight closed-loop study are shown in Figure 4. A number of simulated closed-loop studies of a specified experimental protocol can be run in a defined population of synthetic subjects yielding population results. A batch of simulated studies will then correspond to a series of real-life clinical studies conducted in subjects with T1DM.
Figure 4.

Sample simulated closed-loop study using a generic glucose measurement model (panel A) and experimentally derived CGM model (panel B). The red continuous curve represents simulated plasma glucose, the green squares represent simulated CGM glucose, the blue piecewise constant curve represents the insulin infusion rate, the green horizontal lines indicate the target glucose range from 3.9 to 8.0 mmol/liter, the magenta and light blue horizontal lines mark mild at 3.5 mmol/liter and significant at 2.8 mmol/liter (panel A) or severe at 2.0 mmol/liter (panel B) hypoglycemia, respectively, the magenta and blue down arrows indicate the meal and prandial insulin bolus, and the red crosses indicate the CGM calibration points.
Implementation
The simulation environment is implemented in Matlab® Version 7.8 (The Mathworks, Natick, MA).
Usage
In our research group, the simulation environment is used routinely in the development of prototype closed-loop insulin delivery systems for subjects with T1DM. The most fundamental use is in evaluating modifications and assessing the impact of various physiological and operating conditions on the safety and efficacy of a glucose controller.9 Several study designs have been simulated by varying the duration of closed-loop cycle, the glucose sampling rate, the timing and the size of meals and insulin boluses, as well as varying the starting glucose levels. In order to simulate real-life scenarios, the meals and insulin boluses can be either announced or unannounced to the control algorithm. Simulated closed-loop studies can also be conducted with varying levels of the CGM measurement error as well as various levels of insulin pump delivery error. Hypothetical failure modes, such as the insulin pump occlusion or failures of the glucose sensing device, can also be simulated, and their effect on closed-loop control can be evaluated.9 In a published simulation study, we assessed the risk of hypoglycemia and hyperglycemia during simulated overnight closed-loop control with model predictive control (MPC)-based controller and FSN CGM system and compared it to the risk observed in the open-loop studies.19
Model of Glucose Regulation in Type 1 Diabetes Mellitus
Overview
The simulation model of glucose regulation in T1DM represents the input–output relationship between the sc insulin infusion on the input and sc glucose concentration on the output. Meal ingestion represents an additional input. The model combines five submodels: a submodel of insulin absorption and kinetics, a submodel of interstitial glucose kinetics, a submodel of enteral glucose absorption, a submodel of insulin action, and a submodel of glucose kinetics (see overview in Figure 5). The following sections provide a brief description of the submodels. Differential equations describing the submodels are given in Appendix A.
Figure 5.
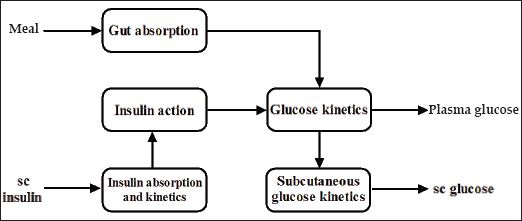
An overview of the simulation model of glucose regulation in T1DM. Model inputs include the meal intake and sc insulin delivery. Model outputs include plasma glucose and sc glucose.
Submodel of Insulin Action
The insulin action submodel includes three remote effects of insulin on glucose kinetics: (i) the effect on glucose transport/distribution, (ii) glucose disposal, and (iii) endogenous glucose production. The model originated from our earlier work involving multiple- tracer experiments in healthy subjects.16,20 The model parameters include three insulin sensitivities corresponding to partitioned effects of insulin on glucose kinetics.
Submodel of Glucose Kinetics
The glucose kinetics is represented by a two-compartment submodel that describes the distribution, production, and utilization of glucose and its control by insulin. The insulin-independent glucose utilization is assumed to be a saturable process and is represented by a Michaelis– Menten relationship. The validity of this submodel and the submodel of insulin action has been demonstrated in healthy subjects during intravenous glucose tolerance test.16
Submodel of Subcutaneous Insulin Absorption and Kinetics
The submodel of sc insulin absorption and kinetics is represented by three compartments with the sc insulin depot divided into an accessible and nonaccessible compartment, with identical transfer rates between the two sc depots and between the sc and plasma compartments.
Submodel of Glucose Absorption from the Gut
The physiology of the gut absorption is represented by a two-compartment chain with identical fractional transfer rates. The model has been shown to be adequate in representing the glucose rate of appearance in plasma from the intestinal tract.21,22 The model includes two parameters: the carbohydrate (CHO) bioavailability and the time to peak of appearance of glucose from the gut. The glucose flux from the gut is assumed to be a saturable process.
Submodel of Interstitial Glucose Kinetics
The submodel of interstitial glucose kinetics is represented by two compartments (plasma and interstitial) with identical transfer-rate constants. The transfer-rate constant defines the time delay between the plasma and the interstitial glucose kinetics.
Virtual Population of Subjects with Type 1 Diabetes Mellitus
The simulation environment includes 18 parameter sets defining a virtual population of 18 subjects with T1DM. A subset of the individual parameters has been estimated from experimental data collected in subjects with T1DM,16 and others have been drawn from informed probability distributions. The virtual subjects are characterized by their daily insulin requirements (0.35 ± 0.14 U/day/kg), insulin-to-CHO ratio (1.7 ± 1.0 U per 10 g CHO), and body weight (74.9 ± 14.4 kg). The intra-individual variability of the glucoregulatory response is represented by superimposing sinusoidal oscillations of 5% amplitude and 3 h period on nominal values of selected model parameters. Each of those parameters had a different phase generated randomly from a uniform distribution U[0,3 h].
Model Parameters
Eight of the eighteen model parameters describing the simulation models have been derived from experimental data. The parameters are presented in Table 1.
Table 1.
Model Parameters Estimated from Clinical Data Using Prior Lognormal Distribution.16
| Symbol | Quantity | Meana | Variability |
|---|---|---|---|
| F01 | Noninsulin-dependent glucose flux (μmol kg-1 min-1) | 11.1 | oscillatory |
| EGP0 | Endogenous glucose production extrapolated to zero insulin concentration (μmol kg−1 min−1) | 16.9 | oscillatory |
| k12 | Transfer rate from nonaccessible to accessible glucose compartment (min−1) | 0.060 | oscillatory |
| SID | Insulin sensitivity of glucose disposal (min−1 per mU liter−1) | 5.05 × 10⁻⁴ | oscillatory |
| SIE | Insulin sensitivity of suppression of endogenous glucose production (per mU liter−1) | 0.019 | oscillatory |
| SIT | Insulin sensitivity of glucose transport/distribution (min−1 per mU liter−1) | 18.41 × 10⁻⁴ | oscillatory |
| kb1 | Activation rate of remote insulin effect on glucose distribution (min−1) | 0.0034 | oscillatory |
| kb2 | Activation rate of remote insulin effect on glucose disposal (min−1) | 0.056 | oscillatory |
| kb3 | Activation rate of remote insulin effect on endogenous glucose production (min−1) | 0.024 | oscillatory |
Mean value of the marginal lognormal distribution.
The remaining parameters presented in Table 2 have been sampled from informed prior distributions. The parameters are characterized by their sampling distribution and are classified as time invariant or oscillatory.
Table 2.
Model Parameters Sampled from Informed Prior Distribution
| Symbol | Quantity | Distribution | Variability |
|---|---|---|---|
| VG | Glucose distribution volume (liter kg−1) | exp(VG) ∼ N(ln(0.15),0.232)16 | stationary |
| R_th | Renal clearance threshold (mmol liter−1) | R_th ∼ N(9,1.52) | stationary |
| R_cl | Renal clearance rate (min−1) | R_cl ∼ N(0.01,0.0252)23 | stationary |
| VI | Insulin distribution volume (liter kg∼1) | VI ∼ N(0.12,0.0122)16 | stationary |
| ka | Insulin absorption rate (min∼1) | ka | N(0.018,0.00452)24 |
| ke | Insulin elimination rate (min−1) | ke ∼ N(0.14,0.0352)16 | oscillatory |
| Bio | Bioavailability of CHO (%) | Bio ∼ U(70,120) | stationarya |
| tmax | Time-to-maximum of CHO absorption (min) | exp(1/tmax) ∼ N(−3.689,0.252)25 | stationary |
| ka_int | Transfer-rate constant between interstitial and plasma glucose compartment (min−1) | exp(ka_int) ∼ N(−2.372,1.0922)26 | oscillatory |
Subject to an additional 20% interoccasion variability.
Validation Study
A simulation study was performed with the aim to reproduce a protocol of a previously completed clinical study evaluating closed-loop insulin delivery in young people with T1DM. The simulated and clinical studies employed an identical closed-loop control algorithm. Results of the two studies were compared to validate the virtual population of subjects with T1DM.
Methods
A virtual population of 18 subjects with T1DM was used to simulate overnight closed-loop study with MPC algorithm. The protocol of the simulated study reflected a clinical trial of a closed-loop insulin delivery conducted in 12 children and adolescents with T1DM7 (7 males, aged 13.1 ± 4.2 years, body mass index 21.9 ± 4.3 kg/m2, duration diabetes 6.8 ± 4.4 years, hemoglobin A1c 8.7 ± 2.0%). See Figure 6 for study outline.
Figure 6.
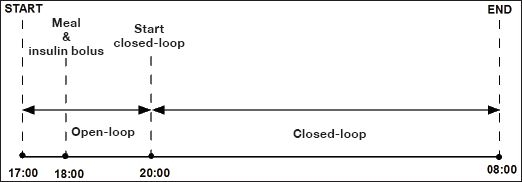
Protocol of simulated overnight closed-loop study.
The details of the in silico study protocol are shown in Figure 3. At 18:00, protocol included a meal containing the mean CHO intake recorded on the clinical study (87 g CHO) accompanied by a prandial insulin bolus calculated using the virtual subject's insulin-to-CHO ratio. The insulin infusion rate between 17:00 and 20:00 was calculated using the simulation model of a particular virtual subject assuming steady-state conditions at the start of the experiment. At 20:00, the closed-loop glucose control algorithm took over the insulin delivery, advising on the insulin infusion rate every 15 min. Closed-loop insulin delivery with the control algorithm continued for 12 h until the end of the experiment.
The sc glucose measurement was simulated using the generic measurement error model with 2% CV. The pump delivery error model was assumed to be zero mean uncorrelated, with a constant CV of 5% for the continuous insulin infusion and the insulin bolus.
Statistical analysis was conducted with the use of SPSS, Version 15 (SPSS Inc., Chicago, IL) or Matlab Version 7.8. Significance level of 5% (p < .05) was used to declare statistical significance. Values are given as mean ± standard deviation or median (interquartile range) unless stated otherwise.
Control Algorithm
The clinical and simulated studies used an adaptive control algorithm based on the MPC approach.27 Every 15 min, real-time sensor glucose data were entered into the MPC algorithm, which calculated sc insulin infusion rates. The MPC algorithm adopts a compartment model of glucose kinetics23 describing the effect of sc rapid-acting insulin analogue and the CHO content of meals on sensor glucose excursions. The algorithm is initialized using subject's weight, total daily insulin dose, and usual basal insulin requirements. These values feed into estimates of insulin sensitivity and glucose and insulin distribution volumes. In real-time, sensor glucose measurements are used to update two model parameters: an endogenous glucose flux correcting for errors in model-based predictions and CHO bioavailability. Several competing models differing in the rate of sc insulin absorption and the CHO absorption profile are run in parallel.28 Following estimation of model parameters, a combined model is used to forecast plasma glucose excursions over a 2.5 h receding prediction horizon. A sequence of sc insulin infusion rates is calculated, leading to the desired target glucose, which is set between 5.8 and 7.3 mmol/liter to take into account inaccuracies of model-based predictions. The first infusion rate from the sequence of sc insulin infusion rates is delivered by the insulin pump subject to safety checks that can reduce the infusion rate to prevent insulin overdosing.
Results
An example of a simulated closed-loop study is shown in the top panel of Figure 4. Comparison of the results obtained during the simulated and clinical studies is presented in Table 3.
Table 3.
Comparison between Simulated and Real Closed-Loop Experiments Using Clinical Data Collected in the APCam01 study, with Values as Mean ± Standard Deviation or Median (Interquartile Range)
| Measure | Simulations (N = 18) | APCam01 (N = 12) | P value |
|---|---|---|---|
| Starting glucosea (mmol/liter) | 12.2 ± 4.0 | 10.6 ± 3.0 | NSb |
| Overnight glucosea (mmol/liter) | 7.6 ± 1.2 | 7.8 ± 1.4 | NSb |
| Time in targetc (%) | 69 (62–78) | 63 (49–78) | NSd |
| LBGIe (unitless) | 0.5 (0.2–0.9) | 0.3 (0–1.0) | NSd |
| HBGIe (unitless) | 3.4 (1.3–6.8) | 3.7 (0.6–6.8) | NSd |
| Grades A + Bf (%) | 49 (36–58) | 52 (32–66) | NSd |
| Grades E + Ff (%) | 0 (0–2) | 0 (0–1) | NSd |
| Insulin Infusion (U/h) | 1.1 ± 0.4 | 1.3 ± 0.8 | NSb |
Plasma glucose at the start of the simulated study was designed to match that of the clinical study. Continuous glucose monitoring glucose at the start of closed-loop control and mean overnight CGM glucose were similar in both studies (Table 3 and Figure 7).
Figure 7.
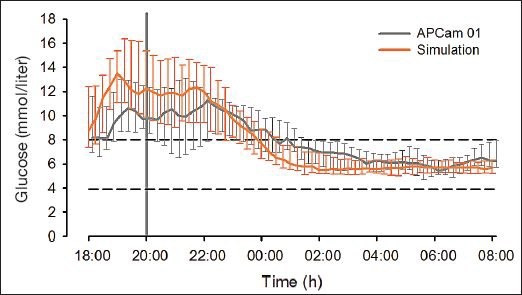
Continuous glucose monitoring glucose during simulated experiments (orange curve, N = 18) and the APCam01 clinical study (grey curve, N = 12). The horizontal dashed lines represent the target glucose range from 3.9 to 8.0 mmol/liter. Median (interquartile range) is shown.
Similarly, the time spent in the target glucose range from 3.9 to 8.0 mmol/liter was not significantly different, and Kovatchev and colleagues' LBGI and HBGI were also similar. The percentages of time spent in grades A and B of Chassin and associates' grading system18 were similar, while the median percentage of time spent in grades E and F was 0% for both the simulated and the clinical studies. The insulin infusion rate advised by the algorithm was similar.
Discussion
Closed-loop trials in humans with T1DM, undoubtedly an essential component of the development process, should be preceded and guided by highly efficient and resource-saving computer-based simulations. Intensified research is underway to develop useful simulation tools.10,29,30 Chassin and coworkers have developed a simulation environment and testing methodology29 using a model of glucose regulation originating from a multitracer-validated study16 and evaluated a glucose controller developed within the European Union funded Adicol project.31 Another simulator was developed by the researchers from the University of Padova and the University of Virginia,10,30 building on model-independent quantification of glucose and insulin fluxes occurring during a meal.30
The simulator, based on a virtual population of 300 subjects, is reported to have been used to design clinical trials and evaluate glucose controllers. As far as we are aware, the simulation environment described by Kovatchev and colleagues,10 although tested extensively, has not been validated using clinical trials data. In silico studies have already proven useful and effective in the development of closed-loop systems for tight glycemic control in the intensive care units.11–13,15
We describe a simulation environment designed specifically to support the development of closed-loop insulin delivery systems in T1DM. The main components of this environment are the mathematical model of glucose regulation representing virtual subjects with T1DM, a glucose measurement model, and a sc insulin delivery model. A realistic representation of the virtual population with the appropriate level of the intersubject and intrasubject variability observed in vivo is considered key to reliable simulations.10 Our virtual population consisting of 18 in silico subjects with T1DM appears to display these characteristics. The intersubject variability is addressed through assigning a unique set of parameter values to an individual in silico subject. The subjects vary in their insulin sensitivity to glucose disposal, endogenous glucose production, and glucose transport, as well as in parameters characterizing glucose absorption from the gut (time to maximum absorption and bioavailability). The variability within subjects is represented by superimposing oscillations on selected model parameters.
A comprehensive validation of the simulation environment is an essential requirement. The presented validation results can be considered as the first step toward full validation of our simulation environment. We were able to show that the results of the simulated closed-loop study were not significantly different from the results obtained during the clinical study, suggesting that the virtual population with T1DM is a good representation of the population of 12 young people with T1DM who participated in the clinical study. In order to extend the validation process, other study designs, populations, algorithms, and clinical results might be required.
Validation of simulation environments is essential to establish the validity of simulation-derived results and predictions. The validation process is not well defined, and the criteria that each simulation environment should meet have been debated by the scientific community. Steil and Reifman32 reported the views of leading researchers in the area of glycemia modeling on the subject of simulation model validity. Three essential criteria were identified: first, show that the model fits existing closed-loop data; second, show that the model can predict clinical closed-loop results obtained in a population of subjects differing from those used for model identification; and third, show that, if the model has been identified on a specific subject, it can predict glucose profiles under different conditions from those used to identify it.
The aim of the present simulation study was to satisfy the second of the reported criteria. The study results demonstrated that our simulation environment was able to reproduce the population results of the clinical study conducted in young people with T1DM. The performance of MPC-based closed-loop algorithm in both studies based on the mean overnight CGM glucose, the time spent in the target glucose range, the high and low blood glucose index, as well as the percentage of time spent in grades A + B and E + F of Chassin and associates' grading scale was similar in both populations. We could therefore infer that our simulated study results are a good prediction of the real clinical study, with a matching experimental protocol, with a similar study population to the one participating in the clinical study.
We acknowledge the relatively small size of our virtual population, and our future plans evolve around expanding the virtual population by employing “experimental in silico cloning,” the term proposed by Hovorka et al.,15 to create synthetic copies of real subjects who participated in clinical trials.
The safety and efficacy of the closed-loop insulin delivery system is greatly influenced by errors associated with CGM devices. Another important feature of the presented simulation environment is the realistic, experimentally derived representation of FSN CGM error. The error model represents transient errors, often referred to as “dropouts,” as well as persistent errors associated with FSN calibration error. This realistic representation of CGM error allows for extensive in silico assessment of the safety and the usability of the closed-loop system, a necessary component of risk–benefit analysis required for regulatory approval of a medical device. Finally, the simulation environment is equipped with an extensive set of outcome measures, which, together with the graphical output, allow for a comprehensive assessment of individual as well as population in silico study results.
Computer-based simulations are now well established in the field of diabetes care. Long-term diabetes treatment and health policy outcomes have been accurately simulated and predicted by the Archimedes diabetes model.33,34 Educational simulators such as AIDA educational package35 or Karlsburg Diabetes Management system36 provide clinicians and patients with an insight to glucose regulation, whilst advisory systems such as the Diabetes Advisory System37 support insulin dosing decisions. This type of simulator is based on an average patient model and is therefore not suited for evaluation of glucose control algorithms.
With increasing amounts of clinical data becoming available, our aim is to improve and refine the simulation model of glucose regulation as well as expand on the number of subjects comprising the virtual population with T1DM. These improvements should result in more realistic predictions and, consequently, should increase the level of confidence in this invaluable tool. In silico studies are already an integral part of the development of closed-loop insulin delivery system prototypes, and we envision them to become a widely accepted standard in the near future.
In conclusion, we present a simulation environment designed specifically to support the development of closed-loop insulin delivery systems in T1DM. The software allows for a comprehensive assessment of individual as well as population in silico study results. The validity of population-based predictions generated by the simulation environment was demonstrated by comparison with a clinical study in young subjects with T1DM.
Acknowledgements
Support by the Clincip Project, the Juvenile Diabetes Research Foundation, Diabetes UK, MRC CORD, and NIHR Cambridge Biomedical Research Centre is acknowledged.
Abbreviations
- CGM
continuous glucose monitoring
- CHO
carbohydrate
- CV
coefficient of variation
- FSN
FreeStyle Navigator
- HBGI
high blood glucose index
- LBGI
low blood glucose index
- MPC
model predictive control
- sc
subcutaneous
- T1DM
type 1 diabetes mellitus
Appendix
Here we describe a submodel of insulin absorption and kinetics, a submodel of interstitial glucose kinetics, a submodel of enteral glucose absorption, a submodel of insulin action, and a submodel of glucose kinetics.
Submodel of Insulin Action
The submodel of insulin is described as a set of differential equations,
where I is plasma insulin concentration, and x1, x2, and x3 represent the remote effects of insulin on glucose distribution/transport, glucose disposal, and endogenous glucose production,16 respectively. SIT = ka1/kb1, SID = ka2/kb2, and SIE = ka3/kb3 are insulin sensitivities for transport, distribution, and endogenous glucose production, with kai, I = 1,…,3, representing deactivation rate constants, and kbi, I = 1,…,3, representing activation rate constants.
Submodel of Glucose Kinetics
The submodel of glucose kinetics includes two compartments and is described as
where Q1 and Q2 are masses of glucose in the accessible (where measurements are made) and nonaccessible glucose compartments, k12 represents the transfer-rate constant from the nonaccessible to the accessible compartment, VG represents the glucose distribution volume in the accessible compartment, UG is the rate of glucose absorption from the gut, and y and G are the (measurable) plasma glucose concentration.
The endogenous glucose production, EGP, is defined as follows:
where EGP0 represents endogenous glucose production extrapolated to the zero insulin concentration.
The noninsulin-dependent glucose flux is defined as follows:
FR is the renal glucose clearance above the glucose threshold of R_thr:
where R_cl is the renal clearance constant.
Submodel of Subcutaneous Insulin Absorption and Kinetics
The submodel of sc insulin absorption and kinetics is described as
where S1 and S2 represent insulin masses in the accessible and nonaccessible compartments, u represents administration (bolus and infusion) of rapid-acting insulin, ka represents insulin absorption rate constant, VI is the volume of distribution of rapid-acting insulin, I is the insulin concentration in plasma, and ke represents the fractional elimination rate from plasma.
Submodel of Glucose Absorption from the Gut
The submodel of glucose absorption from the gut uses a chain of two compartments as described by a set of differential equations:
where G1 and G2 are the glucose masses in the accessible and nonaccessible compartments, tmax is the time-of-maximum appearance rate of glucose in the accessible compartment, t is time of meal, D(t) represents the amount of CHO ingested at time t, Bio is the CHO bioavailability of the meal, and UG represents gut absorption rate.
Time-to-maximum appearance rate of glucose tmax is defined as follows:
where UG_ceil is the maximum glucose flux from the gut (mmol/kg-1·min-1) drawn from U [0.02, 0.035].
Submodel of Interstitial Glucose Kinetics
The submodel of the interstitial glucose kinetics uses a simple diffusion model:
where C is glucose concentration in the sc tissue, G is glucose concentration in the plasma, and ka_int is the transfer-rate constant.
References
- 1.Hovorka R. Continuous glucose monitoring and closed-loop systems. Diabet Med. 2006;23(1):1–12. doi: 10.1111/j.1464-5491.2005.01672.x. [DOI] [PubMed] [Google Scholar]
- 2.Hovorka R. The future of continuous glucose monitoring: closed loop. Curr Diabetes Rev. 2008;4(3):269–279. doi: 10.2174/157339908785294479. [DOI] [PubMed] [Google Scholar]
- 3.Hovorka R, Wilinska ME, Chassin LJ, Dunger DB. Roadmap to the artificial pancreas. Diabetes Res Clin Pract. 2006;74(Suppl 2):S178–S182. [Google Scholar]
- 4.JDRF Artificial Pancreas Project. 2008. http://www.jdrf.org. Accessed on May 20, 2009.
- 5.Buckingham BA, Block J, Wilson D, Rebrin K, Steil G. Novolog pharmacodynamics in toddlers. Diabetes. 2005;54(Suppl 1):A454. [Google Scholar]
- 6.Patek SD, Bequette BW, Breton M, Buckingham BA, Dassau E, Doyle FJ III, Lum J, Magni L, Zisser H. In silico preclinical trials: methodology and engineering guide to closed-loop control in type 1 diabetes mellitus. J Diabetes Sci Technol. 2009;3(2):269–282. doi: 10.1177/193229680900300207. [DOI] [PMC free article] [PubMed] [Google Scholar]
- 7.Hovorka R, Acerini CL, Allen J, Chassin LJ, Larsen AM, De Palma A, Wilinska ME, Dunger DB. Overnight sc-sc closed-loop control improves glucose control and reduces risk of hypoglycaemia in children and adolescents with type 1 diabetes. Diabetes. 2008;57(Suppl 1):A22. [Google Scholar]
- 8.Hovorka R, Acerini CL, Allen J, Chassin LJ, Larsen AF, Mundt D, De Palma A, Wilinska ME, Dunger DB. Good overnight closed-loop glucose control in children and adolescents with type 1 diabetes following ingestion of large, rapidly and slowly absorbed evening meal. Diabetologia. 2008;51:S81–S181. [Google Scholar]
- 9.Wilinska ME, Chassin LJ, Hovorka R. The role of simulation environment in the development of artificial pancreas for overnight glucose control in children and adolescents with type 1 diabetes. J Diabetes Sci Technol. 2008;2(2):A183. [Google Scholar]
- 10.Kovatchev BP, Breton M, Man CD, Cobelli C. In silico preclinical trials: a proof of concept in closed-loop control of type 1 diabetes. J Diabetes Sci Technol. 2009;3(1):44–55. doi: 10.1177/193229680900300106. [DOI] [PMC free article] [PubMed] [Google Scholar]
- 11.Wilinska ME, Chassin LJ, Hovorka R. In silico testing—impact on the progress of the Closed Loop Insulin Infusion for Critically Ill Patients project. J Diabetes Sci Technol. 2008;2(3):417–423. doi: 10.1177/193229680800200311. [DOI] [PMC free article] [PubMed] [Google Scholar]
- 12.Chase JG, Shaw GM, Lotz T, LeCompte A, Wong J, Lin J, Lonergan T, Willacy M, Hann CE. Model-based insulin and nutrition administration for tight glycaemic control in critical care. Curr Drug Deliv. 2007;4(4):283–296. doi: 10.2174/156720107782151223. [DOI] [PubMed] [Google Scholar]
- 13.Van Herpe T, Espinoza M, Pluymers B, Goethals I, Wouters P, Van den Berghe G, De Moor B. An adaptive input-output modeling approach for predicting the glycemia of critically ill patients. Physiol Meas. 2006;27(11):1057–1069. doi: 10.1088/0967-3334/27/11/001. [DOI] [PubMed] [Google Scholar]
- 14.Lonergan T, Le Compte A, Willacy M, Chase JG, Shaw GM, Wong XW, Lotz T, Lin J, Hann CE. A simple insulin-nutrition protocol for tight glycemic control in critical illness: development and protocol comparison. Diabetes Technol Ther. 2006;8(2):191–206. doi: 10.1089/dia.2006.8.191. [DOI] [PubMed] [Google Scholar]
- 15.Hovorka R, Chassin LJ, Ellmerer M, Plank J, Wilinska ME. A simulation model of glucose regulation in the critically ill. Physiol Meas. 2008;29(8):959–978. doi: 10.1088/0967-3334/29/8/008. [DOI] [PubMed] [Google Scholar]
- 16.Hovorka R, Shojaee-Moradie F, Carroll PV, Chassin LJ, Gowrie IJ, Jackson NC, Tudor RS, Umpleby AM, Jones RH. Partitioning glucose distribution/transport, disposal, and endogenous production during IVGTT. Am J Physiol Endocrinol Metab. 2002;282(5):E992–E1007. doi: 10.1152/ajpendo.00304.2001. [DOI] [PubMed] [Google Scholar]
- 17.Kovatchev BP, Cox DJ, Gonder-Frederick LA, Clarke W. Symmetrization of the blood glucose measurement scale and its applications. Diabetes Care. 1997;20(11):1655–1658. doi: 10.2337/diacare.20.11.1655. [DOI] [PubMed] [Google Scholar]
- 18.Chassin LJ, Wilinska ME, Hovorka R. Grading system to assess clinical performance of closed-loop glucose control. Diabetes Technol Ther. 2005;7(1):72–82. doi: 10.1089/dia.2005.7.72. [DOI] [PubMed] [Google Scholar]
- 19.Wilinska ME, Budiman ES, Taub MB, Elleri D, Allen JM, Acerini CL, Dunger DB, Hovorka R. Overnight closed-loop insulin delivery with model predictive control: assessment of hypoglycemia and hyperglycemia risk using simulation studies. J Diabetes Sci Technol. 2009;3(5):1109–1120. doi: 10.1177/193229680900300514. [DOI] [PMC free article] [PubMed] [Google Scholar]
- 20.Shojaee-Moradie F, Carroll PV, Chassin LJ, Gowrie IJ, Jackson NC, Jones RH, Tudor RS, Umpleby AM, Hovorka R. Partitioning glucose transport/distribution and disposal during euglycaemic clamp. Diabetologia. 2001;44(Suppl 1):792. [Google Scholar]
- 21.Worthington DR. Minimal model of food absorption in the gut. Med Inform (Lond) 1997;22(1):35–45. doi: 10.3109/14639239709089833. [DOI] [PubMed] [Google Scholar]
- 22.Hovorka R, Kremen J, Blaha J, Matias M, Anderlova K, Bosanska L, Roubicek T, Wilinska ME, Chassin LJ, Svacina S, Haluzik M. Blood glucose control by a model predictive control algorithm with variable sampling rate versus a routine glucose management protocol in cardiac surgery patients: a randomized controlled trial. J Clin Endocrinol Metab. 2007;92(8):2960–2964. doi: 10.1210/jc.2007-0434. [DOI] [PubMed] [Google Scholar]
- 23.Hovorka R, Canonico V, Chassin LJ, Haueter U, Massi-Benedetti M, Orsini Federici M, Pieber TR, Schaller HC, Schaupp L, Vering T, Wilinska ME. Nonlinear model predictive control of glucose concentration in subjects with type 1 diabetes. Physiol Meas. 2004;25(4):905–920. doi: 10.1088/0967-3334/25/4/010. [DOI] [PubMed] [Google Scholar]
- 24.Silink M. Childhood diabetes: a global perspective. Horm Res. 2002;57(Suppl 1):1–5. doi: 10.1159/000053304. [DOI] [PubMed] [Google Scholar]
- 25.Benn JJ, Bozzard SJ, Kelley D, Mitrakou A, Aoki T, Sorensen J, Gerich J, Sonksen PH. Persistent abnormalities of the metabolism of an oral glucose load in insulin-treated type 1 diabetics. Metabolism. 1989;38(11):1047–1055. doi: 10.1016/0026-0495(89)90039-5. [DOI] [PubMed] [Google Scholar]
- 26.Wilinska ME, Bodenlenz M, Chassin LJ, Schaller HC, Schaupp LA, Pieber TR, Hovorka R. Interstitial glucose kinetics in subjects with type 1 diabetes under physiologic conditions. Metabolism. 2004;53(11):1484–1491. doi: 10.1016/j.metabol.2004.05.014. [DOI] [PubMed] [Google Scholar]
- 27.Bequette BW. Editorial: symposium on algorithms for continuous glucose monitoring and control. Diabetes Technol Ther. 2005;7(1):1–2. doi: 10.1089/dia.2005.7.1. [DOI] [PubMed] [Google Scholar]
- 28.Mazor E, Averbuch A, Bar-Shalom Y, Dayan J. Interacting multiple model methods in target tracking: a survey. IEEE Trans Aerospace Electronic Sys. 1998;34(1):103–123. [Google Scholar]
- 29.Chassin LJ, Wilinska ME, Hovorka R. Evaluation of glucose controllers in virtual environment: methodology and sample application. Artif Intell Med. 2004;32(3):171–181. doi: 10.1016/j.artmed.2004.02.006. [DOI] [PubMed] [Google Scholar]
- 30.Dalla Man C, Rizza RA, Cobelli C. Meal simulation model of the glucose-insulin system. IEEE Trans Biomed Eng. 2007;54(10):1740–1749. doi: 10.1109/TBME.2007.893506. [DOI] [PubMed] [Google Scholar]
- 31.Hovorka R, Chassin LJ, Wilinska ME, Canonico V, Akwi JA, Federici MO, Massi-Benedetti M, Hutzli I, Zaugg C, Kaufmann H, Both M, Vering T, Schaller HC, Schaupp L, Bodenlenz M, Pieber TR. Closing the loop: the adicol experience. Diabetes Technol Ther. 2004;6(3):307–318. doi: 10.1089/152091504774197990. [DOI] [PubMed] [Google Scholar]
- 32.Steil GM, Reifman J. Mathematical modeling research to support the development of automated insulin-delivery systems. J Diabetes Sci Technol. 2009;3(2):388–395. doi: 10.1177/193229680900300223. [DOI] [PMC free article] [PubMed] [Google Scholar]
- 33.Eddy DM, Schlessinger L. Archimedes: a trial-validated model of diabetes. Diabetes Care. 2003;26(11):3093–3101. doi: 10.2337/diacare.26.11.3093. [DOI] [PubMed] [Google Scholar]
- 34.Eddy DM, Schlessinger L. Validation of the archimedes diabetes model. Diabetes Care. 2003;26(11):3102–3110. doi: 10.2337/diacare.26.11.3102. [DOI] [PubMed] [Google Scholar]
- 35.Lehmann ED, Deutsch T, Roudsari AV, Carson ER, Sonksen PH. Validation of a metabolic prototype to assist in the treatment of insulin-dependent diabetes mellitus. Med Inform (Lond) 1993;18(2):83–101. doi: 10.3109/14639239309034472. [DOI] [PubMed] [Google Scholar]
- 36.Rutscher A, Salzsieder E, Fischer U. KADIS: model-aided education in type-I diabetes. Karlsburg Diabetes Management System. Comput Methods Programs Biomed. 1994;41(3-4):205–215. doi: 10.1016/0169-2607(94)90055-8. [DOI] [PubMed] [Google Scholar]
- 37.Andreassen S, Benn JJ, Hovorka R, Olesen KG, Carson ER. A probabilistic approach to glucose prediction and insulin dose adjustment: description of metabolic model and pilot evaluation study. Comput Methods Programs Biomed. 1994;41(3-4):153–165. doi: 10.1016/0169-2607(94)90052-3. [DOI] [PubMed] [Google Scholar]