Abstract
An ultrashort-echo-time stimulated echo-acquisition mode (STEAM) pulse sequence with interleaved outer volume suppression and VAPOR (variable power and optimized relaxation delays) water suppression was redesigned and optimized for human applications at 4 and 7 T, taking into account the specific requirements for spectroscopy at high magnetic fields and limitations of currently available hardware. In combination with automatic shimming, automated parameter adjustments and data processing, this method provided a user-friendly tool for routine 1H nuclear magnetic resonance (NMR) spectroscopy of the human brain at very high magnetic fields. Effects of first- and second-order shimming, single-scan averaging, frequency and phase corrections, and eddy currents were described. LCModel analysis of an in vivo 1H NMR spectrum measured from the human brain at 7 T allowed reliable quantification of more than fifteen metabolites noninvasively, illustrating the potential of high-field NMR spectroscopy. Examples of spectroscopic studies performed at 4 and 7 T demonstrated the high reproducibility of acquired spectra quality.
1 Introduction
The first pioneers in nuclear magnetic resonance (NMR) spectroscopy of liquids discovered a long time ago that an increased magnetic field improved sensitivity and spectral resolution. Fifty years of technological and methodological development has resulted in NMR spectrometers operating at 900 MHz (21 T) used in biochemistry to elucidate the structure of proteins and nucleic acids in solutions [1]. In vivo NMR spectroscopy requires wide-bore-size magnets equipped with a field gradient system for spatial localization. Such instrumentation is typical for magnetic resonance imaging (MRI) scanners. MRI has developed into a standard clinical imaging procedure [2], but the majority of currently installed MRI scanners for humans operate at magnetic fields below 3 T. Recent progress in magnet technology, gradient system performance, and radio-frequency (RF) coil design enabled localized in vivo NMR spectroscopy of humans at magnetic fields up to 7 T [3–6]. However, standard localization techniques, such as point-resolved spectroscopy (PRESS) and stimulated-echo acquisition mode (STEAM) [7–9], based on band-selective RF pulses and gradients were developed using “low-field” MR scanners. Pulse sequences designed for single-voxel NMR spectroscopy at high magnetic fields must take into account increased off-resonance effects at high fields that cause chemical shift displacement errors. In addition, high-field NMR spectroscopy of humans has specific requirements for the hardware (performance of the gradient system and RF coils), elimination of B0 inhomogeneity (shimming), specific absorption rate (SAR), etc.
The aim of this paper is to provide a detailed description of a pulse sequence specifically designed for localized 1H NMR spectroscopy of humans at very high magnetic fields. An ultrashort-echo-time STEAM sequence combined with outer volume suppression (OVS) and VAPOR (variable power and optimized relaxation delays) water suppression, which originally designed for spectroscopy of rats [10] and mice [11] at 9.4 T, was adapted for human applications at 4 and 7 T. Initial results have been shown several years ago [12–15] and since then this sequence has been routinely used [13, 16, 17]. In this article we summarize our experience with high-field 1H NMR spectroscopy of humans and highlight the most important features of pulse sequence design, data acquisition, data processing, metabolite quantification, and present some examples of applications at 4 and 7 T.
2 Methods
2.1 Instrumentation
The measurements described herein were performed on 4 and 7 T whole-body systems. The 4 T, 90 cm magnet (Siemens/Oxford Magnet Technology, Oxford, UK) was equipped with a Sonata gradient system (40 mT/m, 400 µs rise-time; Siemens AG, Erlangen, Germany), which included second-order shim coils with maximum shim strengths of XZ = 1.1 · 10−4 mT/cm2, YZ = 1.1 · 10−4 mT/cm2, Z2 = 2.8 · 10−4 mT/cm2, 2XY = 5.8 · 10−5 mT/cm2, X2 – Y2 = 5.3 · 10−5 mT/cm2 at a current of 20 A for Z2 coil and 10 A for all other second-order shim coils. The 7 T, 90 cm magnet (Magnex Scientific, Yarnton, UK) was equipped with a head gradient coil (40 mT/m, 500 µs rise-time) driven by a Harmony/Symphony gradient amplifier (Siemens AG, Erlangen, Germany), and strong-custom designed second-order shim coils (Magnex Scientific, UK) with maximum strengths of XZ =5.8 · 10−4 mT/cm2, YZ = 5.6·10−4 mT/cm2, Z2 = 9.0 · 10−4mT/cm2, 2XY = 2.8 · 10−4 mT/cm2, X2 – Y2 = 2.9 · 10−4 mT/cm2 at a current of 4 A. Shim coil currents were controlled with amplifiers from Resonance Research, Inc (Billerica, MA). All first- and second-order shim terms were automatically adjusted by FASTMAP with EPI readout [18, 19]. Both magnets were interfaced to a Varian INOVA console (Varian Inc., Palo Alto, CA). The RF amplifiers (CPC, Brentwood, NY) provided maximum power of 2.6 kW (4 T) and 4.5 kW (7 T) at the coil. The highest achievable γB1/2π at 4 and 7 T was approximately 2 kHz using quadrature transmit-receive half-volume RF coils with two geometrically decoupled single-turn coils with a diameter of 12 cm [20]. For the measurement of 1H NMR spectra from deeper brain regions at 4 T, a TEM coil [21] was used (maximum γB1/2π of about 1 kHz). The position of the volume of interest (VOI) was based on multislice RARE (rapid acquisition relaxation-enhanced) imaging with the following parameters: ETL (echo train length), 8; echo spacing, 15 ms; TE (echo time), 60 ms; number of phase-encoding steps, 256; FOV (field of view), 20 by 20 cm; slice thickness, 4 mm; NT (number of transients), 2; TR (repetition time), 4 s. Specific absorption rates (SAR) were maintained within u.s. Food and Drug Administration guidelines for all experiments.
2.2 Quantification of Metabolites
In vivo 1H NMR spectra were analyzed using LCModel [22–24]. The unsuppressed water signal measured from the same VOI was used as an internal reference for quantification assuming a brain water content of 80%. The LCModel basis set included spectra of 20 brain metabolites: alanine, ascorbate (Asc), aspartate (Asp), creatine (Cr), phosphocreatine (PCr), γ-aminobutyric acid (GABA), glucose (Glc), glutamate (Glu), glutamine (Gln), glutathione (GSH), glycerophosphorylcholine (GPC), phosphorylcholine (PCho), glycine, myo-inositol (Ins), lactate (Lac), N-acetylaspartate (NAA), N-acetylaspartylglutamate (NAAG), phosphorylethanolamine (PE), scyllo-inositol, and taurine (Tau). Spectra were simulated with Varian spectrometer spin-simulation software (neglecting J-evolution for ultrashort TE) based on previously published chemical shifts and coupling constants [25]. Chemical shifts of methylene protons of PCho were corrected using our experimental phantom data [24] and missing geminal coupling constants of GABA, GPC, PCho, PE, and Tau were set to −15 Hz. All signals within the chemical shift range of 4.68 ± 0.35 ppm were eliminated from simulated spectra due to frequency selectivity of VAPOR water suppression pulses. A spectrum of fast-relaxing macromolecules experimentally measured from the human brain by an inversion-recovery experiment (TR = 2 s, TI (inversion time) = 0.675 s) was also included in the basis set.
2.3 In Vivo Studies
All subjects were studied after giving informed consent according to procedures approved by Institutional Review Board at the University of Minnesota. Typical voxel sizes were 15 ml at 4 T and 8 ml at 7 T. TR was 4.5 s at 4 T and 5.0 s at 7 T and the echo time of STEAM was between 4 and 6 ms (see also Sect. 3).
3 Results
3.1 Pulse Sequence Design
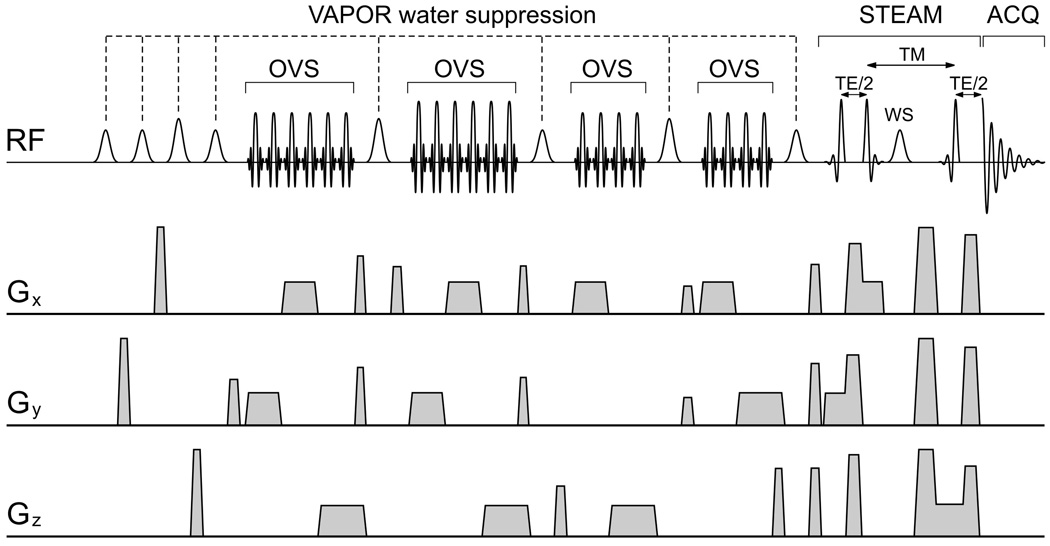
In order to minimize the chemical shift displacement error (off-resonance effects on spatial localization) within the limited peak B1 and to maintain the selectivity of water suppression (±0.35 ppm), the pulse sequence previously developed for the 9.4 T animal MR scanner [10] had to be redesigned as shown in the pulse sequence scheme (Fig. 1). The VAPOR water suppression pulse train [10] was interleaved with 4 blocks of outer volume suppression (OVS) and followed by ultrashort echo time STEAM for localization.
Fig. 1.
Schematic illustration of the localization pulse sequence designed for ultrashort echo time in vivo 1H NMR spectroscopy of human brain at high magnetic fields (4–7 T). The VAPOR water suppression is interleaved with OVS. The STEAM sequence was designed to achieve a minimum echo time of 4–6 ms.
3.2 Ultrashort-Echo-Time STEAM
As in the previous localization method, asymmetric RF pulses were used to reduce the TE [10]. To allow an optimal power adjustment for slightly different loading conditions of the RF coil, the pulse width was set to a value that required the peak RF power (for a 90° pulse) to be a few decibel less than the maximum RF power available. The default duration of the asymmetric STEAM pulses was set to 1.5 ms at 7 T, which required a peak γB1/2π = 1.12 kHz and resulted in 4.5 kHz bandwidth. The pulse width for the 4 T system was set to 2.0 ms (peak γB1/2π = 0.84 kHz, 3.4 kHz bandwidth), in order to make the pulse sequence usable for the TEM volume coil. Bandwidths of STEAM pulses (at 50% of the excitation profile maximum) were used to set the slice-selection gradient amplitudes for requested sizes of the VOI. The minimum TE was between 4 and 6 ms, depending on the duration of crusher gradients required for the elimination of unwanted coherences. In general, requirements for the dephasing power of crusher gradients (amplitude, duration) increased with the sensitive volume of the RF coil and B0. A soft Gaussian RF pulse was used during the TM period for the ultimate suppression of the residual water signal remaining after VAPOR water suppression. To keep the frequency selectivity at different field strengths approximately the same (±0.35 ppm), the duration of this Gaussian pulse was set to 30 ms (4 T) and 20 ms (7 T), which resulted in a TM period duration of 42 ms (4 T) and 32 ms (7 T). Data acquisition started before the maximum of the stimulated echo (STE) to avoid possible baseline distortions due to incorrect amplitudes of the first data points of the free induction decay (FID) (immediately after turning on the receiver). Data points acquired before the maximum of the STE were discarded in postprocessing. The timing of the first data point of the STE was carefully adjusted to eliminate the need for any first-order phase correction in the resulting spectra. RF power for 90° STEAM pulses was calibrated for each VOI as follows: RF power was incremented by 1 dB and the value corresponding to the maximum signal intensity was automatically selected. This power was the basis for setting the power for OVS and VAPOR pulses.
3.3 Outer Volume Suppression
OVS was necessary to improve the localization performance, i.e., elimination of signals arising from outside of the VOI. The OVS scheme with three OVS blocks, originally developed for animal studies at 9.4 T [10], was redesigned for human application. The last OVS block that saturated 6 slabs around the VOI [10] was substituted by two OVS blocks, each of them saturated 4 slabs (Fig. 1). This modification was made due to the timing requirements of VAPOR and the duration of RF pulses in the OVS pulse train. Hyperbolic-secant RF pulses with the R-value of 42 (the product of band-width and pulse width and a nominal flip angle of about 90° were used for the OVS pulses. The 8.4 kHz bandwidth of OVS RF pulses (pulse duration of 5.0 ms, RF power ranging from −5 dB to + 1 dB relative to the peak power of the STEAM 90° pulse) reduced the chemical shift displacement error of the OVS to values comparable with chemical displacement error of the VOI. The RF power applied to the second OVS pulse train was increased by 3 dB relative to the first one to improve the OVS efficiency in the presence of a spatially inhomogeneous B1, frequently encountered at high magnetic fields. Crusher gradients were carefully set to avoid unwanted coherence rephasing. The optimal RF power for the OVS pulses was measured experimentally with profiles along X, Y, and Z axes centered on the VOI. Once optimal settings were found, values of the RF power for each individual OVS pulse were fixed relative to the power of the 90° STEAM pulse. This approach guaranteed that optimal values of the RF power were always used for OVS, independent of the loading of the RF coil. The localization performance of the sequence (STEAM with OVS) was extensively tested using two-chamber phantoms (10 mM Cr in an inner chamber, 25% ethanol in water or vegetable oil in an outer chamber).
3.4 VAPOR Water Suppression
The limited RF power and larger sensitive volume of RF coils on human MR systems resulted in lower peak γB1/2π available that required longer RF pulses in OVS. An increased duration of the OVS pulse train consequently required changes in original VAPOR inter-pulse timing scheme [10]. In addition, to maintain the same selectivity for water suppression (±0.35 ppm) as in the original implementation at 9.4 T, lower magnetic field required longer RF pulses. The key principle of the VAPOR water suppression is to set optimal power variation and time delays in a multipulse train. Taking into account the timing limitations, a simulation of the VAPOR water suppression efficiency was performed to find the optimal combination of RF power variations and the timing to minimize the sensitivity of VAPOR on T1 and B1. Truncated (3 lobes) asymmetric RF pulses [10] of 35 ms (4 T) and 25 ms (7 T) duration were used in the VAPOR water suppression, which represented a reasonable compromise between the excitation profile of the pulse and the timing requirement of the interleaved water suppression and OVS pulse train. Optimized parameters of the VAPOR water suppression for 4 and 7 T are shown in Table 1. The ratio between the power for the STEAM 90° pulse and the optimal power for the nominal VAPOR pulse (N in Table 1) was calculated and experimentally verified. This ratio was independent of RF coil loading, consistent with theory. Therefore, the optimal RF power for VAPOR water suppression was automatically set when the water suppression was turned on. Fine adjustment of water suppression was possible by varying the delay between the 7th and the 8th pulse of VAPOR, which was not necessary for most applications. The crusher gradients in VAPOR were adjusted to minimize the chance for rephasing of unwanted coherences (mainly stimulated echoes) of the water resonance. Using different crusher gradient orientations and amplitudes minimized the probability of unwanted echoes. Settings of the crusher gradients were verified experimentally by incrementing the amplitude of all three crusher gradients (along X, Y, and Z) between the last RF pulse of VAPOR and the first RF pulse of STEAM and by searching for possible echoes of the water resonance. Amplitudes of these crusher gradients were then set to values that were as far away as possible from values generating echoes.
Table 1.
RF power and inter-pulse delays in VAPOR water suppression pulse train with 8 RF pulses optimized for 4 and 7 T.
| Pulse/delay number | ||||||||
|---|---|---|---|---|---|---|---|---|
| Parameter | 1 | 2 | 3 | 4 | 5 | 6 | 7 | 8 |
| RF power (dB)a, 4 T, 7 T Interpluse delay (ms) |
N | N | N + 5 | N | N + 4 | N | N + 5 | N + 5 |
| 4 T | 150 | 100 | 140 | 105 | 105 | 66 | 72 | 18 |
| 7 T | 150 | 100 | 122 | 105 | 102 | 61 | 67 | 14 |
N is the nominal value of the peak RF power of frequency-selective water suppression pulses.
3.5 Single-Scan Data Acquisition
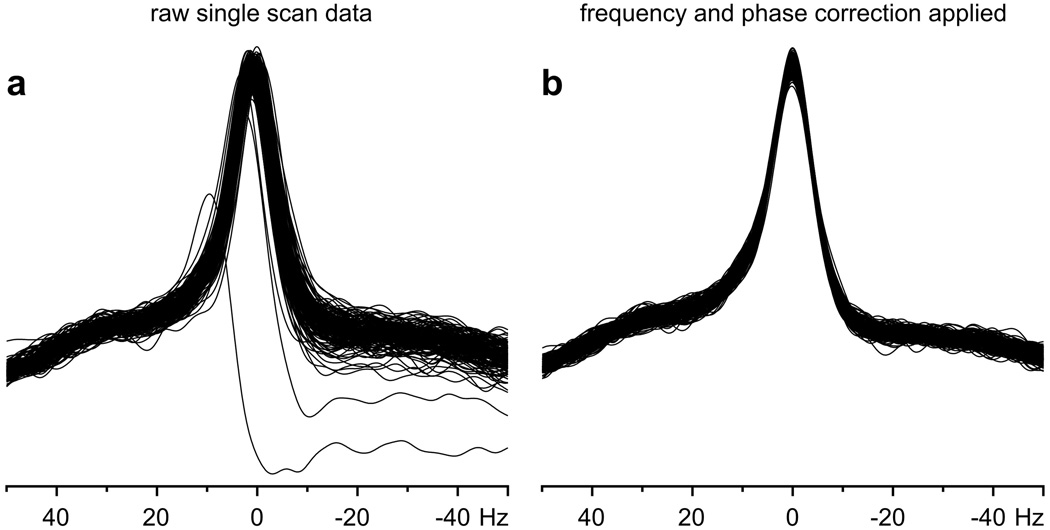
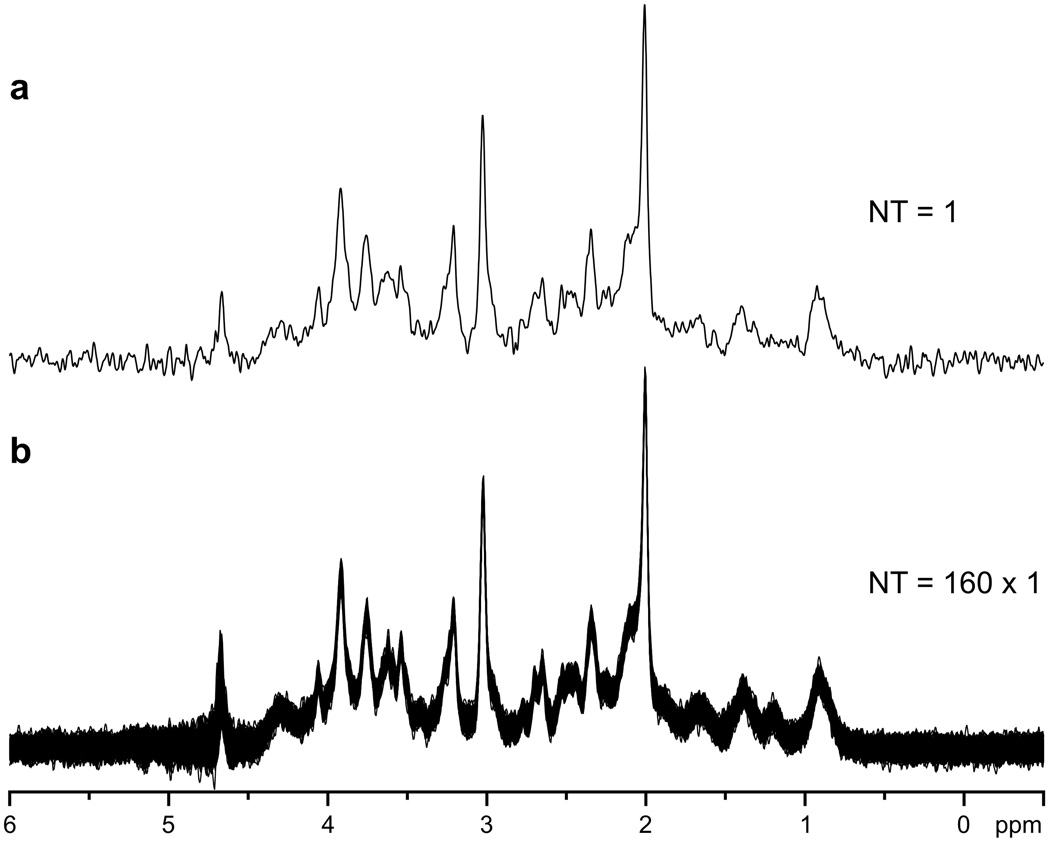
Physiological motion, such as small random motions of the head or motion of the diaphragm during breathing, resulted in frequency and phase variation in spectra (Fig. 2). The impact of frequency and phase fluctuations on spectral quality (reduced signal-to-noise ratio [SNR], increased line width) was easily minimized (Fig. 2) by saving each acquired FID separately on disk and by post-processing corrections before summation. Frequency and phase corrections were possible provided that SNR was ≥3 in single-scan spectra. The frequency variation was calculated from the signal of NAA in absolute-value mode; however, the frequency and phase corrections were performed in the time domain. This approach was used for all spectroscopy studies at 7 T and some studies at 4 T. Single-scan spectra were routinely very reproducible and free from artifacts, e.g., contamination by signal from outside of the VOI (subcutaneous lipids) and/or insufficiently suppressed water signal coherences (Fig. 3). The residual water signal was always substantially lower than the signal of NAA, even though the only experimentally adjusted parameter was the RF power of the STEAM 90° pulse. In addition, a 32-step phase cycle was implemented to subtract potential unwanted coherences from outside of the VOI.
Fig. 2.
Frequency and phase variation of the NAA signal in a data set measured in single-scan mode from the human brain at 7 T (NT = 160). a Uncorrected data; b data after automatic frequency and phase correction.
Fig. 3.
In vivo 1H NMR spectra of human brain (occipital gray matter) measured at 7 T using short-echo-time STEAM sequence with VAPOR water suppression. a Single-scan spectrum; b all 160 spectra from the study are superimposed. TE = 6 ms, TM = 32 ms, TR = 5 s, VOI = 8 ml. Processing: frequency and phase correction, eddy current correction (ECC), Gaussian multiplication f(t) = exp(-(t – tmax)2/2σ2), tmax = 0.0 s, σ = 0.085 s, and fast Fourier transform (FFT).
3.6 Spectral Quality
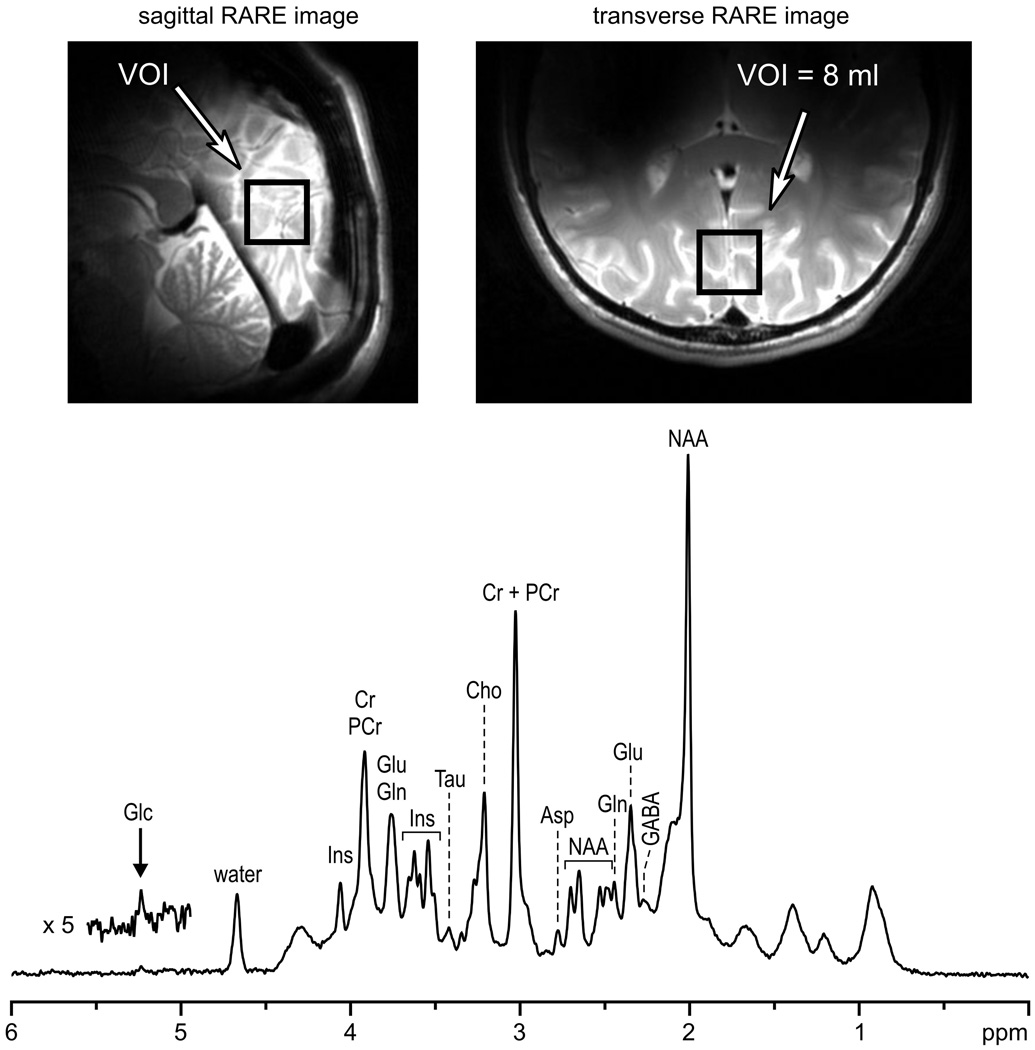
Data processing included automatic frequency and phase correction of the single-scan data, summation of FIDs, elimination of residual eddy current effects using the water signal from the corresponding VOI [26], and automatic zero-order phase correction (subtraction of the phase of the first point from all points of FID). Neither water signal removal nor baseline correction was applied. The quality of in vivo 1H NMR spectra from the human brain currently achievable on our 7 T magnet with the described localization sequence is illustrated in Fig. 4. The position and size of the VOI are shown on sagittal and transverse images of the brain. Characteristic signals of NAA, Cr, cholines (Cho), Glu, Ins, and Tau are clearly discernible (Fig. 4). In addition, the H-1 signal of α-D-glucose was observable, demonstrating the efficiency and selectivity of the VAPOR water suppression.
Fig. 4.
In vivo 1H NMR spectrum measured from the human brain at 7 T. Sagittal and transverse RARE images illustrate the location of the VOI in the occipital lobe. Localization sequence: STEAM combined with OVS, VAPOR water suppression (Fig. 1), TE = 6 ms, TM = 32 ms, TR = 5 s, VOI = 8 ml. NT = 160. Processing: frequency and phase correction of single-scan FIDs, summation, ECC, Gaussian multiplication (tmax = 0.05 s, σ = 0.085 s), FFT, and zero-order phase correction.
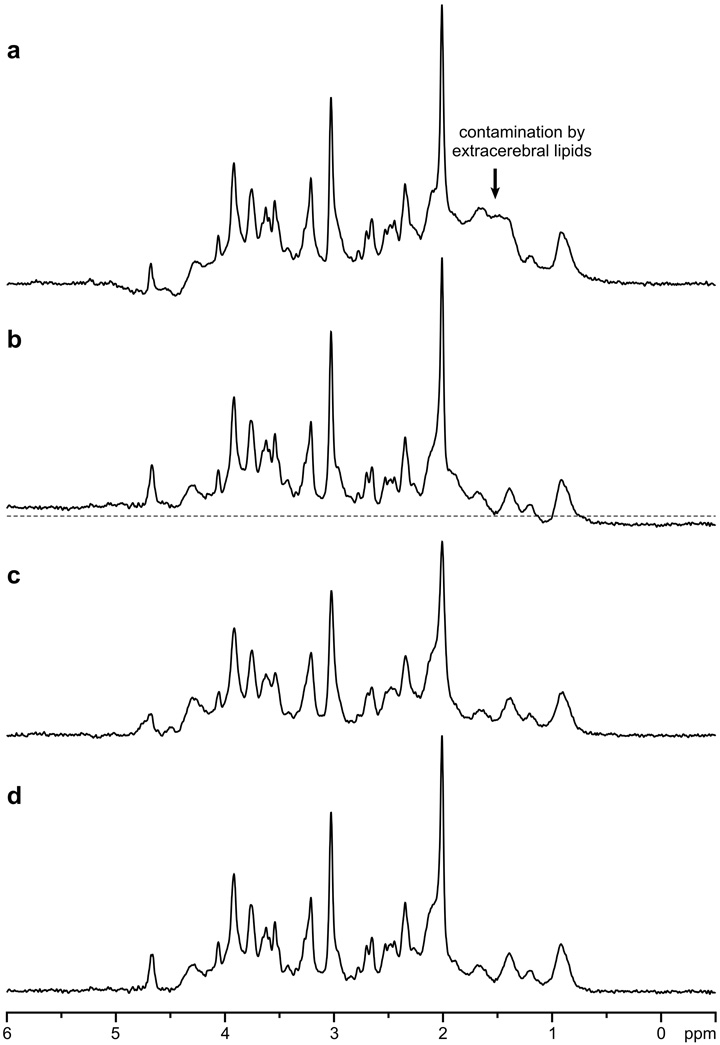
Turning off the outer volume suppression resulted in contamination of spectra by signals of subcutaneous lipids from outside of the VOI (Fig. 5a). The phase of those signals at 1.5 ppm was variable, depending on the distance between the VOI and lipid-containing tissue. Water suppression without OVS was not as efficient and usually resulted in baseline deformation near the water resonance. It was difficult to completely eliminate eddy current effects resulting from gradient switching, in spite of dedicated efforts using quantitative eddy current field mapping [27]. Experimentally measured spectra without postprocessing ECC exhibited modest line shape and baseline distortions at these extremely short echo times (Fig. 5b).
Fig. 5.
Effects of localization performance, ECC, and shimming on the spectral quality. STEAM, TE = 6 ms, TM = 32 ms, TR = 5 s, VOI = 8 ml, NT = 32, B0 = 7 T, human brainoccipital lobe. a OVS was turned off; b postprocessing ECC was not performed; c second-order shims were not used, linear shims were adjusted by FASTMAP; d reference spectrum (first- and second-order shims adjusted by FASTMAP, localization with STEAM and OVS, ECC performed). Gaussian multiplication (σ = 0.1 s) was applied.
3.7 Shimming
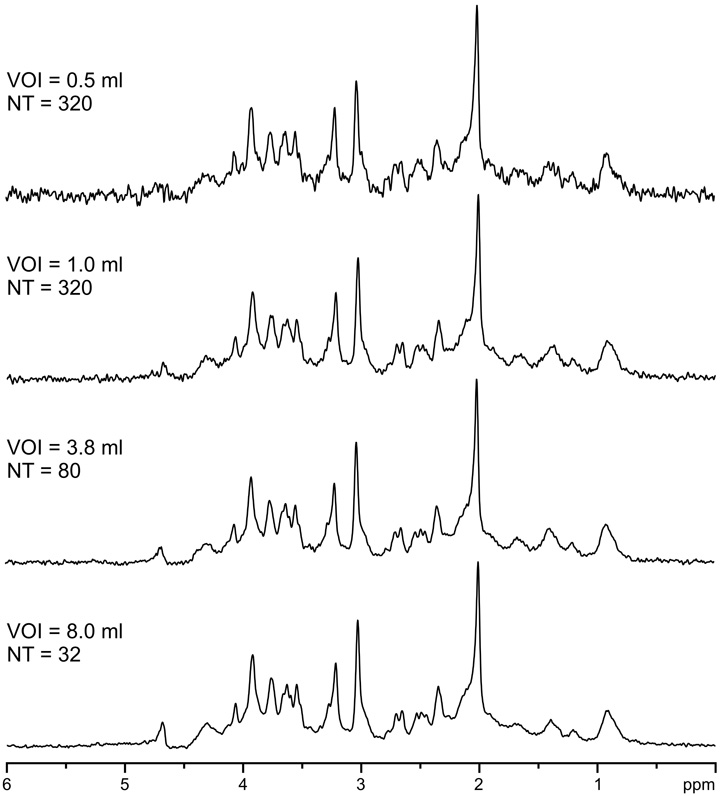
In addition to the localization performance of the sequence, shimming was extremely important to achieve a high spectral quality. The importance of the second-order shimming is demonstrated in Fig. 5c and d. Despite fine adjustment of first-order shims by FASTMAP, substantially increased line width relative to the reference spectrum was observed, when second-order shims were not used (Fig. 5c). Fully automatic B0 field mapping and adjustment of all first- and second-order shims (X, Y, Z, XZ, YZ, Z2, 2XY, X2 – Y2) by FASTMAP in combination with a strong second-order shim system (shim coils and shim drivers) provided high spectral resolution at a given field strength and particular brain location. This was confirmed by the observation (Fig. 6) that the signal line widths of metabolites were mostly independent of the size of the measured VOI (0.5–8.0 ml). Average demands for second-order shims in the occipital lobe at 7 T did not exceed 30% of their maximum strength. Performance of FASTMAP shimming and the resulting line widths were independent of the distance of VOI from the isocenter of the magnet. For example, VOIs in occipital lobe (half-volume RF coil) were positioned from 4 to 6 cm off-center along the Y-axis. In brain areas difficult to shim, such as frontal lobes, second-order shim values requested by FASTMAP were substantially higher, but still within the available shim range. In contrast, maximum strength of the second-order shim coils installed in the 4 T magnet were significantly weaker than the maximum strengths of the corresponding shim coils installed in our 7 T magnet. Therefore, the second-order shim system of the 4 T scanner was not strong enough to fully compensate field inhomogeneities in some brain regions, e.g., tissue structures close to brain stem.
Fig. 6.
Effect of the volume size on the spectral resolution at 7 T. STEAM, TE = 6 ms. TM = 32 ms, TR = 5 s, human brain gray-matter-rich occipital lobe. Processing: frequency correction, summation. Gaussian multiplication (tmax = 0.0 s, σ= 0.085 s), FFT, zero-order phase correction.
3.8 Metabolite Quantification
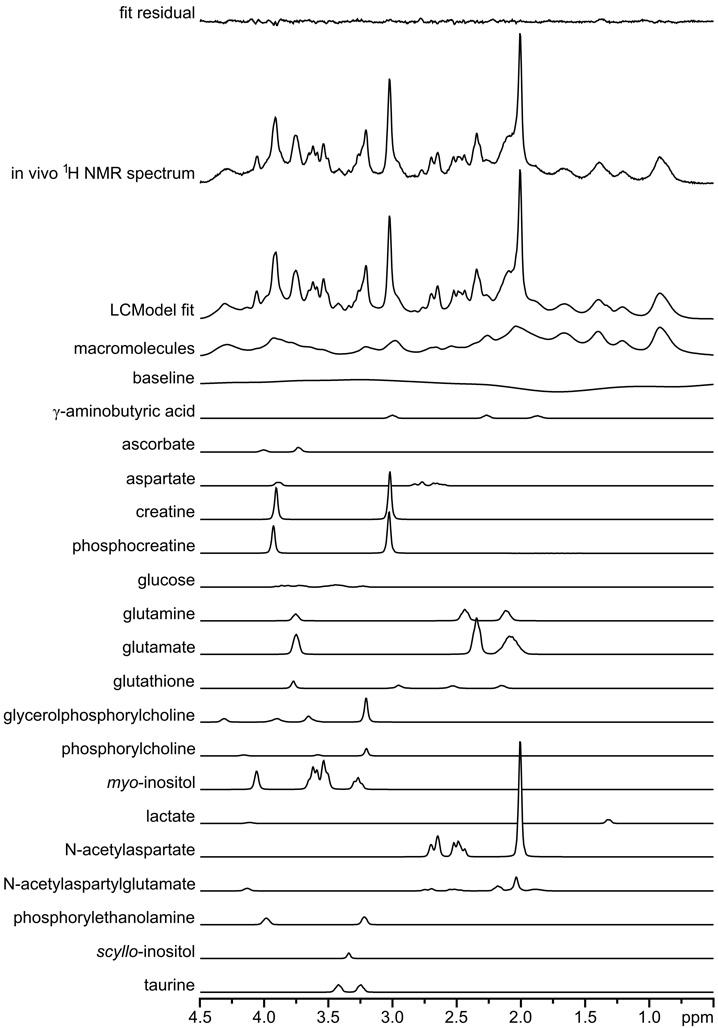
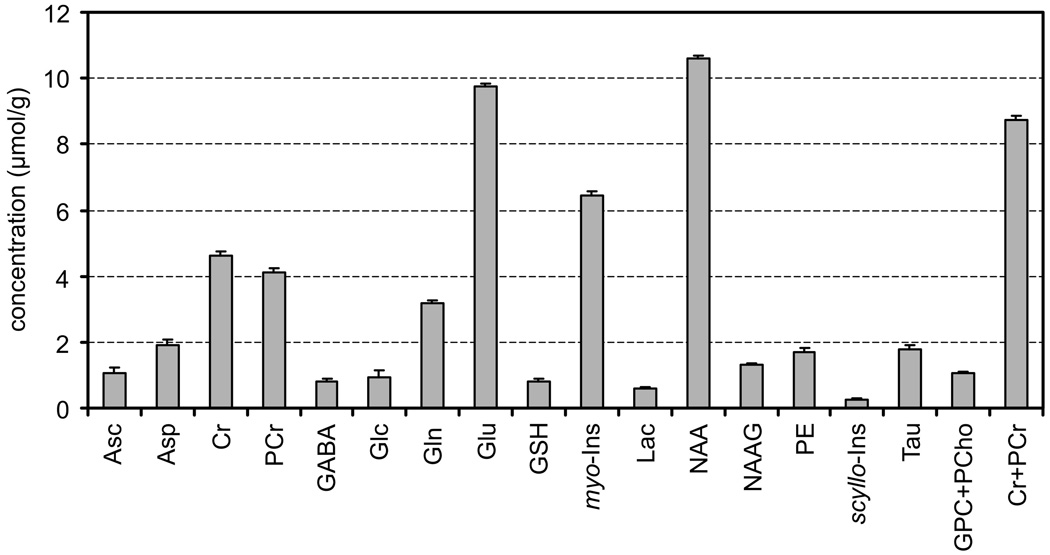
For the quantification of metabolite concentrations, LCModel was used as in our previous studies [11, 17, 24, 28, 29]. Results of the LCModel analysis of the 1H NMR spectrum from a human brain at 7 T (from Fig. 4) are shown in Fig. 7 to demonstrate the principle of this fitting method. The LCModel fit was calculated as a linear combination of model spectra from the LCModel basis set. Calculated metabolite concentrations and the estimated errors of the fitted values (Cramer-Rao lower bound, CRLB) are shown in Fig. 8. Alanine and glycine were not detected (CRLB >50%). Alanine and glycine were not detected (CRLB > 50%). The sum of GPC and PCho is shown in Fig. 8 because of a strong cross correlation between GPC and PCho caused by spectral similarity (as illustrated in Fig. 7). The averaged CRLB were below 0.2 µmol/g for all quantified metabolites (for VOI of 8 ml and NT of 160), which indicates the high precision and reliability of the metabolite quantification achievable at 7 T.
Fig. 7.
LCModel fit of an in vivo 1H NMR spectrum measured from the human brain (gray-matter-rich occipital lobe, Fig. 4) at 7 T. Figure illustrates the composition of the fitted spectrum as a linear combination of model spectra included in the LCModel database.
Fig. 8.
Concentrations of brain metabolites determined by LCModel analysis of the in vivo 1H NMR spectrum of the human brain (from Fig. 4 and Fig. 7). Error bars indicate estimated errors of metabolite quantification (Cramer—Rao lower bounds).
3.9 Routine Application of Spectroscopy at High Field
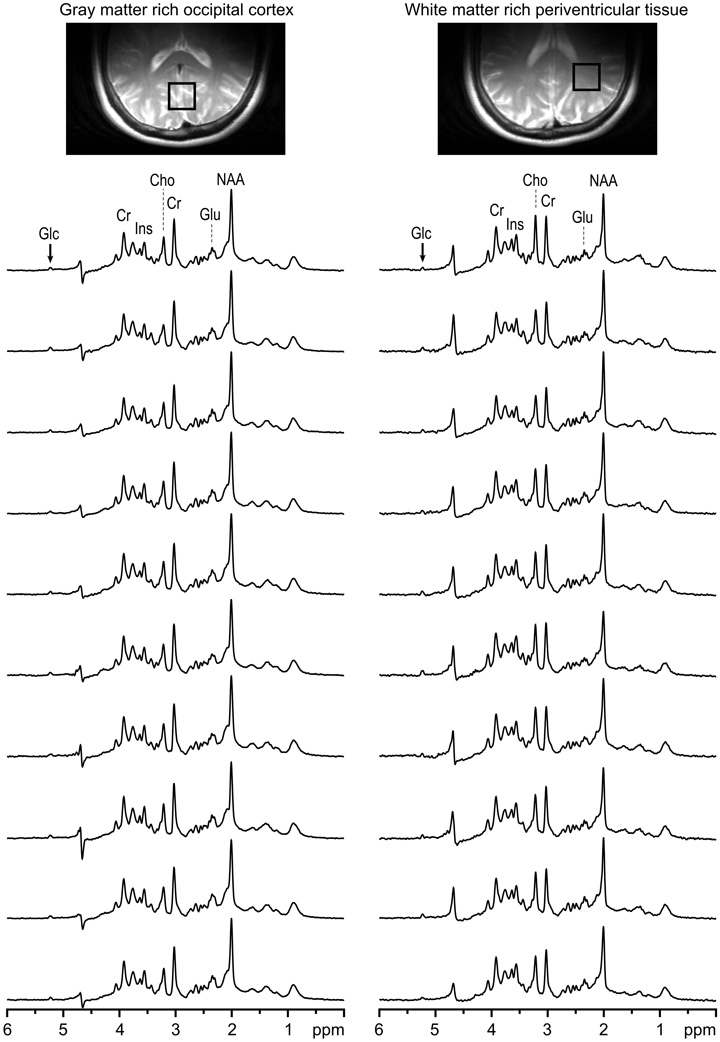
Routine use of the aforementioned spectroscopic technique at 4 T is illustrated in Fig. 9. In vivo 1H NMR spectra were taken from consecutive examinations of 10 different subjects (patients with diabetes and healthy controls) as part of a study focused on brain glucose quantification. The spectral quality was highly reproducible and operator-independent. The H-1 signal of α-D-glucose at 5.23 ppm shows the robustness of the VAPOR water suppression that suppressed an extremely strong water signal with high efficiency (Fig. 9).
Fig. 9.
In vivo 1H NMR spectra measured from gray-matter-rich occipital lobe (a) and periventricular white-matter-rich tissue (b) of 10 subsequent subjects at 4 T. The stack plot illustrates the high reproducibility of achieved spectral quality. STEAM, TE = 4 ms, TM = 42 ms, TR = 4.5 s, VOI = 15 ml, NT = 160, half-volume RF coil. Glucose intravenous infusion was applied during each study ([Glc]plasma,≈ 15 mM). First- and second-order shims, RF power, and water suppression parameters were adjusted and set fully automatically, which requires less than 2 min.
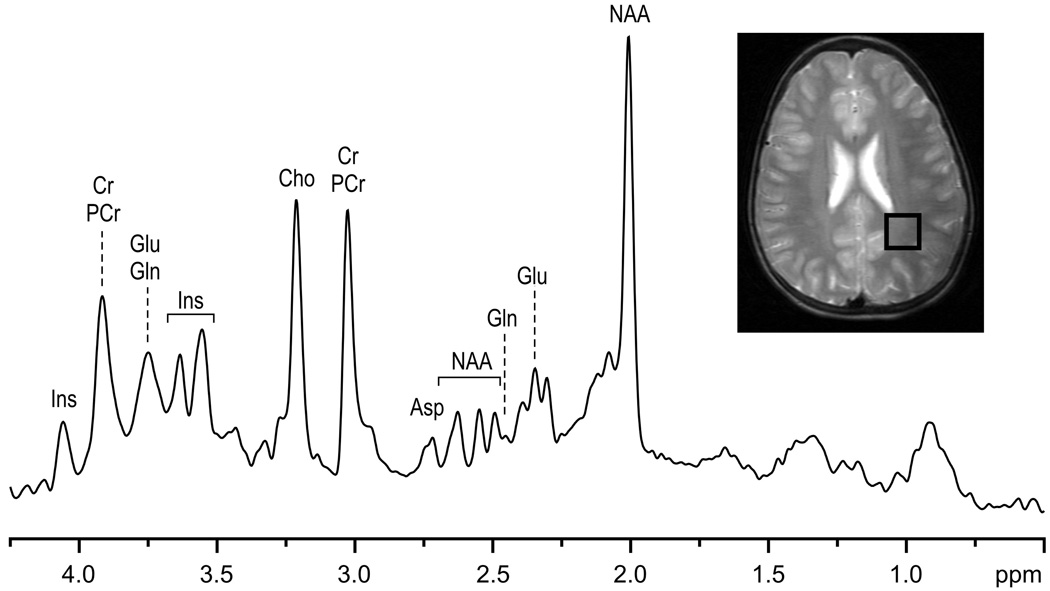
Another example illustrates the measurement of white-matter-rich periventricular tissue of a nonsedated child with a volume coil at 4 T (Fig. 10). Single-scan data averaging and subsequent frequency and phase corrections eliminated effects of the random motion of the pediatric patient during an experiment, which resulted in distortionless spectra and high spectral resolution.
Fig. 10.
In vivo 1H NMR spectrum measured from the brain of conscious (nonsedated) pediatric subject at 4 T with a TEM volume RF coil. STEAM, TE = 5 ms, TM = 43 ms, TR = 4.5 s, VOI = 15 ml, NT = 64. Data averaging: single-scan mode. Processing: frequency correction, ECC, Gaussian multiplication (tmax = 0.05, σ = 0.085), FFT, zero-order phase correction. Transverse RARE image (inset) shows the position of the VOI.
4 Discussion
The goal of in vivo NMR spectroscopy is a precise and accurate quantification of the highest possible number of tissue metabolites with a high spatial resolution in the shortest measurement time. Recent rapid technical developments, especially the construction of strong whole-body magnets, rendered in vivo NMR spectroscopy of humans at high magnetic field possible. However, NMR spectroscopy at high magnetic field brings about specific challenges that must be met to take advantage of the increased chemical shift dispersion and increased sensitivity. For example, localization performance of the sequence, that is to say the minimal chemical shift displacement error, the minimal contamination of spectra by signals from outside of the VOI, and the maximal gain of signal from selected VOI, are extremely important. In the present study, the chemical shift displacement error was reduced using the high bandwidth of RF pulses used for slice selection (STEAM, OVS), based on the highest peak B1 currently available on our human high-field MR scanners. With a half-volume RF coil and an 8 kW RF amplifier, a 4.5 kHz bandwidth was achievable at 7 T for the slice selection pulses in STEAM sequence, which reduced the displacement of the VOI to 20% in each linear dimension for signals separated by 3 ppm. For this reason, localization pulse sequences based on 90° pulses, such as STEAM, are advantageous at high fields. Another possibility to reduce the chemical shift displacement error is to use adiabatic RF pulses for the slice selection [30], band-widths of which depend on the frequency sweep during the pulse [31] at the expense of longer pulse duration and hence longer echo times.
Typically, the excitation profile of a 90° RF pulse used for slice selection is not ideal and can create nonzero transverse magnetization outside the dominant excitation bandwidth. This generates coherences outside of the VOI that have the same properties as the signal from VOI and thus cannot be subtracted by phase cycling. Contamination of the spectrum by unwanted signals from outside of the VOI, mostly by subcutaneous lipids, was suppressed in this study by using a combination of outer volume suppression and STEAM localization (Fig. 1). The effectiveness of such “double” localization to suppress signals of subcutaneous lipids was evident when OVS was turned off (Fig. 5).
The pulse sequence described in this paper (Fig. 1) was designed for ultrashort TE. The minimum achievable TE (4—6 ms) depended on the available peak B1 (which was RF-coil and amplifier-dependent) as well as on the static magnetic field B0. Differences in magnetic susceptibility between different tissues or between air and tissue resulted in greater field inhomogeneities and stronger local field gradients that increased the probability of unwanted magnetization being rephased during the acquisition. For this reason stronger crusher gradients had to be used at 7 T relative to 4 T, which limited the shortest possible TE (TEmin = 4 ms at 4 T, TEmin = 6 ms at 7 T). OVS reduced the overall demands on crusher gradients in STEAM to dephase unwanted coherences, which allowed the detection of uncontaminated single-scan spectra from the VOI in spite of a very short TE. Short TE of localization sequences is desirable due to shorter T2 relaxation times at high fields [3, 5]. An ultrashort echo time minimized the T2 relaxation and J-modulation of coupled spin systems, which significantly simplified absolute metabolite quantification. The ultrashort-echo-time STEAM sequence was optimized for 4 T (with surface RF coils as well as volume RF coils) and for 7 T with quadrature half-volume RF coils. Half-volume RF coils were capable to generate sufficiently high B1, however, at the expense of incomplete spatial coverage of the brain. The design of RF coils with volume coverage is challenging at 7 T (homogeneity of B1 distribution), but the performance of new transmit and receive transmission line array RF coils appears promising [32].
Efficient water suppression is demanding for in vivo 1H NMR spectroscopy. VAPOR water suppression optimized for 4 and 7 T routinely provided excellent suppression of the water signal, as demonstrated in Fig. 3, Fig. 4, Fig. 6, and Fig. 9. This technique is very robust and required only the correct setting of the frequency and the nominal RF power of VAPOR pulses. The nominal RF power was set automatically on the basis of the 90°-pulse calibration of STEAM, using a fixed relationship. The performance of the VAPOR water suppression is illustrated in Fig. 9, where spectra of 10 consecutive subjects measured at 4 T are shown. VAPOR routinely suppressed the water signal well below the amplitude of NAA, without affecting the glucose signal at 5.23 ppm.
Good localization performance and excellent water suppression resulted in highly reproducible single-scan spectra, without any significant contamination by unwanted coherences (Fig. 3). This makes the sequence much more robust in comparison to sequences that require phase cycling to subtract unwanted coherences. When depending on phase cycling for the elimination of such signals, instabilities during an experiment, e.g., physiological motion of a subject (Fig. 2), can result in subtraction errors and insufficient suppression of unwanted signals.
To achieve the highest possible spectral resolution, elimination of all effects that unnecessarily increased the line width was desirable. Physiological motion, such as breathing, can cause periodic frequency variations up to ±2 Hz at 7 T [33]. In addition, small random motions of the head during the study can induce phase fluctuations. Both effects were easily eliminated when single-scan data averaging was used (Fig. 2). Single-scan data averaging was extremely beneficial for nonsedated pediatric studies (Fig. 10), where the prevention of motion was difficult. However, the single-scan averaging approach is limited by the requirement of having sufficient SNR in single-scan spectrum (SNR of ≥3).
High spectral quality is desirable for reliable and reproducible quantification of metabolites. To achieve high spectral resolution at high fields, efficient shimming becomes increasingly important. First, nonlinear local field inhomogeneities cannot be corrected by linear shims only (Fig. 5) and require, at minimum, adjustment of second-order shims. Successful shimming required an efficient B0 mapping method and a shim system (shim coils and shim drivers) strong enough to compensate the field distortions in the VOI. In the present study, all first-and second-order shims were automatically adjusted by FASTMAP. On the 7 T system, the custom-designed second-order shim coil set was adequate to generate the required shim field strengths in most of the experiments. Efficient elimination of macroscopic field heterogeneity by shimming was experimentally demonstrated by showing that reducing the volume size did not result in any observable change in the signal line width (Fig. 6). Unfortunately, the shim coil set installed in the 4 T magnet was not strong enough to compensate for second-order field inhomogeneities in several brain regions. The FASTMAP shimming had minimal time requirements: first- and second-order shim adjustments with up to 4 iterations required less than 1 min. FASTMAP shimming resulted in a high reproducibility of spectral quality that was independent of the operator due to its completely automatic operation.
In spite of fine adjustment of gradient preemphasis, residual eddy current effect can cause line shape and/or baseline distortions (Fig. 5). Removal of residual eddy current effects using unsuppressed water signal further improved spectral quality because it eliminated not only small residual eddy current effects but it also eliminated the modulation of FIDs (antiphase satellites in spectra) caused by mechanical vibrations.
High spectral quality is a precondition for reliable metabolite quantification. The principle of LCModel analysis is illustrated in Fig. 7. According to our knowledge, spin simulation has not been used to generate LCModel basis set, although simulated prior knowledge was used for time-domain [34] and frequency-domain [35] data analysis. More than fifteen metabolites (termed “neu-rochemical profile”) were reliably quantified (with CRLB of <20%) from in vivo 1H NMR spectra of the human brain measured at 7 T (Fig. 8). For example, the increased chemical shift dispersion at 7 T provided improved discrimination between glutamate and glutamine (CRLB of <5% in this study) and enabled separate reliable quantification of each of these brain metabolites. Changes in the glutamate-to-glutamine ratio may indicate pathological processes and impaired glutamate-glutamine cycling between neurons and glia [28, 36]. Such a broad number of metabolites quantified noninvasively from a small volume in the brain is a hallmark of in vivo NMR spectroscopy at very high magnetic fields. Increased precision and reliability of metabolite quantification at high fields is likely not only to establish in vivo 1H NMR spectroscopy as an investigative tool to study the human brain but also to enhance the breadth of diagnostic applications.
5 Conclusions
High-field in vivo 1H NMR spectroscopy of the human brain is a powerful method for the noninvasive quantification of a number of brain metabolites. Currently it is possible to perform in vivo 1H NMR spectroscopy of humans at 4 and 7 T routinely with an automatic adjustment of sequence parameters that guarantees high reproducibility and high spectral quality.
Acknowledgements
The work was supported by NIH grants P41RR08079, R01NS38672, R01NS35192, M01RR00400, WM Keck and March of Dimes Birth Defects Foundations.
References
- 1.Wüthrich K. J. Biomol. NMR. 2003;27:13–39. doi: 10.1023/a:1024733922459. [DOI] [PubMed] [Google Scholar]
- 2.Riederer SJ. Radiology. 2004;231:628–631. doi: 10.1148/radiol.2313040114. [DOI] [PubMed] [Google Scholar]
- 3.Tkáč I, Andersen P, Adriany G, Merkle H, Uğurbil K, Gruetter R. Magn. Reson. Med. 2001;46:451–456. doi: 10.1002/mrm.1213. [DOI] [PubMed] [Google Scholar]
- 4.Terpstra M, Uğurbil K, Gruetter R. Magn. Reson. Med. 2002;47:1009–1012. doi: 10.1002/mrm.10146. [DOI] [PubMed] [Google Scholar]
- 5.Michaeli S, Garwood M, Zhu XH, DelaBarre L, Andersen P, Adriany G, Merkle H, Uğurbil K, Chen W. Magn. Reson. Med. 2002;47:629–633. doi: 10.1002/mrm.10135. [DOI] [PubMed] [Google Scholar]
- 6.Uğurbil K, Adriany G, Andersen P, Chen W, Garwood M, Gruetter R, Henry PG, Kim SG, Lieu H, Tkáč I, Vaughan T, Van De Moortele PF, Yacoub E, Zhu XH. Magn. Reson. Imaging. 2003;21:1263–1281. doi: 10.1016/j.mri.2003.08.027. [DOI] [PubMed] [Google Scholar]
- 7.Bottomley PA. Ann. N.Y. Acad. Sci. 1987;508:333–348. doi: 10.1111/j.1749-6632.1987.tb32915.x. [DOI] [PubMed] [Google Scholar]
- 8.Ordidge RJ, Mansfield P, Lohman JA, Prime SB. Ann. N.Y. Acad. Sci. 1987;508:376–385. doi: 10.1111/j.1749-6632.1987.tb32919.x. [DOI] [PubMed] [Google Scholar]
- 9.Frahm J, Bruhn H, Gyngell ML, Merboldt KD, Hanicke W, Sauter R. Magn. Reson. Med. 1989;9:79–93. doi: 10.1002/mrm.1910090110. [DOI] [PubMed] [Google Scholar]
- 10.Tkáč I, Starčuk Z, Choi IY, Gruetter R. Magn. Reson. Med. 1999;41:649–656. doi: 10.1002/(sici)1522-2594(199904)41:4<649::aid-mrm2>3.0.co;2-g. [DOI] [PubMed] [Google Scholar]
- 11.Tkáč I, Henry PG, Andersen P, Keene CD, Low WC, Gruetter R. Magn. Reson. Med. 2004;52:478–484. doi: 10.1002/mrm.20184. [DOI] [PubMed] [Google Scholar]
- 12.Tkáč I, Andersen P, Adriany G, Gruetter R, Uğurbil K. In: Grist TM, editor. Proceedings of the 7th Scientific Meeting of the International Society for Magnetic Resonance in Medicine; May 22–28, 1999; Philadelphia, Pennsylvania, USA. Philadelphia: ISMRM; 1999. [Google Scholar]
- 13.Tkáč I, Andersen P, Adriany G, Merkle H, Uğurbil K, Gruetter R. In: Moonen CT, editor. Proceedings of the 8th Scientific Meeting of the International Society for Magnetic Resonance in Medicine; April 4–7, 2000; Denver, Colorado, USA. Denver: ISMRM; 2000. p. 367. [Google Scholar]
- 14.Tkáč I, Gruetter R. In: Moonen CT, editor. Proceedings of the 8th Scientific Meeting of the International Society for Magnetic Resonance in Medicine; April 4–7, 2000; Denver, Colorado, USA. Denver: ISMRM; 2000. p. 1856. [Google Scholar]
- 15.Tkáč I, Seaquist ER, Gruetter R. In: Moonen CT, editor. Proceedings of the 8th Scientific Meeting of the International Society for Magnetic Resonance in Medicine; April 4–7, 2000; Denver, Colorado, USA. Denver: ISMRM; 2000. p. 1938. [Google Scholar]
- 16.Seaquist ER, Damberg GS, Tkáč I, Gruetter R. Diabetes. 2001;50:2203–2209. doi: 10.2337/diabetes.50.10.2203. [DOI] [PubMed] [Google Scholar]
- 17.Öz G, Tkáč I, Choi IY, Bjoraker KJ, Shapiro EG, Charnas LR, Gruetter R. Neurology. 2005;64:434–441. doi: 10.1212/01.WNL.0000150906.52208.E7. [DOI] [PubMed] [Google Scholar]
- 18.Gruetter R. Magn. Reson. Med. 1993;29:804–811. doi: 10.1002/mrm.1910290613. [DOI] [PubMed] [Google Scholar]
- 19.Gruetter R, Tkáč I. Magn. Reson. Med. 2000;43:319–323. doi: 10.1002/(sici)1522-2594(200002)43:2<319::aid-mrm22>3.0.co;2-1. [DOI] [PubMed] [Google Scholar]
- 20.Adriany G, Gruetter R. J. Magn. Reson. 1997;125:178–184. doi: 10.1006/jmre.1997.1113. [DOI] [PubMed] [Google Scholar]
- 21.Vaughan JT, Garwood M, Collins CM, Liu W, DelaBarre L, Adriany G, Andersen P, Merkle H, Goebel R, Smith MB, Uğurbil K. Magn. Reson. Med. 2001;46:24–30. doi: 10.1002/mrm.1156. [DOI] [PubMed] [Google Scholar]
- 22.Provencher SW. Magn. Reson. Med. 1993;30:672–679. doi: 10.1002/mrm.1910300604. [DOI] [PubMed] [Google Scholar]
- 23.Provencher SW. NMR Biomed. 2001;14:260–264. doi: 10.1002/nbm.698. [DOI] [PubMed] [Google Scholar]
- 24.Pfeuffer J, Tkáč I, Provencher SW, Gruetter R. J. Magn. Reson. 1999;141:104–120. doi: 10.1006/jmre.1999.1895. [DOI] [PubMed] [Google Scholar]
- 25.Govindaraju V, Young K, Maudsley AA. NMR Biomed. 2000;13:129–153. doi: 10.1002/1099-1492(200005)13:3<129::aid-nbm619>3.0.co;2-v. [DOI] [PubMed] [Google Scholar]
- 26.Klose U. Magn. Reson. Med. 1990;14:26–30. doi: 10.1002/mrm.1910140104. [DOI] [PubMed] [Google Scholar]
- 27.Terpstra M, Andersen PM, Gruetter R. J. Magn. Reson. 1998;131:139–143. doi: 10.1006/jmre.1997.1353. [DOI] [PubMed] [Google Scholar]
- 28.Tkáč I, Keene CD, Pfeuffer J, Low WC, Gruetter R. J. Neurosci. Res. 2001;66:891–898. doi: 10.1002/jnr.10112. [DOI] [PubMed] [Google Scholar]
- 29.Tkáč I, Rao R, Georgieff MK, Gruetter R. Magn. Reson. Med. 2003;50:24–32. doi: 10.1002/mrm.10497. [DOI] [PubMed] [Google Scholar]
- 30.Garwood M, DelaBarre L. J. Magn. Reson. 2001;153:155–177. doi: 10.1006/jmre.2001.2340. [DOI] [PubMed] [Google Scholar]
- 31.Tannus A, Garwood M. NMR Biomed. 1997;10:423–434. doi: 10.1002/(sici)1099-1492(199712)10:8<423::aid-nbm488>3.0.co;2-x. [DOI] [PubMed] [Google Scholar]
- 32.Adriany G, van de Moortele PF, Wiesinger F, Moeller S, Strupp JP, Andersen P, Snyder C, Zhang X, Chen W, Pruessmann KP, Boesiger P, Vaughan JT, Uğurbil K. Magn. Reson. Med. 2005;53:433–445. doi: 10.1002/mrm.20321. [DOI] [PubMed] [Google Scholar]
- 33.Van de Moortele PF, Pfeuffer J, Glover GH, Uğurbil K, Hu X. Magn. Reson. Med. 2002;47:888–895. doi: 10.1002/mrm.10145. [DOI] [PubMed] [Google Scholar]
- 34.Ratiney H, Coenradie Y, Cavassila S, van Ormondt D, Graveron-Demilly D. Magma. 2004;16:284–296. doi: 10.1007/s10334-004-0037-9. [DOI] [PubMed] [Google Scholar]
- 35.Soher BJ, Young K, Govindaraju V, Maudsley AA. Magn. Reson. Med. 1998;40:822–831. doi: 10.1002/mrm.1910400607. [DOI] [PubMed] [Google Scholar]
- 36.Daikhin Y, Yudkoff M. J. Nutr. 2000;130:1026S–1031S. doi: 10.1093/jn/130.4.1026S. [DOI] [PubMed] [Google Scholar]


