

Abstract
Lung cancer accounts for the most cancer-related deaths. The identification of cancer-associated genes and the related pathways are essential to prevent many types of cancer. In this paper, a more systematic approach is considered. First, we did pathway analysis using Hyper Geometric Distribution (HGD) and significantly overrepresented sets of reactions were identified. Second, feature-selection-based Particle Swarm Optimisation (PSO), Information Gain (IG) and the Biomarker Identifier (BMI) for the identification of different types of lung cancer were used. We also evaluated PSO and developed a new method to determine the BMI thresholds to prioritise genes. We were able to identify sets of key genes that can be found in several pathways. Experimental results show that our method simplifies features effectively and obtains higher classification accuracy than the other methods from the literature.
Keywords: lung cancer, microarrays, data mining, feature selection
1 Introduction
Lung cancer accounts for the most cancer-related deaths (29%) for men as well as for women and follows with a very poor prognosis – a 5-year survival rate of 15% (data for USA) (Jemal et al., 2008). The major types of lung cancer are small-cell and non-small-cell cancer. Non-small-cell cancer can be further divided into three major histological subtypes: squamous-cell carcinoma, adenocarcinoma and large-cell lung cancer (Herbst et al., 2009). The treatment of lung cancer depends on the cancer type and the stage of cancer including surgery, radiation therapy, chemotherapy and targeted biological therapies.
Biologists have known for a long time that the participation of certain genes in specific pathways is risk factors for multiple cancers. The identification of these genes and pathways is important since targeting them could provide an important possibility in the prevention of many types of cancer. Such genes include both oncogenes and onco-pathways that are amplified in cancers and activate the growth of tumours across different organs and tumour suppressor genes having the opposite effect (i.e., if active, they prevent multiple types of tumour growth and development) (Campbell et al., 2004).
DNA microarray technology enables the simultaneous monitoring of the expression of thousands of genes resulting in a high dimensionality of the data subject to being investigated. Changes in the expression levels of single genes during cancer development within a given cell population may be associated with cancer etiology and development (Hewett and Kijsanayothin, 2008). For extraction of those particular genes or features, however, sophisticated data-mining approaches are required. Feature selection, as an important step in the data-mining process, reduces dimensionality by searching for representative feature subsets with highly discriminatory ability.
Machine-learning techniques have been extensively used to analyse microarray data, particularly for diagnostic purposes related to cancer studies. A number of statistical tests have been employed for assessing differential gene expression and several ontological tools are available to support the biological interpretation of these data (Raynaud et al., 2007; Samuels et al., 2004). Most are based on the identification of significant associations of gene ontology terms with groups of genes, which do not directly reflect metabolic networks (Campbell et al., 2004). Besides this, gene expression data characteristically have a high dimension and few specimens, which make it difficult for general classification methods to be trained and tested. Thus, to analyse gene expression profiles correctly, proper feature (gene) selection approach is most crucial.
In general, feature selection methods can be classified into filters and wrappers (Baumgartner and Graber, 2007). Filter methods rank features based on a quality measure (merit) depending on the ability to distinguish between predefined classes (e.g., case vs. control group). Wrappers use accuracy estimates provided by machine-learning approaches to evaluate feature subsets. In general, feature subsets selected by wrappers are highly discriminatory, with the drawback of an extensive computational cost. Filters are more efficient but less accurate. The calculated merit – on the other hand – allows prioritising features, which is particularly important for biological interpretation purposes.
Especially for small-size data sets, there are significant differences in the ranking between different filter approaches owing to the diversity of the underlying statistical models (Netzer et al., 2009a). It is obvious that the underlying models learned from data include different types of errors. The bias-variance decomposition as defined by Geman et al. (1992) distinguishes between three types of errors: The bias error is a systematic component of the error. It results from differences between the learning method and the domain (Putten and Someren, 2004). The variance error results from differences between models of different samples. The sum of bias and variance is called total expected error of a learning method. The intrinsic error is due to the uncertainty in the domain and cannot be ‘learned’ (Witten and Frank, 2005).
Keeping in view the aforementioned limitations, we considered a novel approach. First, pathway analysis is used to identify the most relevant metabolic pathways associated with a subset of genes in a pathway (e.g., differentially expressed genes). For this purpose, we used the publicly accessible KEGG Ligand database to retrieve the metabolic pathway information and applied HGD to identify the subset genes. Then, we use Binary PSO, IG and the BMI (Quinlan, 1993) as feature selection methods. The IG computes the discriminatory ability of every feature based on an entropy measure. K-Nearest Neighbour (K-NN) clustering is used to rank the genes according to specific cancer type. Leave-One-Out Cross-Validation (LOOCV) serves as an evaluator of the PSO-based selection approach. A technique based on One-Vs.-Rest (OVR) serves to classify the features. Experimental results show that our method simplifies features effectively and obtains a higher classification accuracy compared with the other classification methods reported in the literature for oncogene identification (Hollstein et al., 1999; Pellegata et al., 1996).
The IG computes the discriminatory ability of every feature based on an entropy measure. The BMI, which was originally applied on metabolic data, combines various statistical measures to calculate an evaluation score for feature ranking. The strength of the BMI is the ability to clearly differ between primary, secondary and tertiary marker candidates with respect to their discriminatory ability. For the categorisation of genes into these three groups using BMI, we propose a new method relying on a k-means clustering approach.
2 Methods
2.1 Research data
In this study, we examined the gene expression data sets from GlaxoSmithKline (GSK), which had released the genomic profiling data for over 300 cancer cell lines via the National Cancer Institute’s cancer Bioinformatics Grid™ (caBIG™) (NCI, 2009). So, we used these data sets to describe the dimensionality of each cell line that provided sufficient metadata. This in turn enabled us to group them according to their phenotype. We normalised all the gene expression values using Dchips so as to effectively reduce the Support Vector Machine (SVM) training error, thereby improving accuracy for the classification problem as well as the performance (Goffard and Weiller, 2007). The data sets were, then, filtered and grouped according to their tissue type and their disease specification as shown in Table 1.
Table 1.
List of pre-processed gene sets for tissue type lung
| Disease | Samples | Total genes |
|---|---|---|
| Small-cell carcinoma | 65 | 8037 |
| Adenocarcinoma | 41 | 8037 |
| Squamous-cell | 34 | 16101 |
| Large-cell carcinoma | 37 | 7625 |
The investigated data set applied in this work comprises data of 177 individuals divided into different types of lung cancer: small-cell (n = 41), adenocarcinoma (n = 65), squamous-cell (n = 34) and large-cell cancer (n = 37). Formally, the data set can be described as a set of tuples T, where T = {(cj, m)|cj ∈ C, m ∈ M} with C = {small-cell cancer, adenocarcinoma, squamous-cell, large-cell cancer}, C is the set of class labels and M is the set of features (gene expressions).
The pathway models are built using directed graphs to model enzymatic reactions in the context of biological pathways. The data used to build this network is derived from the Compound, Reaction and Enzyme sections of the publicly available KEGG Ligand database (Kanehisa and Goto, 2000).
To link gene expression data to pathways, we use pre-computed assignments of the probe sets of supported genome arrays to EC numbers, identifying enzyme entries. These assignments are based on sequence similarities with proteins retrieved from the Swiss-Prot database. Blastx is used to find the best match for the sequences representing each probe set (Cheng et al., 2004; Draghici et al., 2003). If these entries have been annotated as an enzyme, the probe set is assigned to the corresponding EC number, extracted from its definition line. Note that probe sets that cannot be assigned to EC numbers are excluded from further analyses, and although this limits the number of usable probe sets, it also eliminates much of the ambiguity that arises from multiple (iso) genes encoding the same enzymatic function. This strategy can be applied to any set of sequences (Al-Shahrour et al., 2004; Ashburner et al., 2000).
The input we consider is a list of identifiers to which we assign an EC number according to pre-computed relationships. The proportion of EC numbers is then tested for every (sub) pathway. For each test, a P-value, representing the probability that the intersection of the given list with the list of enzymes belonging to the given set of reactions occurs by chance, is calculated using the HGD. Because multiple hypothesis tests are performed, it is necessary to correct these P-values. We use two adjustment methods namely the conservative Bonferroni correction method in which the P-values are multiplied by the number of comparisons and the less-stringent False Discovery Rate (FDR) approach defined as the determination of the expected proportion of false positive results among all rejected hypotheses.
2.2 Feature selection using Particle Swarm Optimisation
Feature Selection is a process of systematically reducing the dimensionality of a data set to an optimal subset of attributes for classification purpose. PSO is a population-based stochastic optimisation technique, which was developed by Kennedy and Eberhart in 1995 (Cho et al., 2001). In PSO, each single candidate solution referred to as a particle has a velocity, which directs its movement and a fitness function to be optimised. During movement, each particle adjusts its position according to its own experience and according to the experience of a neighbouring particle, thus making use of the best position encountered by itself and its neighbour. In this work, we use a binary version of a PSO algorithm (Kennedy and Eberhart, 1995). The position of each particle is given in a binary string form, which represents the feature selection situation.
The OVR method assembles k classifiers that distinguish each class from all the other classes. For each classifier i, l < I < k, a binary classifier separating class is built from the rest. To predict a class label of a given data point, the output of each of the k classifiers is obtained. If there is a unique class label, say j, which is consistent with all the k predictions, the data point is assigned to class j. Otherwise, one of the k classes is selected randomly. Very often though, a situation arises in which a consistent class assignment does not exist, which could potentially lead to problems (Kennedy and Eberhart, 1995). On the basis of the rules of PSO, we set the required particle number first, and then the initial coding alphabetic string for each particle is randomly produced. In our case, we coded each particle to imitate a chromosome in a genetic algorithm; each particle was coded to a binary alphabetic string S = F1, F2, …, n = 1, 2, …k, m, where the bit value {1} represents a selected feature, whereas the bit value {0} represents a non-selected feature.
The adaptive functional values were data based on the particle features representing the feature dimension; this data was measured by LOOCV. The feature subset obtained by PSO was classified by an SVM to obtain classification accuracy. SVM can decrease the training error and testing error, and increase the classification accuracy (Cho et al., 2001; Kennedy and Eberhart, 1995). The accuracy for the SVM evolves according to the K-fold Cross-Validation Method for small sample sizes, and according to the Holdout Method for big sample sizes (Kennedy and Eberhart, 1995, 1997; Frieß et al., 1998). Each particle renewal is based on its adaptive value. The best adaptive value for each particle renewal is pbest, and the best adaptive value within a group of pbest is gbest. Once pbest and gbest are obtained, each particle is updated according to equations (1) and (2). The feature before renewal is calculated in equation (1). The feature after renewal is calculated by the function (equation (2)).
| (1) |
| (2) |
If is larger than a randomly produced disorder number that is within the range (0, 1), then its position value Fn, n = 1, 2, …, m is represented as {1}. If is smaller than a randomly produced disorder number within {0~1}, then its position value Fn, n = 1, 2, …, m is represented as {0}. The inertia weight W was 0.9. The two factors rand1, rand2 and rand are random numbers between (0 and 1), whereas c1 and c2 are learning factors, usually c1 = c2 = 2. The fitness value of equation (1) evolves according to the LOOCV method for all data sets. Using the LOOCV method, a single observation from the original sample is selected as the validation data, and the remaining observations are selected as training data as shown in equation (2). This is repeated so that each observation in the sample is validated.
2.3 Feature selection using the Information Gain
The IG describes how well a given feature separates between two or more classes based on an entropy measure. The IG with respect to class cj can be defined as the difference between the entropy of class cj and the conditional entropy for class cj for a given feature fi. This means that the expected reduction of entropy caused by partitioning the data according to feature fi can be measured and used for feature ranking (Stone, 1974; Quinlan, 1993). More formally, the IG in feature F with relation to C is the mutual information between F and C (Baumgartner and Baumgartner, 2006):
2.4 Feature selection using the Biomarker Identifier
The BMI was developed for dichotomous test problems and combines various statistical measures to discern the discriminatory ability of features distinguishing between two classes of interest. The BMI score for a feature f, a variant of the initial method described in Baumgartner et al. (Quinlan, 1993), is defined as:
where λ is a scaling factor and TP2 is the product of the True Positive (TP) values determined for both classes using logistic regression analysis. The parameter Δdiff calculates relative changes in levels with respect to a reference group, and CVref/CV denotes changes in the variance of data across the two cohorts. x̄ is the mean value of levels in both classes. Using BMI for microarray data, a list of genes ranked by the BMI score is returned, representing the ability of genes to distinguish between both cohorts. Note that a positive Δdiff can be interpreted as over-expression, a negative Δdiff value as under-expression in the second class – compared with the chosen reference class – of a particular gene.
2.5 Gene categorisation
We propose a categorisation scheme into primary, secondary and tertiary candidate genes according to their discriminatory ability. Primary genes reflect high (positive as well as negative) alterations in their expression levels. The prioritisation into secondary and tertiary genes appears to be useful to distinguish between further promising candidates of which the latter group is more likely associated with secondary gene regulation pathways.
For the IG, we used empirical threshold scores greater than zero, greater than the half-maximum score and greater than two-thirds of the maximum score (see Table 2).
Table 2.
Thresholds for primary, secondary and tertiary gene sets using IG
| Categorisation of genes | IG |
|---|---|
| Primary | ≥0.67 |
| Secondary | 0.67 > IG ≥ 0.5 |
| Tertiary | 0.5 > IG > 0 |
To determine adequate thresholds for the BMI, we first created a histogram of computed BMI scores (see Figure 1). We assume that there are regions (or clusters) with ‘strong’ (high absolute BMI score values, grey area in Figure 1) and weak discriminating genes (low BMI absolute score values, black area in Figure 1). To discern such regions, we applied a partitioning clustering algorithm on absolute BMI scores to get symmetric cut-offs. In this work, we used the k-means algorithm (MacQueen, 1967; Hartigan and Wong, 1979) with k = 4 number of clusters (three clusters represent genes categorised into primary, secondary and tertiary genes, the cluster in the centre of the histogram represents genes with weak or no discrimination). K-means groups the data objects by minimising the sum of squared distances between each data point and its cluster representative based on an iterative procedure.
Figure 1.
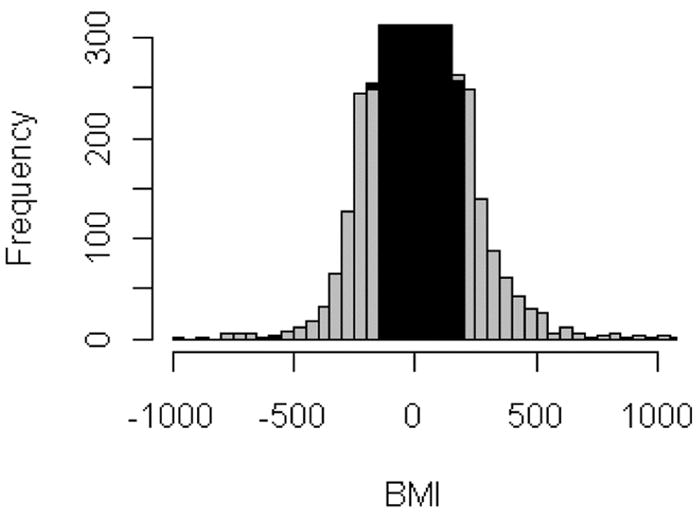
Histogram of calculated BMI scores (schematic illustration). Grey areas indicate BMI scores of genes with good or excellent discrimination where the black area in the middle represents BMI values of genes with weak or no discrimination
3 Results
As mentioned previously, the gene expression data were extracted from GSK data sets that had over 300 cancer cell lines. We were interested in performance analysis and identifying genes and pathways that affect carcinoma related to multiple tissue types. For pathway analysis, the input data consists of a list of genes of interest and their corresponding P-values.
We set a significance threshold and the adjustment method for multiple testing and generated the list of pathways that are significantly associated with the enzymes for a list of sequence identifiers. Metabolic pathways were ranked according to their P-values and probe list for each tissue type related to carcinoma produced a list of significant pathways. We used the GraphViz software (http://www.graphviz.org/) for visualisation of the pathway. On the basis of this analysis, we also identified Cell cycle, Focal adhesion, Cell Communication in all carcinoma types, but the significance of the ECM-receptor interaction varied in all the four diseases and the others remained the same in lung. We list the common set of pathways that were found in various carcinoma in lung using HGD in Table 3.
Table 3.
The common set of pathways found in lung
| List of pathways | P-value | Adjusted P-value |
|---|---|---|
| Cell cycle | 0.01979599 | 0.01943344 |
| Focal adhesion | 0.03168021 | 0.02700121 |
| Cell communication | 0.06763376 | 0.06432112 |
| Complement coagulation cascades | 0.08214713 | 0.08123411 |
| Small-cell lung cancer pathway | 0.10172219 | 0.10170001 |
| ECM-receptor interaction | 0.12925238 | 0.12824524 |
The calculated BMI thresholds for gene categorisation using the k-means approach are depicted in Table 4. The corresponding clusters and thresholds for BMI when comparing adenocarcinoma vs. small-cell lung cancer are shown in Figure 2. The identified number of primary, secondary and tertiary candidate genes using the BMI is depicted in Table 5.
Table 4.
Calculated BMI thresholds for primary, secondary and tertiary gene sets
| Categorisation of genes |
|||
|---|---|---|---|
| Reference vs. comparison group | Primary threshold | Secondary threshold | Tertiary threshold |
| Adenocarcinoma vs. small-cell | |BMI| ≥ 590 | 590 > |BMI| ≥ 170 | 170 > |BMI| ≥ 47 |
| Squamous-cell vs. adenocarcinoma | |BMI| ≥ 230 | 230 > |BMI| ≥ 90 | 90 > |BMI| ≥ 30 |
| Squamous-cell vs. large-cell | |BMI| ≥ 170 | 170 > |BMI| ≥ 50 | 50 > |BMI| ≥ 20 |
| Squamous-cell vs. small-cell | |BMI| ≥ 190 | 190 > |BMI| ≥ 90 | 90 > |BMI| ≥ 40 |
| Large-cell vs. adenocarcinoma | |BMI| ≥ 230 | 230 > |BMI| ≥ 80 | 80 > |BMI| ≥ 30 |
| Large-cell vs. small-cell | |BMI| ≥ 140 | 140 > |BMI| ≥ 60 | 60 > |BMI| ≥ 30 |
Figure 2.

(a) Identified clusters on the BMI scores using the k-means algorithm for adenocarcinoma vs. small-cell lung cancer and (b) the related histogram plot. Green: primary genes; black: secondary genes; blue: tertiary genes. In the left figure (a) the absolute BMI scores are displayed according to their sorted rank (index) (see online version for colours)
Table 5.
Number of identified genes using BMI and k-means cut-offs for different lung cancer types
| Categorisation of genes |
|||
|---|---|---|---|
| Reference vs. comparison group | Primary (n) | Secondary (n) | Tertiary (n) |
| Adenocarcinoma vs. small-cell | 79 | 1669 | 13173 |
| Squamous-cell vs. adenocarcinoma | 321 | 4707 | 17464 |
| Squamous-cell vs. large-cell | 100 | 6121 | 34390 |
| Squamous-cell vs. small-cell | 614 | 6677 | 24028 |
| Large-cell vs. adenocarcinoma | 253 | 4981 | 16911 |
| Large-cell vs. small-cell | 555 | 11058 | 25771 |
The IG lacked the ability to clearly categorise genes into the proposed scheme when using the clustering approach (Figure 3), resulting in a high number of primary genes (2531 primary gene candidates for adenocarcinoma vs. small-cell lung cancer, residual data not shown). This might be explained that IG scores do not follow roughly a Gaussian distribution (compare Figure 3(b)). Furthermore, the IG does not allow distinguishing between over- and under-expression, because the IG solely delivers absolute values.
Figure 3.
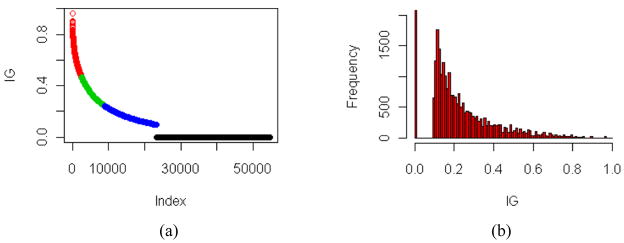
(a) Identified clusters on IG scores using the k-means clustering algorithm for adenocarcinoma vs. small-cell carcinoma (red: primary genes; green: secondary genes; blue: tertiary genes) and (b) the related histogram plot (see online version for colours)
We also compared experimental results obtained by methods from the literature and the proposed methods. Table 6 shows the comparison study for the various carcinoma data sets in lung, both the proposed PSO–SVM and BMI method obtained 100% classification accuracy in Adenocarcinoma. For the data sets of Adenocarcinoma, the classification accuracy via PSO–SVM is better than the classification accuracy of MC–SVMs and is comparable with the BMI and IG methods (Netzer et al., 2009b; Visvanathan et al., 2009). The classification accuracy of the Squamous-cell carcinoma and Small-cell carcinoma data set is 86.03% and 84.34%, respectively, an increase of 5% classification accuracy compared with methods using Non-SVMs and MC-SVMs.
Table 6.
Percent accuracy for gene classification data
| Non-SVM | MC-SVM | PSO-SVM | |||||
|---|---|---|---|---|---|---|---|
| Dataset | KNN | BMI | IG | OVR | OVO | DAG | OVR |
| Squamous-cell carcinoma | 81.51 | 84.33 | 81.11 | 80.3 | 82.34 | 81.36 | 86.03 |
| Small-cell carcinoma | 68.41 | 81.32 | 822 | 70.37 | 79.23 | 77.83 | 84.34 |
| Large-cell carcinoma | 83.21 | 97.01 | 95.2 | 97.34 | 91.23 | 97.23 | 98.57 |
| Adenocarcinoma | 72.21 | 100 | 98.01 | 84.1 | 87.2 | 89.51 | 100 |
4 Discussion and conclusion
In this work, we have conducted a comprehensive study wherein we performed pathway analysis using HGD to identify significant genes and pathways. We also compared gene expressions of different types of small-cell and non-small-cell lung cancer. We applied the feature selection methods IG and BMI to search for the best discriminating genes when comparing pairs of different cancer types and categorise them into primary, secondary and tertiary candidate genes. We also cross-validated the results obtained by using PSO–IG and BMI to perform feature selection. It turned out that fixed thresholds are inappropriate for categorising genes because the number of primary genes ranges from 0 to 615 for the different data sets when using empirical IG cut-offs. On the basis of this aspect, we developed a new method for adjusting thresholds using a k-means clustering approach.
The feature subset obtained by PSO–SVM, IG and BMI yields a high level of classification accuracy for gene expression profiles. Comparison with experimental results shows that our methods simplified the feature selection process and effectively reduces the total number of parameters needed, thereby obtaining higher classification accuracy compared with other MC–SVM classification methods.
Owing to the characteristics of roughly Gaussian distributed scores when using the PSO–SVM and BMI method, it excellently turns out the primary gene cluster, representing a range beyond the 99th percentile of calculated PSO–SVM and BMI scores. Furthermore, these methods are very useful to distinguish between over- and under-expressed genes. Interpreting the distribution of BMI scores, it also points out a general tendency to higher or lower over- or, respectively, under-expressed genes in a microarray experiment (see Figure 4).
Figure 4.
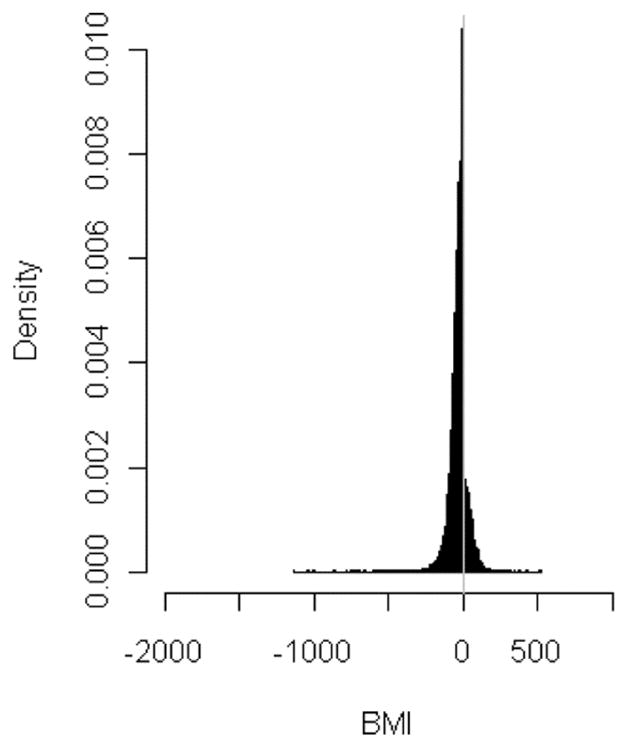
Histogram plot of BMI scores for comparing squamous-cell vs. adenocarcinoma indicating a higher ratio of under-expressed genes (BMI-scores < 0)
At this point, it is also important to map the top-ranking markers with their genes and biological pathways are important. Therefore, the pathway analysis using HGD (validates the top-ranked genes and the associated pathways (Nelson, 2005; Barriot et al., 2004). We found these genes to be part of Cell Communication, Focal adhesion, T cell receptor signalling pathway, ECM-receptor interaction pathway, Cell Cycle and P53 signalling pathways. The list of top-ranked gene names and their associated pathways by comparing squamous-cell lung carcinoma vs. large-cell lung carcinoma is shown in Table 7 (using BMI) and Table 8 (using IG). Focal adhesion, cell cycle, P53 signalling and ECM-receptors pathways play a significant role in small-cell lung cancer and non-small-cell lung cancer. These genes are involved in reducing the cell-cycle progression and degradation of resistance to apoptosis signals as observed in the small-cell lung cancer pathway models. Genes like collagen, cyclin d1 that have been identified as one of the key genes are also responsible for constitutively up-regulation in lung cancer cell lines. They have been found to be ecteinascidin 743 (ET-743; Yondelis, Trabectedin), a marine anticancer agent that induced long-lasting objective remissions and tumour control in a subset of patients with lung carcinoma. Hence, these primary genes identified through our approach can play a significant role in distinguishing various cancer types in lung.
Table 7.
Top ten ranked primary markers and pathways squamous-cell vs. large-cell using BMI
| Affymetrix ID | Gene name | Pathways involved |
|---|---|---|
| 37892_at | Collagen, type XI, alpha 1 | Cell Communication, Focal adhesion, ECM-receptor interaction |
| 242128_at | Orthodenticle homologue 2 | – |
| 204320_at | Collagen, type XI, alpha 1 | Cell Communication, Focal adhesion, ECM-receptor interaction, Cell cycle |
| 243610_at | Otthump00000021439 | – |
| 206422_at | Glucagon | – |
| 1564359_a_at | Similar to hypothetical protein FLJ36492 | – |
| 206378_at | n/a | – |
| 219612_s_at | Fibrinogen gamma chain | Complement Coagulation cascades, Small cell lung cancer |
| 229271_x_at | n/a | – |
| 210602_s_at | n/a | – |
Table 8.
Top ten ranked primary markers and pathways squamous-cell vs. large-cell using IG
| Affymetrix ID | Gene name | Pathways involved |
|---|---|---|
| 217900_at | Isoleucyl-tRNA synthetase 2, mitochondrial | Valine, leucine and isoleucine biosynthesis, Aminoacyl-tRNA biosynthesis |
| 235072_s_at | n/a | – |
| 211988_at | Swi/snf related, matrix associated, actin dependent regulator of chromatin, subfamily e, member 1 | Chromatin Remodelling by hSWI/SNF ATP-dependent Complexes, Control of Gene Expression by Vitamin D Receptor |
| 218820_at | Chromosome 14 open reading frame 132 | – |
| 209177_at | Chromosome 3 open reading frame 60 | – |
| 208711_s_at | Cyclin d1 | Cell cycle, p53 signalling pathway, Wnt signalling pathway, Focal adhesion, Small-cell lung cancer, Non-small-cell lung cancer |
| 212614_at | At rich interactive domain 5b (mrf1-like) | – |
| 226609_at | Discoidin, cub and lccl domain containing 1 | – |
| 222572_at | Protein phosphatase 2c, magnesium-dependent, catalytic subunit | – |
| 218754_at | Nucleolar protein 9 | – |
In order to cross validate our results we would be conducting western plots experiments to identify the probed gene expression profiles and corresponding protein levels similar profiling of the tumour tissues from mouse and human tumours would further validate findings from BMI and IG. An additional level of validation could involve pharmacologically treating the cells with known anti-tumour agents and profiling the same genes to determine potential efficacy. The biological studies might confirm the accuracy of the informatics tools developed and also point towards selective biomarkers that may be of significance in diagnostic and prognostic applications.
Using IG and BMI, we were able to identify sets of key genes, which can be found in several pathways. Especially, the BMI combined with our dynamic thresholds is well suited for analysing microarray experiments and therefore we propose BMI as a powerful tool for the exploration of new and so far undiscovered genes associated with cancer.
In our future work, we intend to further study the predictive value of discovered gene sets to aid in risk prediction in lung cancer.
Acknowledgments
This publication was made possible by grant number P20 RR016475 from the National Center for Research Resources (NCRR), a component of the National Institutes of Health (NIH) and the Austrian GEN-AU project Bioinformatics Integration Network.
Biographies
Mahesh Visvanathan did his BS and M.S in Computer Science in India during 1996–2001. He had his Predoctoral training in Bioinformatics/Systems Biology in UMIT, Hall in Tyrol, Austria, during 2004–2006. From 2006–2008, he had his postdoc training at DKFZ, Heidelberg Germany and worked as a research track faculty at LUMC, Chicago, USA. From June 2008 to till date, he is working as a Bioinformatics Specialist, Courtesy Assistant Professor at EECS, KU Lawrence and Research Asst Professor at KUMC. He is a reviewer for Journal of Biomedical Informatics, Computer Methods and Programs in Biomedicine and IEEE Journal on selected topics in signal processing. His research work has been supported by National Institutes of Health and Loyola University of Chicago.
Michael Netzer is a Research Assistant. He received his BSc and Dipl.-Ing. Degrees in Biomedical Informatics from UMIT – University for Health Sciences, Medical Informatics and Technology in 2005 and 2007. In 2007, he worked as a Research Assistant at the University for Health Sciences, Medical Informatics and Technology.
Michael Seger is a Research Associate Professor of Bioinformatics, Mechanical and Electrical Biomedical Engineering. He received his Doctorate in Bioinformatics from UMIT – The Health and Life Sciences University, Austria in 2007. In 2002, he earned a Dipl.-Ing. in Electrical and Bioengineering from Technical University Graz, Austria. He worked as a Research and Academical Teaching Associate Professor in the Department of Biomedical Sciences and Engineering at UMIT, Hall in Tyrol, Austria. Since 2005–2007, he worked as a Sales and Key-Account Manager (Pharmaceutical Cleanroom Equipment and Support), Ortner Cleanrooms, Villach, Austria. From 2002–2005, he was a Research Junior Scientist in the Institute of Biomedical Engineering, UMIT, Hall in Tyrol, Austria.
Bhargav S. Adagarla works as a Graduate Research Assistant for the Bioinformatics Core Facility, University of Kansas. He received his Bachelor of Engineering Degree from Osmania University, India and is currently a Graduate student in the EECS Department, University of Kansas.
Dr. Christian Baumgartner received his Master’s Degree and PhD from Graz University of Technology and has worked as Research Assistant at the General Department of Radiology, Graz Medical University. He has also worked as a R&D systems engineer at Tecan Austria GmbH, Salzburg. He is currently the Professor and head of the Institute of Electrical, Electronic and Bioengineering, UMIT. He also holds a Diploma in Study of Sacred Music from Conservatory of Graz.
Dr. Sitta Sittampalam received his PhD in Chemistry from the Univ. of Arizona, Tucson in 1982. He has served as the head of Lilly’s Lead Optimization Biology Laboratory and as a Senior Research Advisor of the cell technology group. He is currently the Deputy Director of the Institute for Advancing Medical Innovation at the University of Kansas Cancer Center and a Professor at the Department of Pharmacology, Toxicology and Therapeutics, University of Kansas School of Medicine.
Dr. Gerald H. Lushington received his Bachelors in Science (Chemistry and Mathematics) and his Doctoral Degree in Theoretical Chemistry from the University of New Brunswick, Canada. He has worked as a Resident Research Associate at the US Army Research Laboratory, Maryland and as a Scientific Specialist at the Ohio Supercomputer Center, Ohio. He is currently the Director of the Molecular Graphics and Modeling Laboratory and a Courtesy Associate Professor of Medicinal Chemistry, at the University of Kansas.
Footnotes
Website
Contributor Information
Mahesh Visvanathan, Email: mvisvanathan@ku.edu, Bioinformatics Core Facility, University of Kansas Lawrence, KS 66047, USA.
Michael Netzer, Email: michael.netzer@umit.at, Institute of Electrical, Electronic and Bioengineering, Department of Biomedical Sciences and Engineering, University for Health Sciences, Medical Informatics and Technology (UMIT), A-6060 Hall in Tirol, Austria.
Michael Seger, Institute of Electrical, Electronic and Bioengineering, Department of Biomedical Sciences and Engineering, University for Health Sciences, Medical Informatics and Technology (UMIT), A-6060 Hall in Tirol, Austria.
Bhargav S. Adagarla, Email: bhargav@ku.edu, Bioinformatics Core Facility, University of Kansas Lawrence, KS 66047, USA
Christian Baumgartner, Email: christian.baumgartner@umit.at, Institute of Electrical, Electronic and Bioengineering, Department of Biomedical Sciences and Engineering, University for Health Sciences, Medical Informatics and Technology (UMIT), A-6060 Hall in Tirol, Austria, Fax: +43 50 8548 673827.
Sitta Sittampalam, Email: sitta@kumc.edu, Therapeutics Discovery and Development, University of Kansas, Lawrence, KS, USA.
Gerald H. Lushington, Email: glushington@ku.edu, Bioinformatics Core Facility, University of Kansas Lawrence, KS 66047, USA
References
- Al-Shahrour F, Diaz-Uriarte R, Dopazo J. FatiGO: a web tool for finding significant associations of gene ontology terms with groups of genes. Bioinformatics. 2004;20:578–580. doi: 10.1093/bioinformatics/btg455. [DOI] [PubMed] [Google Scholar]
- Ashburner M, Ball CA, Blake JA, Botstein D, Butler H, Cherry JM, Davis AP, Dolinski K, Dwight SS, Eppig JT, Harris MA, Hill DP, Issel-Tarver L, Kasarskis A, Lewis S, Matese JC, Richardson JE, Ringwald M, Rubin GM, Sherlock G. Gene ontology: tool for the unification of biology’. The Gene Ontology Consortium. Nat Genet. 2000;25:25–29. doi: 10.1038/75556. [DOI] [PMC free article] [PubMed] [Google Scholar]
- Barriot R, Poix J, Groppi A, Barre A, Goffard N, Sherman D, Dutour I, de Daruvar A. New strategy for the representation and the integration of biomolecular knowledge at a cellular scale. Nucleic Acids Res. 2004;32:3581–3589. doi: 10.1093/nar/gkh681. [DOI] [PMC free article] [PubMed] [Google Scholar]
- Baumgartner C, Baumgartner D. Biomarker discovery, disease classification, and similarity query processing on high-throughput ms/ms data of inborn errors of metabolism. J Biomol Screen. 2006;11:90–99. doi: 10.1177/1087057105280518. [DOI] [PubMed] [Google Scholar]
- Baumgartner C, Graber A. Data mining and knowledge discovery in metabolomics. In: Masseglia F, Poncelet P, Teisseire M, editors. Successes and New Directions in Data Mining. IGI Global; Hershey, PA: 2007. pp. 141–166. [Google Scholar]
- Campbell IG, Russell SE, Choong DY, Montgomery KG, Ciavarella ML, Hooi CS, Cristiano BE, Pearson RB, Phillips WA. Mutation of the pik3ca gene in ovarian and breast cancer. Cancer Res. 2004;64:7678–7681. doi: 10.1158/0008-5472.CAN-04-2933. [DOI] [PubMed] [Google Scholar]
- Cheng J, Sun S, Tracy A, Hubbell E, Morris J, Valmeekam V, Kimbrough A, Cline MS, Liu G, Shigeta R, Kulp D, Siani-Rose MA. NetAffx gene ontology mining tool: a visual approach for microarray data analysis. Bioinformatics. 2004;20:1462–1463. doi: 10.1093/bioinformatics/bth087. [DOI] [PubMed] [Google Scholar]
- Cho RJ, Huang M, Campbell MJ, Dong H, Steinmetz L, Sapinoso L, Hampton G, Elledge SJ, Davis RW, Lockhart DJ. Transcriptional regulation and function during the human cell cycle. Nat Genet. 2001;27:48–54. doi: 10.1038/83751. [DOI] [PubMed] [Google Scholar]
- Draghici S, Khatri P, Bhavsar P, Shah A, Krawetz SA, Tainsky MA. Onto-tools, the toolkit of the modern biologist: onto-express, onto-compare, onto-design and onto-translate. Nucleic Acids Res. 2003;31:3775–3781. doi: 10.1093/nar/gkg624. [DOI] [PMC free article] [PubMed] [Google Scholar]
- Frieß T, Cristianini N, Campbell C. The kernel-adatron: a fast and simple learning procedure for support vector machines. Proceedings of the Fifteenth International Conference on Machine Learning; Heidelberg, Germany. 1998. pp. 188–196. [Google Scholar]
- Geman S, Bienenstock E, Doursat R. Neural networks and the bias/variance dilemma. Neural Computation. 1992;4:1–58. [Google Scholar]
- Goffard N, Weiller G. GeneBins: a database for classifying gene expression data, with application to plant genome arrays. BMC Bioinformatics. 2007;8:87. doi: 10.1186/1471-2105-8-87. [DOI] [PMC free article] [PubMed] [Google Scholar]
- Hartigan JA, Wong MA. A k-means clustering algorithm. JR Stat Soc Ser C-Appl Stat. 1979;28:100–108. [Google Scholar]
- Herbst RS, Heymach JV, Lippman SM. Lung cancer. N Engl J Med. 2009;360:87–88. doi: 10.1056/NEJMra0802714. [DOI] [PMC free article] [PubMed] [Google Scholar]
- Hewett R, Kijsanayothin P. Tumor classification ranking from microarray data. BMC Genomics. 2008;9:9–32. doi: 10.1186/1471-2164-9-S2-S21. [DOI] [PMC free article] [PubMed] [Google Scholar]
- Hollstein M, Sidransky D, Vogelstein B, Harris CC. p53 mutations in human cancers. Science. 1999;253:49–53. doi: 10.1126/science.1905840. [DOI] [PubMed] [Google Scholar]
- Jemal A, Siegel R, Ward E, Hao Y, Xu J, Murray T, Thun MJ. Cancer statistics. CA Cancer J Clin. 2008;58:71–96. doi: 10.3322/CA.2007.0010. [DOI] [PubMed] [Google Scholar]
- Kanehisa M, Goto S. KEGG: kyoto encyclopedia of genes and genomes. Nucleic Acids Res. 2000;28:27–30. doi: 10.1093/nar/28.1.27. [DOI] [PMC free article] [PubMed] [Google Scholar]
- Kennedy J, Eberhart RC. Particle swarm optimization. in proceedings of the 1995. IEEE International Conference on Neural Networks. 1995;4:1942–1948. [Google Scholar]
- Kennedy J, Eberhart RC. A discrete binary version of the particle swarm algorithm. Systems, Man, and Cybernetics Computational Cybernetics and Simulation 1997 IEEE International Conference; 5, 12–15 October; 1997. pp. 4104–4108. [Google Scholar]
- MacQueen JB. Some methods for classification and analysis of multivariate observations. Proceedings of 5-th Berkeley Symposium on Mathematical Statistics and Probability; Berkeley: University of California Press; 1967. pp. 281–297. [Google Scholar]
- NCI. 2009. https://array.nci.nih.gov/caarray/project/details.action?project.experiment.PublicIdentifier=woost-00041#; last visited on 9th April, 2009.
- Nelson JD. Finding useful questions: on Bayesian diagnosticity, probability, impact, and information gain. Psychol Rev. 2005;112:979–999. doi: 10.1037/0033-295X.112.4.979. [DOI] [PubMed] [Google Scholar]
- Netzer M, Millonig G, Osl M, Pfeifer B, Praun S, Villinger J, Vogel W, Baumgartner C. A new ensemble-based algorithm for identifying breath gas marker candidates in liver disease using ion molecule reaction mass spectrometry (IMR-MS) Bioinformatics. 2009a;25:941–947. doi: 10.1093/bioinformatics/btp093. [DOI] [PubMed] [Google Scholar]
- Netzer M, Seger M, Visvanathan M, Lushington GH, Pfeifer B, Baumgartner C. Filter based approaches for selecting significant genes between various cancer types in lung, ICBB 2009. International Conference on Bioinformatics and Biomedicine; Venice, Italy. 2009b. pp. 301–305. [Google Scholar]
- Pellegata NS, Ranzani GN. The significance of p53 mutations in human cancers. Eur J Histochem. 1996;40:273–282. [PubMed] [Google Scholar]
- Putten P, Someren M. A bias-variance analysis of a real world learning problem: the coil challenge 2000. Machine Learning. 2004;57:177–195. [Google Scholar]
- Quinlan RJ. C4.5: Programs for Machine Learning. Morgan Kaufmann; San Francisco: 1993. [Google Scholar]
- Raynaud F, Eccles IS, Clarke PA, Hayes A, Nutley B, Kaizawa H, Koizumi T, Ohishi T, Saghir N, Parker P, Waterfield M, Workman P. Pharmacologic characterization of a potent inhibitor of class I phosphatidylinositide 3-kinases. Cancer Res. 2007;67:5840–5850. doi: 10.1158/0008-5472.CAN-06-4615. [DOI] [PubMed] [Google Scholar]
- Samuels Y, Wang Z, Bardelli A, Silliman N, Ptak J, Szabo S, Yan Y, Gazdar A, Vogelstein B, Velculescu VE. High frequency of mutations of the pik3ca gene in human cancers. Science. 2004;304:554. doi: 10.1126/science.1096502. [DOI] [PubMed] [Google Scholar]
- Stone M. Cross-validation choice and assessment of statistical predictions. Journal of the Royal Statistical Society B. 1974;36:111–147. [Google Scholar]
- Visvanathan M, Srinivas AB, Lushington G, Sittapalam S. Systematically identifying genes and pathways in multiple cancer types using HGD & PSO-SVM. Bioinformatics, Systems Biology and Intelligent Computing. 2009;3:494–497. [Google Scholar]
- Witten IH, Frank E. Data Mining: Practical Machine Learning Tools and Techniques. 2. Morgan Kaufmann Publishers Inc; San Francisco, CA, USA: 2005. [Google Scholar]