Abstract
The inositol 1,4,5-trisphosphate receptor (InsP3R) is the main calcium(Ca2+) release channel in most tissues. Three isoforms have been identified1–6, but only types I and II InsP3R have been characterized7,8. Here we examine the functional properties of the type III InsP3R because this receptor is restricted to the trigger zone from which Ca2+ waves originate9–11 and it has distinctive InsP3-binding properties12,13. We find that type III InsP3R forms Ca2+ channels with single-channel currents that are similar to those of type I InsP3R; however, the open probability of type III InsP3R isoform increases monotonically with increased cytoplasmic Ca2+ concentration, whereas the type I isoform has a bell-shaped dependence on cytoplasmic Ca2+. The properties of type III InsP3R provide positive feedback as Ca2+ is released; the lack of negative feedback allows complete Ca2+ release from intracellular stores. Thus, activation of type III InsP3R in cells that express only this isoform results in a single transient, but global, increase in the concentration of cytosolic Ca2+. The bell-shaped Ca2+-dependence curve of type I InsP3R is ideal for supporting Ca2+ oscillations, whereas the properties of type III InsP3R are better suited to signal initiation.
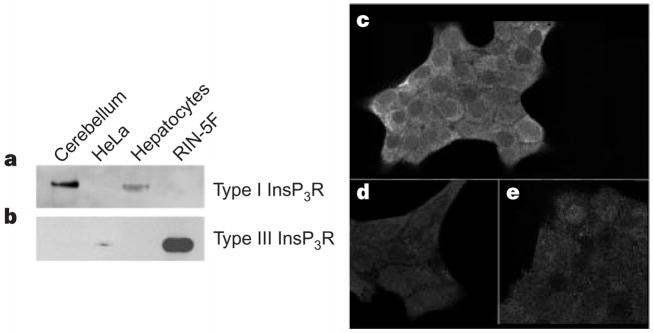
When homogenates from RIN-5F cells, rat hepatocytes, and canine cerebellum were probed by western blot analysis with isoform-specific antibodies, RIN-5F cells contained no detectable type I InsP3R (Fig. 1a, lane 4) but did express type III InsP3R (Fig. 1b, lane 4). In contrast, both hepatocytes and cerebellum expressed type I InsP3R (Fig. 1a, lanes 1 and 3), but no detectable type III InsP3R (Fig. 1b, lanes 1 and 3). Thus, the InsP3R of RIN-5F cells is almost entirely the type III isoform, consistent with previous reports14. Immunocytochemistry demonstrated that type III InsP3R was diffusely distributed (Fig. 1c) and confirmed that type I InsP3R expression was minimal (Fig. 1d, e). These findings do not support a previous prediction that type III InsP3R is preferentially localized near the plasma membrane15.
Figure 1.
RIN-5F cells preferentially express Type III InsP3R. a, b, Western blots were probed for types I and III InsP3R (a and b, respectively). Dog cerebellum and rat hepatocytes were positive controls for type I InsP3R; HeLa cells were a positive control for type III InsP3R. Lanes were loaded with 30 μg dog cerebellar microsomes (lane 1), 10 μg HeLa cell lysate (lane 2), 30 μg hepatic microsomes (lane 3), and either 30 μg (a) or 5 μg (b) of RIN-5F microsomes (lane 4). c, e, Cellular distribution of type III (c) and type I (e) InsP3R in RIN-5F cells. d, Nonspecific binding.
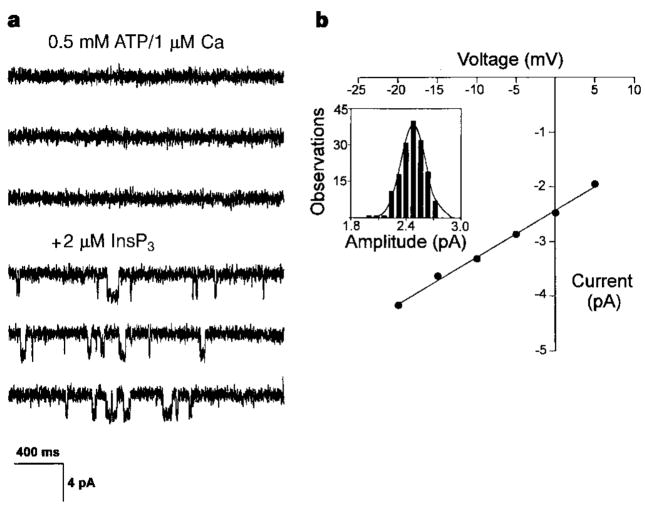
To test whether type III InsP3R forms a Ca2+ channel, we incorporated endoplasmic reticulum vesicles from cultured RIN-5F cells into planar lipid bilayers. Single-channel currents were observed through type III InsP3R. Like type I InsP3R, type III InsP3R required InsP3 to open (Fig. 2a: compare top three and bottom three traces). The single-channel current of type III InsP3R measured at 0 mV with 55 mM Ba2+ on the lumenal side of the channel was ~2.5 pA, which is similar to that of type I InsP3R (ref. 7). The conductances of type III InsP3R (88 ± 4 pS; Fig. 2b) and type I InsP3R (85 ± 3 pS)7 were also similar.
Figure 2.
Type III InsP3R is an InsP3-gated Ca2+ channel. a, InsP3-gated Ca2+ channels from endoplasmic reticulum of RIN-5F cells in planar lipid bilayers. In the absence of InsP3, channel activity was not observed (top three traces). Addition of 2 μM InsP3 to the cytoplasmic side induced channel activity (bottom three traces). Channel openings are shown as downward deflections from baseline. Ruthenium red (2 μM) was present to block ryanodine receptors. b, Current–voltage relationship of type III InsP3R. Inset shows an amplitude histogram at 0 mV for one experiment. Values plotted in the I–V curve represent the mean for three experiments. Standard errors for data points, which range from 0.02 to 0.05 pA, are too small to be seen.
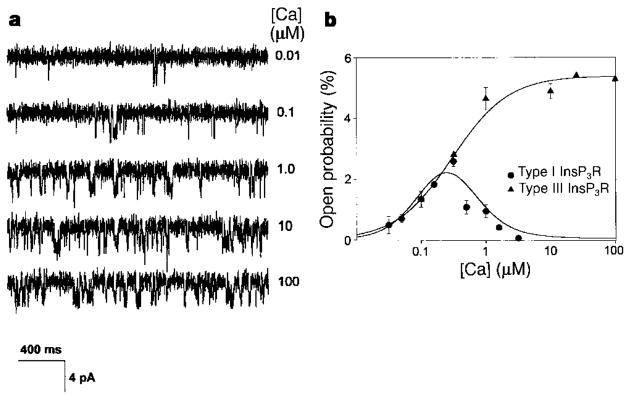
A central feature of type I InsP3R is that Ca2+ acts as an allosteric regulator when InsP3 is present. Maximum channel activity occurs when the concentration of free Ca2+ is 250 nM; there is a sharp decline in channel activity on either side of the maximum, with complete inhibition when cytosolic Ca2+ exceeds 5 μM (Fig. 3b, circles)16,17. This bell-shaped regulation provides amplification of the initial InsP3 signal, as well as negative-feedback inhibition of further InsP3-stimulated Ca2+ release. The feedback inhibition is particularly important because it provides autoregulation and is essential for Ca2+ oscillations and for the propagation of regenerative intracellular Ca2+ waves18.
Figure 3.
Single channel open probability for type I and type III InsP3R as a function of Ca2+ concentration. a, Channel activity for type III InsP3R in the presence of 2 μM InsP3, 0.5 mM ATP, 0.5 mM EGTA, 2 μM ruthenium red, and at 0 mV. Channel openings are shown as downward deflections. b, Single channel open probability of type I InsP3R (circles) and type III InsP3R (triangles). Data points for type I InsP3R were taken from ref.17. Data for three experiments are shown for type III InsP3R. Individual points with error bars are the mean ± s.e.m. for n = 2 (1 and 10 μM Ca2+) or n = 3 (0.01 and 0.1 μM Ca2+).
Does Ca2+ regulate type III InsP3R in the same way? We hypothesized that type III InsP3R should remain open at high cytoplasmic Ca2+ concentration ([Ca2+]) because InsP3 binding to type III InsP3R is not inhibited by elevated Ca2+ (refs 12, 13). To test this idea, we altered the cytoplasmic [Ca2+] in the presence of a fixed InsP3 concentration (2 μM). Like type I InsP3R, type III InsP3R was progressively activated as the cytoplasmic [Ca2+] increased to 250 nM. However, channel activity for type III InsP3R remained high even when cytoplasmic [Ca2+] was raised to 100 μM (Fig. 3a, bottom traces; Fig. 3b, triangles). The mean open time for type III InsP3R (6.5 ± 0.62 ms) was nearly identical to the reported value for type I InsP3R (6.4 ± 1.0 ms)7 and was independent of the cytoplasmic Ca2+ concentration. Thus, cytoplasmic free Ca2+ regulates the two isoforms differently; although both isoforms show similar Ca2+-dependent activation, Ca2+-dependent inhibition is lacking for type III InsP3R.
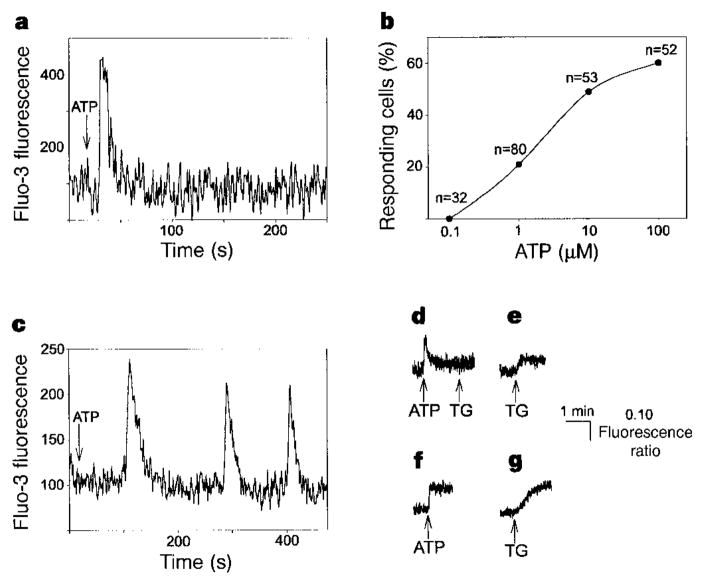
To investigate the physiological importance of this pattern of activation in an intact cell, we monitored the cytoplasmic [Ca2+] in RIN-5F cells which we stimulated with extracellular ATP that binds to P2Y receptors and increases [Ca2+] through the InsP3 cascade19,20. RIN-5F cells responded to ATP stimulation with a single, transient increase in [Ca2+] (Fig. 4a). In single cells, stimulation with 100 μM ATP induced a 209 ± 24% increase in Fluo-3 fluorescence relative to baseline; this increase lasted for 15.2 ± 0.8 s (Table 1). The response was similar in Ca2+-free medium (Table 1). Similar, but slightly smaller, increases in Fluo-3 fluorescence were seen in cells stimulated with 10 μM or 1 μM ATP. There was no increase in [Ca2+] in response to stimulation with 0.1 μM ATP (Fig. 4b), and neither sustained nor repetitive increases in [Ca2+] (that is, Ca2+ oscillations) were seen in any of the cells. In contrast, hepatocytes, which contain only types I and II InsP3R, produced Ca2+ oscillations after stimulation with 1 μM ATP (Fig. 4c), as shown previously21. RIN-5F cells that were serially stimulated with 10 μM and then 100 μM ATP responded only to the initial exposure to 10 μM ATP (n = 8). In addition, thapsigargin (2 μM) had a minimal effect on intracellular [Ca2+] when RIN-5F cells were pretreated with ATP (Fig. 4d). This finding provides direct evidence that activation of type III InsP3R drains internal Ca2+ stores in RIN-5F cells. Furthermore, the magnitude of ATP-induced Ca2+ spikes is significantly greater in RIN-5F cells than in hepatocytes (Fig. 4d, f). Thus, positive feedback of Ca2+ on type III InsP3R in RIN-5F cells causes rapid, massive, near-complete Ca2+ release, and results in more intense Ca2+ spikes that are of shorter duration than those that occur through the type I InsP3R in hepatocytes.
Figure 4.
Ca2+ signalling patterns in RIN-5F cells and rat hepatocytes. a, Stimulation of a RIN-5F cell with 100 μM ATP induces a single intracellular Ca2+ transient. b, Dose–response curve for RIN-5F cells stimulated with ATP. Values indicate total numbers of cells stimulated. c, Stimulation of an hepatocyte with 1 μM ATP induces Ca2+ oscillations. d, ATP (100 μM) induces a single transient increase in Ca2+ in RIN-5F populations (peak change in fluorescence ratio, ΔR = 0.20 ± 0.01; n = 6). Subsequent treatment with thapsigargin (TG; 2 μM) has little effect on Ca2+ (ΔR = 0.03 ± 0.01; n = 6). e, Thapsigargin alone (2 μM) increases Ca2+ in RIN-5F cells (ΔR = 0.08 ± 0.01; n = 6). f, ATP (100 μM) induces a rapid, sustained increase in Ca2+ in hepatocyte populations (ΔR = 0.13 ± 0.02; n = 7). g, Thapsigargin (2 μM) increases Ca2+ in hepatocytes like ATP alone (ΔR = 0.10 ± 0.02; n = 7).
Table 1.
Ca2+ transients in RIN-5F cells after stimulation by ATP
| ATP (μM) | Magnitude (% increase) | Duration (s) |
|---|---|---|
| 100 | 209 ± 24 (n = 23) | 15.2 ± 0.8 (n = 31) |
| 100 (Ca2+-free) | 200 ± 13 (n = 25) | 14.8 ± 1.2 (n = 25) |
| 10 | 160 ± 14 (n = 25) | 16.8 ± 2.1 (n = 19) |
| 1 | 121 ± 15 (n = 15) | 13.0 ± 2.1 (n = 8) |
| 0.1 | 0 (n = 32) | 0 (n = 32) |
RIN-5F cells were stimulated with ATP and changes in cytoplasmic Ca2+ in individual cells were measured by Fluo-3 fluorescence using confocal line scanning microscopy. The magnitude (per cent increase over baseline) and duration of the Ca2+ transients are expressed as mean ± s.e.m. (n).
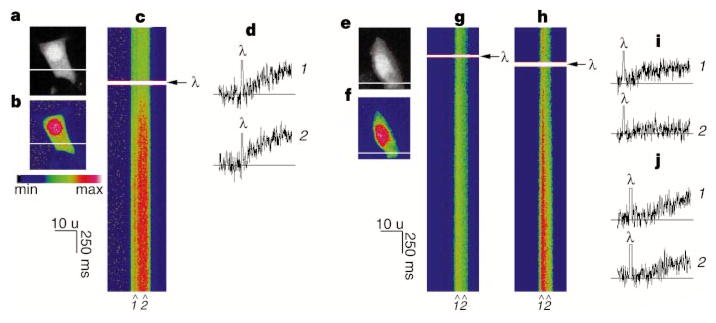
We next compared subcellular Ca2+ release from type III InsP3R in RIN-5F cells with subcellular Ca2+ release from type I InsP3R in SKHep1 cells (a hepatoma cell line that expresses type I but not type III InsP3R; our unpublished observation). Small amounts of InsP3 were released in both cell types by flash photolysis of microinjected caged InsP3. Release of InsP3 in the RIN-5F cells always resulted in all-or-none global Ca2+ signalling, although increases in [Ca2+] began in focal subcellular regions before spreading to encompass the entire cell (Fig. 5a–d). In contrast, non-propagating increases in [Ca2+] could sometimes be elicited in SKHep1 cells by photorelease of minimal amounts of InsP3 (Fig. 5e–g, i), similar to responses previously seen in pancreatic acinar and HeLa cells and Xenopus oocytes10,11,22,23. Photorelease of larger amounts of InsP3 induced a global Ca2+ response in SKHepI cells (Fig. 5h, j). These findings suggest that subcellular Ca2+ release via type III InsP3R results in a positive-feedback cycle that leads to all-or-none Ca2+ signalling that spreads throughout the cell, whereas release through type I InsP3R with low concentratons of InsP3 results in localized, non-propagating increases in [Ca2+].
Figure 5.
Subcellular Ca2+ release differs between RIN-5F and SKHep1 cells. a, confocal image of a RIN-5F cell. b, Pseudocolour image of the cell loaded with Fluo-3. The same pseudocolour scale was used for b, c, and f–h. c, Line scan collected along the line indicated in b after flash photolysis (λ) of caged InsP3. Ca2+ increases throughout the cell after photorelease of InsP3 (representative of 13 experiments with flash duration 50–100 ms). No Ca2+ increase was detected in 6 experiments with flash duration <50 ms. Spatial resolution, 0.26 μm per pixel; temporal resolution, 6 ms per pixel. d, Release of caged InsP3 results in a global increase in Ca2+. Trace duration in d, i and j is 2 s. e, f, Confocal (e) and pseudocolour (f) images of an SKHep1 cell. g, h, Confocal line scans of the cell during 30 and 60 ms flashes to photolyse caged InsP3. A response is detected in only the left side of the cell after a short flash (g), and throughout the cell after a long flash (h). Responses were absent or minimal in only part of an SKHep1 cell in 7 experiments (flash duration, 3–50 ms), whereas global Ca2+ increases were seen in 12 experiments (flash duration, 5–60 ms). i, An increase occurs on the left side of the cell in g (1), but not on the right (2). j, After more photorelease of InsP3 (h), similar Ca2+ increases occur at the same two subcellular locations.
The localized, subcellular Ca2+ signals in SKHep1 cells lasted from one to several seconds, a result that is typical for the duration of subcellular Ca2+ signals described in other mammalian cells10,11,24. Localized increases in [Ca2+] of shorter duration are routinely seen in Xenopus oocytes, in which Ca2+ puffs typically last for 300–1,000 ms (ref. 23). Although individual Ca2+ puffs are restricted to a small fraction of the total volume of an oocyte23, they occupy a region that is larger than an entire mammalian cell. We believe that the localized elevation in [Ca2+] in SKHep1 cells is a reasonable mammalian cell equivalent of the localized Ca2+ signals described in oocytes.
Ca2+ concentrations in RIN-5F cells returned nearly to baseline after stimulation with ATP (Fig. 4a, d), although depletion of intracellular Ca2+ stores in other cells activates a robust store-operated Ca2+ current (Isoc)25. Our findings suggest that Isoc is either small or absent in RIN-5F cells. We therefore stimulated RIN-5F cells with thapsigargin (2 μM) to deplete Ca2+ stores, and then removed Ca2+ from the medium. Thapsigargin induced a small but sustained increase in intracellular [Ca2+] (Fig. 4e); this increase was abolished by subsequent addition of extracellular EGTA. When RIN-5F cells were stimulated with thapsigargin in the absence of extracellular Ca2+, there was no sustained increase in intracellular [Ca2+]. Addition of thapsigargin to hepatocytes, in which Isoc has been described25, induced a larger increase in intracellular [Ca2+] (Fig. 4g); the level of Ca2+ also returned to baseline in response to extracellular EGTA. These findings indicate that RIN-5F cells contain less Isoc than hepatocytes, which is interesting in light of a suggestion that the primary role of type III InsP3R is to initiate Isoc (ref. 15) rather than Ca2+ transients. This hypothesis was based upon heterologous expression studies in Xenopus oocytes in which the protein seems to be targeted to the cell surface and may differ from the distribution found in RIN-5F cells (Fig. 1b) and other mammalian cells5,9.
The high degree of homology among InsP3R isoforms indicates that many of their functional properties ought to be comparable. We found that properties such as activation by InsP3, the magnitude of the single-channel current, and activation by concentrations of Ca2+ less than 250 nM were quite similar. In addition, the sustained activity of type III InsP3R at raised Ca2+ concentrations is similar to that reported for type I InsP3R in the presence of high concentrations of InsP3 (180 μM)17. In both cases, there is a lack of Ca2+-dependent inhibition, and the channel remains open even when the cytoplasmic Ca2+ exceeds 50 μM. In the presence of low concentrations of InsP3 (<5 μM), however, the two isoforms have fundamentally distinct responses to cytoplasmic [Ca2+] greater than 250 nM (Fig. 3). If type III InsP3R does not show Ca2+-dependent inhibition, what closes the channel? The primary level of regulation may be the control of InsP3 generation and degradation because type III, like type I, InsP3R only opens when InsP3 is present. Further regulation of intracellular Ca2+ release by type III InsP3R can occur by locally depleting the intracellular Ca2+ stores. Other mechanisms shown to be important for type I InsP3R, such as phosphorylation and regulation by associated proteins26, may also modulate the activity of type III InsP3R.
Multiple isoforms of the InsP3R are expressed in a variety of cell types14, but the physiological significance of this was unclear. The functional differences between type I and type III isoforms of the InsP3R now indicate that each has a special role in the cell. Type I InsP3R, with both Ca2+-dependent activation and inhibition, is well suited for establishing Ca2+ oscillations16,21,27, where the frequency of Ca2+ transients can be modulated when InsP3 concentrations are increased17,27. In contrast, type III InsP3R, by remaining open in the presence of high [Ca2+] (Fig. 3), initiates a rapid, large, and almost total release of Ca2+ from intracellular stores as long as InsP3 is present (Fig. 4a, d). Thus, type III InsP3R alone will not support a regenerative response, but its properties make it well suited to initiate intracellular Ca2+ signals. In support of this, type III InsP3R has been localized to the apical region of epithelial cells, the trigger zone from which intracellular Ca2+ waves originate9–11. Thus, the single-channel properties of type III InsP3R are well adapted to its role as the starting gate for Ca2+ signals in the cell.
Methods
Western blots and immunocytochemistry
Immunoblots were probed with antibodies against type I (C-19; custom produced by Research Genetics) or type III (Transduction Lab) InsP3R. Blots were visualized using ECL (Kirkegaard & Perry). For immunocytochemistry, the same primary antibodies were used to probe for type I and type III InsP3R in fixed cells. The secondary antibody contained a fluorescent label (FITC) that was observed by confocal microscopy. Nonspecific staining was determined by using only the secondary antibody.
Single-channel recordings
Endoplasmic reticulum vesicles from RIN-5F cells were prepared using the protocol for cerebellum described previously7. Vesicles were fused into planar lipid bilayers composed of phosphatidylethanolamine and phosphatidylserine (3:1, w/w; Avanti Polar Lipids) so that the cis and trans chambers corresponded to the cytosol and lumen of the endoplasmic reticulum respectively. Cytoplasmic bilayer solutions contained 110 mM Tris and 250 mM HEPES (pH 7.35), and lumenal solutions contained 55 mM Ba(OH2) and 250 mM HEPES (pH 7.35). The trans chamber was held at virtual ground and the transmembrane voltage was maintained at 0 mV. Single-channel currents were recorded under voltage-clamp conditions using a patch-clamp amplifier (BC-525B, Warner Instruments) and stored on VHS tape (Instrutech). Data were filtered at 1 kHz and digitized at 4 kHz for computer analysis using pClamp 6.0.3 (Axon Instruments). For the I–V curve, the membrane potential was clamped at values between 5 and −30 mV. The amplitude of channel openings at each voltage was determined by fitting the data (100–1,600 openings) with a gaussian function. Single-channel conductance was determined by linear regression. An extrapolation to 0 pA to estimate the reversal potential is not included because barium (55 mM Ba(OH)2) was in the trans chamber only, and current through the InsP3-gated channel can only flow in one direction from trans to cis. Current in the opposite direction was not detected. If more positive voltages were included, the current–voltage relationship would begin to curve, and the slope conductance would be underestimated. These are the same experimental conditions as used previously for type I InsP3R (ref. 7). For the Ca2+ dependence curve, calibrated amounts of CaCl2 were added to the cytoplasmic solution to obtain the desired free Ca2+ concentration. We estimated the number of active channels in each bilayer using a statistical model that is dependent on the maximum number of channels observed simultaneously, and then calculated the open probability for a single channel using this value7,17. Open probability data for type I InsP3R were fitted using the ‘2-InsP3/2-Ca2+’ model17, whereas open probability data for type III InsP3R were fitted according to Michaelis–Menten kinetics with Km = 0.3 and Pmax = 5.4: Po = (Pmax ·[Ca2+])/(Km + [Ca2+].
Cytoplasmic Ca2+ measurements
Cytoplasmic Ca2+ was measured in single RIN-5F cells or rat hepatocytes using confocal line scanning microscopy28 or in cell populations using ratio spectrofluorimetry29. For single-cell studies, RIN-5F cells or hepatocytes30 were plated onto glass coverslips, incubated at 37 °C, and loaded with Fluo-3/AM (6 μM). Coverslips containing the cells were transferred to a perfusion chamber on the stage of a BioRad MRC-600 confocal microscope and observed using a 20× objective30. Increases in [Ca2+] are expressed as a percentage of baseline fluorescence30. Cells were examined first under control conditions, then in the presence of 0.1–100 μM ATP. In selected experiments, RIN-5F cells were stimulated with ATP in Ca2+-free medium containing 1 mM EGTA; similar results were obtained in the presence and absence of extracellular Ca2+. For population studies, cells were loaded with Fura-2/AM (10 μM), then maintained at 37 °C in a cuvette. Cells were excited at 340 and 370 nm; fluorescence emission was detected at 485 nm using a PTI DeltaRAM system (these excitation and emission wavelengths were chosen to optimize Fura-2 ratio measurements with this system). Ratios were determined after background subtraction29.
Subcellular Ca2+ release
RIN-5F or SKHep1 cells were placed in a perfusion chamber on the stage of a BioRad confocal microscope, then individual cells were pressure-microinjected with a solution containing 1 mM caged InsP3, 1 mM Fluo-3, 1 mM HEPES, and 150 mM KCl. Cells were given 5–10 min to recover from injection, then InsP3 was photoreleased using a custom-built system that couples a mercury lamp to a 1-mm quartz fibreoptic cable through a high-speed shutter and filterwheel while cells were observed using confocal line scanning microscopy28. SKHep1 cells were kindly provided by D. Spray.
Acknowledgments
We thank E. Kaftan for all his assistance during the execution of these experiments, J. Putney for suggesting RIN-5F cells as source of type III InsP3R, and J. Brown for comments on the manuscript. This work was supported by NIH grants (to B.E.E. and M.H.N.), an Established Investigator Grant from the American Heart Association (to M.H.N.), and by the Yale Liver Center.
References
- 1.Furuichi T, et al. Primary structure and functional expression of the inositol 1,4,5-trisphosphate-binding protein P400. Nature. 1989;342:32–38. doi: 10.1038/342032a0. [DOI] [PubMed] [Google Scholar]
- 2.Mignery G, Sudhof TC, Takei K, De Camilli P. Putative receptor for inositol 1,4,5-trisphosphate similar to ryanodine receptor. Nature. 1989;342:192–195. doi: 10.1038/342192a0. [DOI] [PubMed] [Google Scholar]
- 3.Sudhof TC, Newton CL, Archer BT, Ushkaryov YA, Mignery GA. Structure of a novel InsP3 receptor. EMBO J. 1991;10:3199–3206. doi: 10.1002/j.1460-2075.1991.tb04882.x. [DOI] [PMC free article] [PubMed] [Google Scholar]
- 4.Blondel O, Takeda J, Janssen H, Seino S, Bell GI. Sequence and functional characterization of a third inositol trisphospate receptor subtype, IP3R-3, expressed in pancreatic islets, gastrointestinal tract, and other tissues. J Biol Chem. 1993;268:11356–11363. [PubMed] [Google Scholar]
- 5.Maranto AR. Primary structure, ligand binding, and localization of the human type 3 inositol 1,4,5-trisphosphate receptor expressed in intestinal epithelium. J Biol Chem. 1994;269:1222–1230. [PubMed] [Google Scholar]
- 6.Morgan JM, De Smedt H, Gillespie JI. Identification of three isoforms of the InsP3 receptor in human myometrial smooth muscle. Pflugers Arch. 1996;431:697–705. doi: 10.1007/BF02253832. [DOI] [PubMed] [Google Scholar]
- 7.Bezprozvanny I, Ehrlich B. Inositol (1,4,5)-trisphosphate gated Ca channels from canine cerebellum: divalent cation conduction properties and regulation by intraluminal Ca. J Gen Physiol. 1994;104:821–856. doi: 10.1085/jgp.104.5.821. [DOI] [PMC free article] [PubMed] [Google Scholar]
- 8.Perez PJ, Ramos-Franco J, Fill M, Mignery GA. Identification and functional reconstitution of the type 2 inositol 1,4,5-trisphosphate receptor from ventricular cardiac myocytes. J Biol Chem. 1997;272:23961–23969. doi: 10.1074/jbc.272.38.23961. [DOI] [PubMed] [Google Scholar]
- 9.Nathanson MH, Fallon MB, Padfield PJ, Maranto AR. Localization of the type 3 inositol 1,4,5-trisphosphate receptor in the Ca2+ wave trigger zone of pancreatic acinar cells. J Biol Chem. 1994;269:4693–4696. [PubMed] [Google Scholar]
- 10.Thorn P, Lawrie A, Smith P, Gallacher D, Petersen OH. Local and global cytosolic Ca2+ oscillations in exocrine cells evoked by agonists and inositol trisphosphate. Cell. 1993;74:661–668. doi: 10.1016/0092-8674(93)90513-p. [DOI] [PubMed] [Google Scholar]
- 11.Kasai H, Li Y, Miyashita Y. Subcellular distribution of Ca2+ release channels underlying Ca2+ waves and oscillations in exocrine pancrease. Cell. 1993;74:669–677. doi: 10.1016/0092-8674(93)90514-q. [DOI] [PubMed] [Google Scholar]
- 12.Yoneshima H, Miyawaki A, Takayuki M, Teiichi F, Mikoshiba K. Ca2+ differentially regulates the ligand-affinity states of the type 1 and type 3 inositol 1,4,5-trisphosphate receptors. Biochem J. 1997;322:591–596. doi: 10.1042/bj3220591. [DOI] [PMC free article] [PubMed] [Google Scholar]
- 13.Cardy TJA, Traynor D, Taylor CW. Differential regulation of types-1 and -3 inositol trisphosphate receptors by cytosolic Ca2+ Biochem J. 1997;328:785–793. doi: 10.1042/bj3280785. [DOI] [PMC free article] [PubMed] [Google Scholar]
- 14.Wojcikiewicz RJH. Type I,II,III inositol 1,4,5-trisphosphate receptors are unequally susceptible to down-regulation and are expressed in markedly different proportions in different cell types. J Biol Chem. 1995;270:11678–11683. doi: 10.1074/jbc.270.19.11678. [DOI] [PubMed] [Google Scholar]
- 15.DeLisle S, et al. Expression of inositol 1,4,5-trisphosphate receptors changes the Ca signal in Xenopus oocytes. Am J Physiol. 1996;270:C1255–C1261. doi: 10.1152/ajpcell.1996.270.4.C1255. [DOI] [PubMed] [Google Scholar]
- 16.Bezprozvanny I, Watras J, Ehrlich BE. Bell-shaped calcium-response curves of Ins(1,4,5)P3- and calcium-gated channels from endoplasmic reticulum of cerebellum. Nature. 1991;351:751–754. doi: 10.1038/351751a0. [DOI] [PubMed] [Google Scholar]
- 17.Kaftan EJ, Ehrlich BE, Watras J. Inositol 1,4,5-trisphosphate (InsP3) and calcium interact to increase the dynamic range of InsP3 receptor-dependent calcium signaling. J Gen Physiol. 1997;110:529–538. doi: 10.1085/jgp.110.5.529. [DOI] [PMC free article] [PubMed] [Google Scholar]
- 18.Thomas AP, Bird GS, Hajinoczky G, Robb-Gaspers LD, Putney JW. Spatial and temporal aspects of cellular calcium signaling. FASEB J. 1996;10:1505–1517. [PubMed] [Google Scholar]
- 19.Dubyak GR, El-Moatassim C. Signal transduction via P2-purinergic receptors for extracellular ATP and other nucleotides. Am J Physiol Cell Physiol. 1993;265:C577–C606. doi: 10.1152/ajpcell.1993.265.3.C577. [DOI] [PubMed] [Google Scholar]
- 20.Cao D, Lin G, Westphale E, Beyer E, Steinberg T. Mechanisms for the coordination of intercellular calcium signaling in insulin-secreting cells. J Cell Sci. 1997;110:497–504. doi: 10.1242/jcs.110.4.497. [DOI] [PubMed] [Google Scholar]
- 21.Dixon C, Woods N, Cuthbertson K, Cobbold P. Evidence for two Ca2(+)-mobilizing purinoceptors on rat hepatocytes. Biochem J. 1990;269:499–502. doi: 10.1042/bj2690499. [DOI] [PMC free article] [PubMed] [Google Scholar]
- 22.Bootman M, Berridge M, Lipp P. Cooking with calcium: the recipes for composing global signals from elementary events. Cell. 1997;91:367–373. doi: 10.1016/s0092-8674(00)80420-1. [DOI] [PubMed] [Google Scholar]
- 23.Parker I, Yao Y. Ca2+ transients associated with openings of inositol trisphosphate-gated channels in Xenopus oocytes. J Physiol. 1996;49:663–668. doi: 10.1113/jphysiol.1996.sp021247. [DOI] [PMC free article] [PubMed] [Google Scholar]
- 24.Lipp P, Thomas D, Berridge M, Bootman M. Nuclear calcium signalling by individual cytoplasmic calcium puffs. EMBO J. 1997;16:7166–7173. doi: 10.1093/emboj/16.23.7166. [DOI] [PMC free article] [PubMed] [Google Scholar]
- 25.Glennon MC, Bird GSJ, Kwan CY, Putney JW. Actions of vasopressin and the Ca2+-ATPase inhibitor, thapsigargin, on Ca2+ signaling in hepatocytes. J Biol Chem. 1992;267:8230–8233. [PubMed] [Google Scholar]
- 26.Cameron A, et al. Calcineurin associated with the inositol 1,4,5-trisphosphate receptor–FKBP12 complex modulates Ca2+ flux. Cell. 1995;83:463–472. doi: 10.1016/0092-8674(95)90124-8. [DOI] [PubMed] [Google Scholar]
- 27.Petersen CC, Toescu EC, Potter BVL, Petersen OH. Inositol triphosphate produces different patterns of cytoplasmic Ca2+ spiking depending on its concentration. FEBS Lett. 1991;293:179–182. doi: 10.1016/0014-5793(91)81181-7. [DOI] [PubMed] [Google Scholar]
- 28.Nathanson MH, Padfield PJ, O’Sullivan AJ, Burgstahler AD, Jamieson JD. Mechanism of Ca2+ wave propagation in pancreatic acinar cells. J Biol Chem. 1992;267:18118–18121. [PubMed] [Google Scholar]
- 29.Grynkiewicz G, Poenie M, Tsien R. A new generation of Ca2+ indicators with greatly improved fluorescence properties. J Biol Chem. 1985;260:3440–3450. [PubMed] [Google Scholar]
- 30.Schlosser SF, Burgstahler AD, Nathanson MH. Isolated rat hepatocytes can signal to other hepatocytes and bile duct cells by release of nucleotides. Proc Natl Acad Sci USA. 1996;93:9948–9953. doi: 10.1073/pnas.93.18.9948. [DOI] [PMC free article] [PubMed] [Google Scholar]


