Abstract
Insulin is an hepatic mitogen that promotes liver regeneration. Actions of insulin are mediated by the insulin receptor, which is a receptor tyrosine kinase. It is currently thought that signaling via the insulin receptor occurs at the plasma membrane, where it binds to insulin. Here we report that insulin induces calcium oscillations in isolated rat hepatocytes, and that these calcium signals depend upon activation of phospholipase C and the inositol 1,4,5-trisphosphate receptor, but not upon extracellular calcium. Furthermore, insulin-induced calcium signals occur in the nucleus, and are temporally associated with selective depletion of nuclear phosphatidylinositol bisphosphate and translocation of the insulin receptor to the nucleus. These findings suggest that the insulin receptor translocates to the nucleus to initiate nuclear, inositol 1,4,5-trisphosphate-mediated calcium signals in rat hepatocytes. This novel signaling mechanism may be responsible for insulin’s effects on liver growth and regeneration.
Insulin regulates a wide variety of biological functions in the liver, including glucose uptake,1 regulation of gene expression,2 and promotion of cell growth.3–5 The biological actions of insulin are initiated by binding to the insulin receptor, a heterotetrameric receptor tyrosine kinase (RTK) composed of two extracellular α-subunits and two transmembrane β-subunits.6 The α-subunit possesses insulin-binding activity whereas the β-subunit has intrinsic protein tyrosine kinase activity. Binding of insulin to the α-subunit of its receptor activates the protein tyrosine kinase and results in phosphorylation of tyrosine residues of the β-subunit and of several endogenous substrates. These substrates include proteins containing a src-homology 2 domain such as phosphatidylinositol 3-kinase and phospholipase C (PLC).7 PLC hydrolyzes phosphatidylinositol 4,5-bisphosphate (PIP2), generating two intracellular products: inositol 1,4,5-trisphosphate (InsP3), a universal calcium-mobilizing second messenger, and diacylglycerol, an activator of protein kinase C. Like insulin, Ca2+ also regulates glucose metabolism,8 gene expression,9,10 and cell growth.11,12 Although it has not been established how a single second messenger coordinates such diverse effects within a cell, there is increasing evidence that the spatial and temporal patterns of Ca2+ signals may determine their specificity. Ca2+ signaling patterns can vary in different regions of the cell, and increases in Ca2+ in the nucleus have specific biological effects that differ from the effects of increases in cytosolic Ca2+.9,10,13–15 The mechanisms and pathways that promote localized increases in free Ca2+ levels in the nucleus have not been entirely defined. It is currently thought that signaling via the insulin receptor occurs only at the plasma membrane, where it binds to insulin.16 Here we investigate whether and how insulin signaling occurs in the nucleus of hepatocytes, where its downstream messenger Ca2+ may act.
Materials and Methods
Cells and Cell Culture
Hepatocytes were isolated from the livers of male Sprague-Dawley rats (190–200 g; Charles River Laboratories, Wilmington, MA) by collagenase perfusion as described.17 Primary hepatocytes were cultured at 37°C in 5% CO2/95% O2 in Williams’ medium E containing 10% fetal bovine serum, 50 units/mL penicillin, and 50 g/mL streptomycin (Invitrogen, Carls-bad, CA) and plated on collagen-coated coverslips (50 μg/mL) (BD Biosciences, San Jose, CA). Hepatocytes were used 4–6 hours after isolation. Viability of the hepatocytes was greater than 85% and was measured by trypan blue exclusion.18,19 SkHep1 cells, a human liver cancer cell line, were cultured at 37°C in 5% CO2 in Dulbecco’s modified Eagle’s medium (Invitrogen) containing 10% fetal bovine serum, 1 mM sodium pyruvate, 50 units/mL penicillin, and 50 g/mL streptomycin (Invitrogen).
Detection of Ca2+ Signals
Nuclear and cytosolic Ca2+ were monitored in individual cells by time-lapse confocal microscopy, as described.14,20 For Ca2+ imaging, cells were incubated with fluo-4/AM (6 μM) (Invitrogen) for 30 minutes at 37°C, then coverslips containing the cells were transferred to a custom-built perfusion chamber on the stage of a Zeiss LSM 510 confocal microscope (Thornwood, NY) and the perfusion chamber was maintained at 37°C. The cells were stimulated with insulin (1–500 nM) or vasopressin (10 nM) (Sigma, Saint Louis, MO). In selected experiments cells were perfused for 10 minutes with the PLC inhibitor U-73122 (1 μM) or pretreated for 30 minutes with the InsP3 receptor inhibitor xestospongin C (2.5 μM) (Sigma). Fluo-4 fluorescence was monitored using a 40×, 1.2 NA objective lens, and images were collected at a rate of 1–5 frames/second. Changes in fluorescence F were normalized by the initial fluorescence (F0) and were expressed as (F/F0) × 100%.11
InsP3 Buffer Constructs
The InsP3 binding domain (residues 224-605) of the human type I InsP3 receptor was tagged with monomeric red fluorescent protein (mRFP) and then the nuclear localization signal was sub-cloned to generate the nuclear InsP3 buffer expression vector. The nuclear exclusion signal sequence derived from mitogen-activated protein kinase kinase 1 was sub-cloned in the InsP3 binding domain tagged with the mRFP construct to generate the cytoplasmic InsP3 buffer expression vector, as described.21
Immunoblotting
Primary hepatocyte immunoblots were performed as described.22 Briefly, cells were washed twice with ice-cold phosphate-buffered saline, harvested by scraping, and lysed in a lysis buffer (20 mM [4-(2-hydroxyethyl)-1-piperazine ethanesulfonic acid], pH 7.0, 10 mM KCl, 2 mM MgCl2, 0.5% Nonidet P-40). After incubation on ice for 10 minutes, the cells were homogenized by vortex. The homogenate was centrifuged at 1,500g for 5 minutes to sediment the nuclei. The supernatant was then centrifuged at a maximum speed of 16,100g for 20 minutes, and the resulting supernatant formed the non-nuclear fraction. The nuclear pellet was washed three times with lysis buffer to remove any contamination from cytoplasmic membranes, and the purity of the nuclei was confirmed by light microscopy. To extract nuclear proteins, the isolated nuclei were resuspended in NETN buffer (150 mM NaCl, 1 mM EDTA, 20 mM Tris-HCL, pH 8.0, 0.5% Nonidet P-40), and the mixture was sonicated briefly to aid nuclear lysis. Nuclear lysates were collected after centrifugation at 16,100g for 20 minutes at 4°C. Protease and phosphatase inhibitors (Sigma) were added to all buffers. Blots were visualized by enhanced chemiluminescence, and quantitatively analyzed using a GS-700 imaging densitometer. The purity of nuclear and non-nuclear fractions was confirmed using Lamin B1 (Abcam, Cambridge, MA) as a nuclear marker and α-Tubulin (Sigma) as a non-nuclear (cytosolic) marker.23 The phosphorylated form of the insulin receptor was detected by immunoprecipitation of the receptor, followed by blotting with a monoclonal antibody directed against phosphotyrosine residues (Millipore, Billerica, MA).
Detection of PIP2
A PI(4,5)P2 Mass Strip Kit (Echelon, Salt Lake City, UT) was used for isolation and PIP2 detection. Isolated hepatocytes were starved in serum-free William’s E medium for 3 hours. Cells were incubated without or with insulin (10 nM) for 10 minutes or vasopressin (10 nM) for 1 minute, and then the medium was aspirated and cellular material precipitated by the immediate addition of 3 mL ice-cold 0.5 M trichloroacetic acid. The lysis buffer was used to prepare the nuclear and non-nuclear cell fractions, as described above.22 Briefly, cell membranes were disrupted to release cytoplasmic contents. Intact nuclei were recovered from the cytoplasmic extract by centrifugation, and then the nuclei were washed with phosphate-buffered saline and precipitated with 3 mL ice-cold 0.5 M trichloroacetic acid. Isolation of lipids was performed according to manufacturer instructions and as described.24 The organic phase was collected into a clean tube and dried in a Speed Vac centrifuge. The pellet at this stage was faintly visible. The lipids were then resuspended by sonication in a cold water bath in 10 μL of CHCl3:methanol:H2O (1:2:0.8), and spotted onto nitrocellulose membrane strips prespotted with PI(4,5)P2 standards, PIP controls, and space for spotting unknown samples for probing with anti-PIP2 monoclonal antibody (Echelon) to specifically detect PIP2. Blots were visualized by enhanced chemiluminescence, and quantitatively analyzed using a GS-700 imaging densitometer (Bio-Rad, Hercules, CA).
Immunofluorescence
Confocal immunofluorescence was performed as described.14,20 Cells were double-labeled with a polyclonal antibody against insulin receptor B (BD Biosciences, CA), which is the predominant form of the receptor in hepatocytes,25 and a monoclonal antibody against the nuclear membrane marker Lamin B1, and then incubated with secondary antibodies conjugated to Alexa 488 and 555 (Invitrogen), respectively. Images were collected with a Zeiss LSM 510 confocal microscope using a 63×, 1.4 NA objective lens with excitation at 488 nm and observation at 505–550 nm to detect Alexa 488, and excitation at 543 nm and observation at 560–610 nm to detect Alexa 555.
Statistical Analysis
Significance of changes in treatment groups relative to controls was determined by Student t test. Data are represented as mean ± standard error.
Results
Insulin Induces Ca2+ Oscillations in Rat Hepatocytes
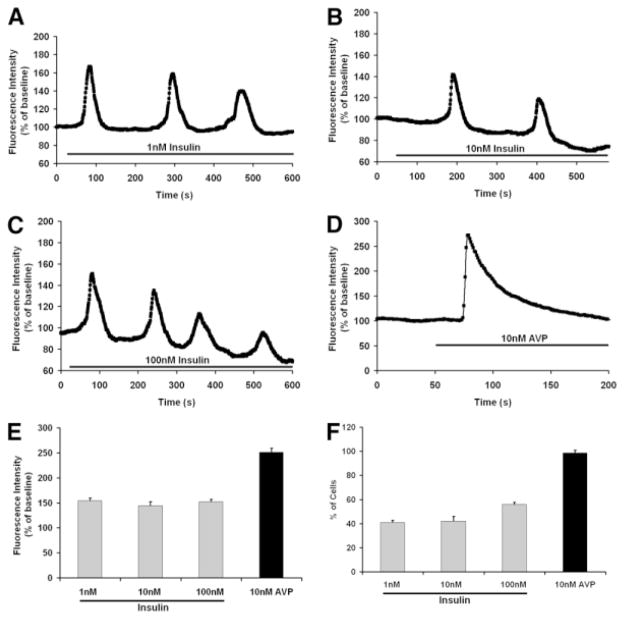
To examine Ca2+ signaling induced by insulin, freshly isolated rat hepatocytes were stimulated with a range of insulin concentrations (0.1–100 nM) and observed by time-lapse confocal microscopy. Hepatocytes did not respond to 0.1 nM insulin (n = 30), but responded to all higher concentrations tested. The fraction of cells responding to insulin did not vary appreciably with increasing insulin concentrations; 41% of cells responded to stimulation with 1 nM insulin (Fig. 1A), 42% of cells responded to 10 nM insulin (Fig. 1B), and 56% of cells responded to maximal (100 nM) stimulation (Fig. 1C). Ca2+ oscillations were elicited in all responding cells stimulated with lower (1–10 nM) insulin concentrations, although higher insulin concentrations elicited Ca2+ oscillations in only 10% of responding cells, and instead elicited a sustained increase in Ca2+ in the remaining 46% of responding cells (data not shown). Moreover, the response to 100 nM and 500 nM insulin was similar, suggesting that these findings represent the full range of insulin’s effect on Ca2+ signals in hepatocytes. The frequency of Ca2+ oscillations (~5 mHz) was similar regardless of the insulin concentration. These findings show that insulin, like other Ca2+ agonists such as vasopressin, phenylephrine, angiotensin, and adenosine triphosphate,26–28 induces Ca2+ signals in hepatocytes that tend to be oscillatory at lower concentrations but can instead be sustained at higher concentrations. However, the frequency of insulin-induced Ca2+ oscillations was lower than has typically been reported for other agonists such as phenylephrine (10–50 mHz)26,27 and vasopressin (10–35 mHz).26,28 In addition, maximal concentrations of these other agonists generally elicit Ca2+ signals in >90% of hepatocytes,26–28 whereas insulin elicited Ca2+ signals in a much lower fraction of cells. Moreover, we stimulated cells with vasopressin (10 nM) and those results confirmed that ~98% of cells responded to that agonist, even though only half of the cells responded to insulin under the same experimental conditions. Vasopressin also induced a greater peak in fluorescence than what was observed in response to insulin stimulation (Fig. 1D). These findings demonstrate that insulin induces Ca2+ signals in hepatocytes, including Ca2+ oscillations, but that certain characteristics of these signals differ from what is elicited by stimulation of G protein– coupled receptors.
Fig. 1.
Insulin induces calcium signaling in hepatocytes. (A–C) Insulin induces Ca2+ oscillations in primary rat hepatocytes. Ca2+ was monitored in individual hepatocytes 4–6 hours after isolation using the Ca2+ dye fluo-4 and time-lapse confocal microscopy. Tracings are shown from individual cells stimulated with 1, 10, or 100 nM insulin, respectively. No response was observed in cells stimulated with 0.1 nM insulin (n = 30; data not shown), and the response to 500 nM insulin was similar to the response shown here for 100 nM insulin (n = 35; data not shown). Stimulation with 1 and 10 nM insulin induced Ca2+ oscillations (n = 58). Stimulation with 100 nM insulin instead induced a sustained Ca2+ increase in some cells (n = 25; data not shown). Results are representative of what was observed in >25 responding cells under each condition. (D) Representative tracing of the Ca2+ signal induced by maximal (10 nM) stimulation with vasopressin. Note that the response begins and reaches its peak more rapidly in these cells than in cells stimulated with insulin. The result is representative of what was observed in n = 90 separate cells. (E) The amplitude of the Ca2+ signal induced by insulin is not concentration-dependent, and is significantly less than the amplitude of the Ca2+ signal induced by vasopressin (*P < 0.001; n = 30 in each group). (F) The fraction of cells responding to insulin is not concentration-dependent, and is significantly less than the fraction that responds to vasopressin (*P < 0.001; n = 30 in each group).
Insulin-Induced Ca2+ Signals Are Mediated by InsP3
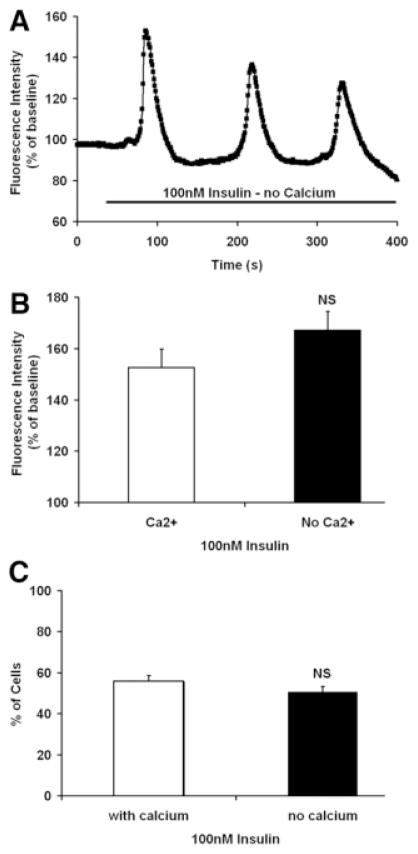
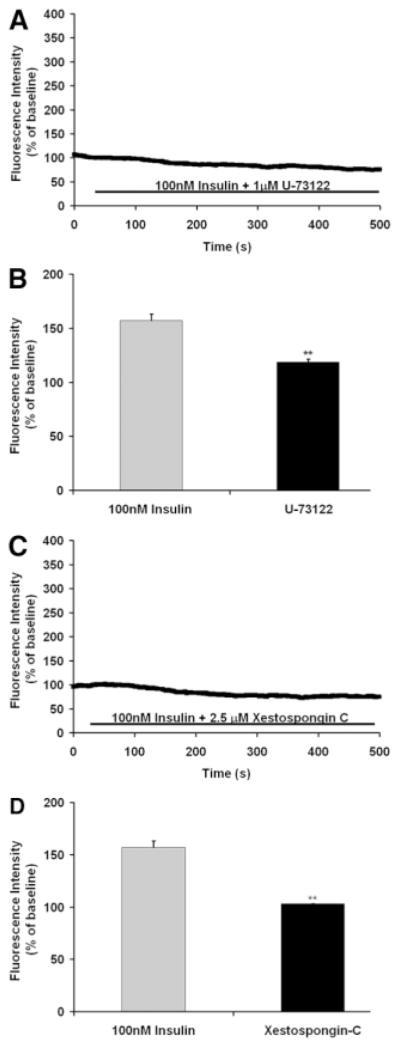
Several maneuvers were performed to determine the mechanism by which insulin increases Ca2+ in hepatocytes. To determine the source of the Ca2+, cells were stimulated in Ca2+-free medium. Insulin induced Ca2+ oscillations even in Ca2+-free medium (Fig. 2A), and Ca2+ signals were elicited in a similar fraction of cells regardless of the presence of extracellular Ca2+ (Fig. 2B). These findings demonstrate that insulin increases cytoplasmic Ca2+ by mobilizing intracellular Ca2+ stores. Most RTKs increase Ca2+ by activation of PLCγ, which forms InsP3 to bind to and release Ca2+ from InsP3 receptors in the endoplasmic reticulum.29 Therefore, we stimulated hepatocytes with insulin in the presence of either the PLC inhibitor U-7312230 or the InsP3 receptor inhibitor xestospongin C.31 Both U-73122 (Fig. 3A,B) and xestospongin C (Fig. 3C,D) eliminated insulin-induced Ca2+ signals in hepatocytes. Together, these findings suggest that insulin increases Ca2+ in hepatocytes through PLC- and InsP3-mediated release of intracellular Ca2+ stores.
Fig. 2.
Insulin-induced Ca2+ signals do not depend on extracellular Ca2+. (A) Insulin (100 nM) induces Ca2+ oscillations in an hepatocyte placed in Ca2+-free medium fortified with 1 mM ethylene glycol tetraacetic acid (EGTA). The result is representative of what was observed in 30 cells. (B) The amplitude of the Ca2+ signal induced by insulin is not decreased in Ca2+-free medium (n = 10 in each group). (C) The fraction of cells responding to insulin is not decreased in Ca2+-free medium (n = 10 in each group).
Fig. 3.
Insulin-induced Ca2+ signals depend on PLC and InsP3. (A) The Ca2+ signal induced by insulin (100 nM) is blocked by the PLC inhibitor U-73122 (1 μM). The result is representative of what was observed in 56 cells. (B) Bar graph summary showing that the amplitude of the Ca2+ signal induced by insulin is significantly reduced by U-73122 (**P < 0.001; n = 18 in each group). (C) The Ca2+ signal induced by insulin (100 nM) is blocked by the InsP3 receptor inhibitor xestospongin C (2.5 μM). The result is representative of what was observed in 73 cells. (D) Bar graph summary showing that the amplitude of the Ca2+ signal induced by insulin is significantly reduced by xestospongin C (**P < 0.001; n = 25 in each group).
Insulin-Induced Ca2+ Signals Begin in the Nucleus
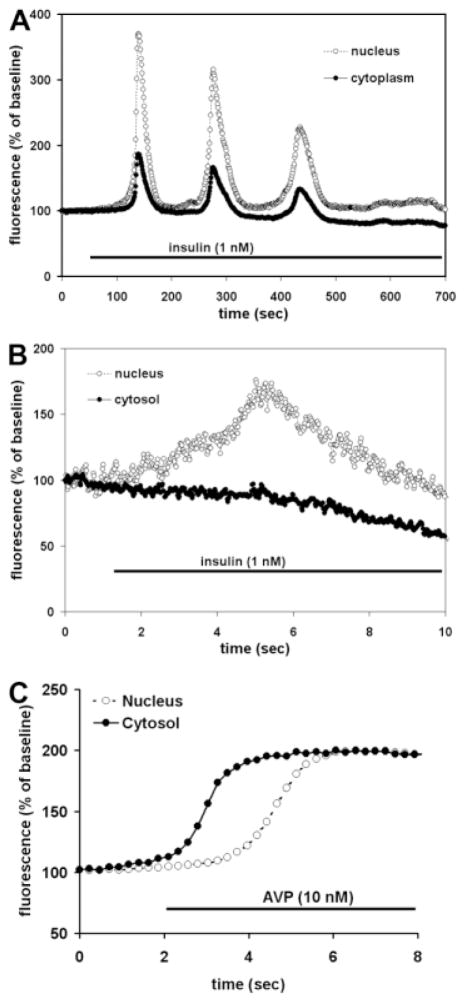
Ca2+ signals in the nucleus and cytoplasm were monitored simultaneously in hepatocytes (n > 30). The signals often had a similar temporal profile in both compartments (Fig. 4A), but the Ca2+ increase in the nucleus preceded the cytoplasmic increase in some cells, while in other cells an isolated increase in Ca2+ in the nucleus was observed (Fig. 4B). The kinetics of vasopressin-induced Ca2+signals differed from this in two ways. First, insulin-induced signals often took up to 50 seconds from the time of onset to reach their peak amplitude (Figs. 1A–C and 4A), whereas the rise time of vasopressin-induced signals always was much shorter (~1 second; Fig. 1D), similar to what has been reported.18 Second, vasopressin-induced Ca2+ signals always began in the cytoplasm rather than the nucleus (Fig. 4C). These findings indicate that the subcellular kinetics of insulin-induced Ca2+ signals differ fundamentally from the kinetics of Ca2+ signals induced by vasopressin, which in turn suggests that insulin may increase Ca2+ through a mechanism based in the nucleus rather than in the cytoplasm.
Fig. 4.
Insulin-induced Ca2+ signals begin in the nucleus. (A) Examination of the nuclear and cytosolic components of the insulin-induced Ca2+ signal reveal that the Ca2+ increase occurs in both regions of the hepatocyte. The image is representative of what was observed in >90 cells. (B) Insulin can induce isolated Ca2+ increases in the nucleus. All cells responded to insulin in this fashion, with sequential increases in Ca2+ in the nucleus and then cytosol, or with a simultaneous increase in Ca2+ in the nucleus and cytosol. Note the expanded time scale relative to (A) of this figure and in Figs. 1–3. (C) The vasopressin-induced Ca2+ signal begins in the cytosol rather than the nucleus, similar to what has been reported.18,19 Because the fluorescence intensity of fluo-4 differs in the nucleus and cytosol,20 fluorescence here was rescaled so that the nuclear and cytosolic signals would have the same baseline and peak values, to facilitate direct comparison of the time course of each tracing. Results are representative of what was observed in at least 25 cells in each group.
The Insulin Receptor Translocates to the Nucleus
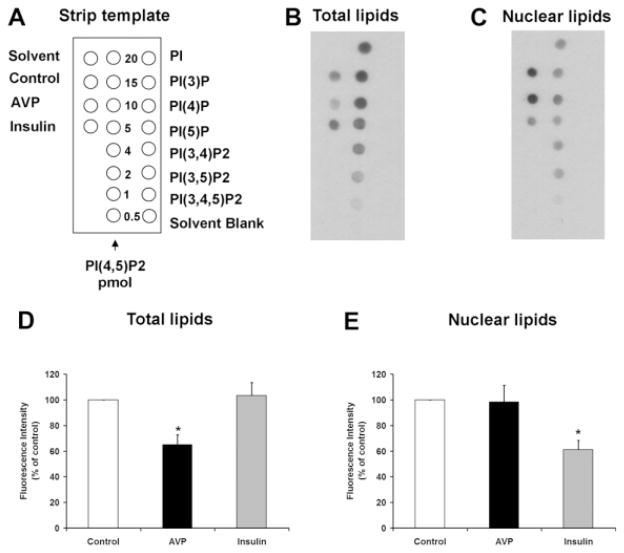
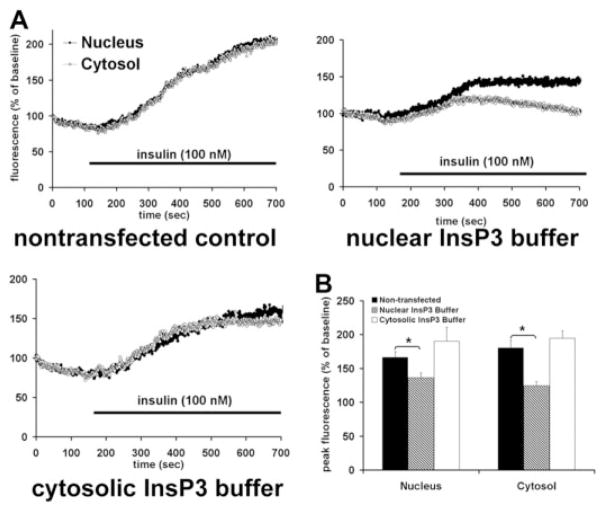
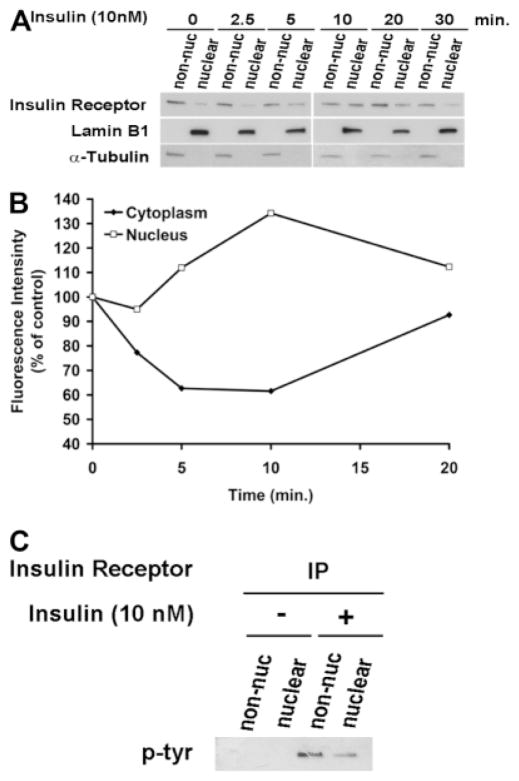
Ca2+ signals are initiated in hepatocytes when PIP2 is hydrolyzed to form InsP3.18 Both the nucleus and the cytoplasm contain the machinery needed to form InsP3-mediated Ca2+ signals, including PLC, PIP2, and the InsP3 receptor,32 so we examined the effects of insulin on total cellular and nuclear pools of PIP2. Insulin reduced the nuclear pool by 38.9 ± 7.1% (P < 0.05) without significantly reducing total cellular PIP2 (Fig. 5). For comparison, vasopressin reduced total cellular PIP2 by 35.2 ± 7.8% (P < 0.05) without significantly reducing nuclear PIP2. To demonstrate more directly that the insulin receptor forms InsP3 in the nucleus, we targeted the ligand binding domain (residues 224-605) of the type 1 InsP3 receptor33 to the cytoplasm or nucleus using a nuclear exclusion signal or nuclear localization signal sequence, respectively, plus mRFP to verify localization.21 These targeted InsP3 buffer constructs were expressed in the SkHep1 liver cell line, to circumvent technical difficulties associated with transient transfection of primary hepatocytes. It has previously been shown that the cytoplasmic but not the nuclear InsP3 buffer blocks vasopressin-induced Ca2+ signals in SkHep1 cells, reflecting the fact that G protein-coupled receptors such as the vasopressin V1a receptor activate PLC and form InsP3 at the plasma membrane.21 In contrast, Ca2+ signals induced by insulin (100 nM) were nearly abolished in cells expressing the nuclear InsP3 buffer (P < 0.005), but were not affected by expression of the cytoplasmic buffer (Fig. 6). Together, these results show that insulin hydrolyzes PIP2 and increases InsP3 only in the nucleus, and that Ca2+ signals throughout the cell result from this. To investigate why insulin preferentially forms InsP3 and increases Ca2+ in the nucleus, we examined the location of the insulin receptor during cell stimulation. Immunoblots of non-nuclear and nuclear fractions showed that the insulin receptor was in the non-nuclear fraction of hepatocytes prior to stimulation with insulin. However, the receptor appeared in the nuclear fraction within 2.5 minutes of stimulation, and was detectable within the nucleus until 20 minutes after stimulation (Fig. 7A,B). Similarly, the phosphorylated (active) form of the insulin receptor was absent from the nucleus of hepatocytes prior to stimulation with insulin, but was detected there afterwards (Fig. 7C). To confirm the immunoblot findings, confocal immunofluorescence microscopy was used to monitor the subcellular distribution of the insulin receptor. Confocal imaging demonstrated that the insulin receptor was at the plasma membrane or within the cytoplasm but absent from the nucleus prior to stimulation (Fig. 8A, top panels). Within 5 minutes of exposure to 10 nM insulin, the insulin receptor could also be detected at the nuclear envelope and within the nuclear interior (Fig. 8A, bottom panels). Three-dimensional (3D) reconstruction of serial confocal immunofluorescence images confirmed that the receptor could be identified within the nuclear interior of cells stimulated with insulin (Fig. 8B). Together, these findings demonstrate that stimulation of hepatocytes with insulin induces the insulin receptor to translocate to the nucleus, and this is associated with selective hydrolysis of nuclear PIP2 and formation of InsP3-dependent Ca2+ signals within the nucleus.
Fig. 5.
Insulin selectively hydrolyzes nuclear PIP2. Immunoassay of total (B) and nuclear (C) lipids, plus a key to the strip template (A). The lipid samples were spotted onto nitrocellulose membranes, as illustrated by the strip template, and the PIP2 levels were detected using an anti-PIP2 monoclonal antibody. This antibody reacts with a higher degree of specificity to PI(4,5)P2 than to other inositol polyphosphates (right column). A total of 20 pmol of each of the other PIP controls was used. (D) Densitometric measurement shows that arginine vasopressin (AVP) hydrolyzes 35.2 ± 7.8% of PIP2 in whole cell preparations (n = 3, *P < 0.05), whereas insulin does not hydrolyze significant amounts of total cellular PIP2. (E) Insulin hydrolyzes 38.9 ± 7.1% of PIP2 in the nucleus (n = 3, *P < 0.05), whereas vasopressin stimulation does not hydrolyze significant amounts of nuclear PIP2. Total and nuclear lipids were isolated 10 minutes after stimulation of hepatocytes with insulin (10 nM) or 1 minute after stimulation with vasopressin (10 nM). Data are mean ± standard error of the mean (SEM).
Fig. 6.
Insulin generates InsP3 in the nucleus rather than the cytoplasm. (A) Insulin-induced Ca2+ signals are attenuated by the nuclear but not the cytosolic InsP3 buffer. SkHep1 cells loaded with fluo-4 were stimulated with insulin (100 ng/mL) while examined by time-lapse confocal microscopy. Graphical representation of the nuclear and cytosolic Ca2+ signal detected in a representative cell from each experimental group stimulated with insulin is shown. Ca2+ increases in the nucleus and cytosol are similar in nontransfected cells and in cells expressing the InsP3 buffer targeted to the cytosol, but Ca2+ signals in both compartments are attenuated when the InsP3 buffer is targeted to the nucleus. (B) Summary of InsP3 buffer studies confirms that insulin-induced Ca2+ signaling are significantly attenuated by buffering nuclear but not cytosolic InsP3. Values are mean ± standard error of the mean (SEM) of the peak fluo-4 fluorescence attained during the observation period (expressed as % of baseline) and include the response from 23 nontransfected cells, seven cells expressing the InsP3 buffer targeted to the nucleus, and five cells expressing the InsP3 buffer targeted to the cytosol (*P < 0.005).
Fig. 7.
The insulin receptor translocates to the nucleus. (A) Immunoblots show the insulin receptor in nuclear and non-nuclear fractions of primary hepatocytes before and at serial time points after stimulation with insulin (10 nM). Trace amounts of the receptor are found in the nucleus at baseline, and this increases within 5 minutes and reach peak intensity within 10 minutes of stimulation. Blots are representative of what was observed in n = 3 separate experiments. Alpha-tubulin and Lamin B were used as purity controls for the non-nuclear and nuclear fraction, respectively.23 (B) Densitometric measurement of subcellular fractions of the insulin receptor. The amount of the insulin receptor in the nucleus is maximal within 10 minutes of stimulation (n = 3). Note that the increase in insulin receptor in the nucleus is transient and is temporally associated with a transient decrease in the receptor elsewhere in the cell. Measurements were normalized by alpha-tubulin and Lamin B levels in non-nuclear and nuclear fractions, respectively. Values are representative of what was observed in three separate experiments. (C) The phosphorylated insulin receptor reaches the nucleus. Insulin receptor was immunoprecipitated from the non-nuclear and nuclear fractions of hepatocytes before and 5 minutes after stimulation with insulin (10 nM), then probed with a phosphotyrosine-specific antibody. The phosphorylated receptor is found after but not before stimulation with insulin in both cell fractions.
Fig. 8.
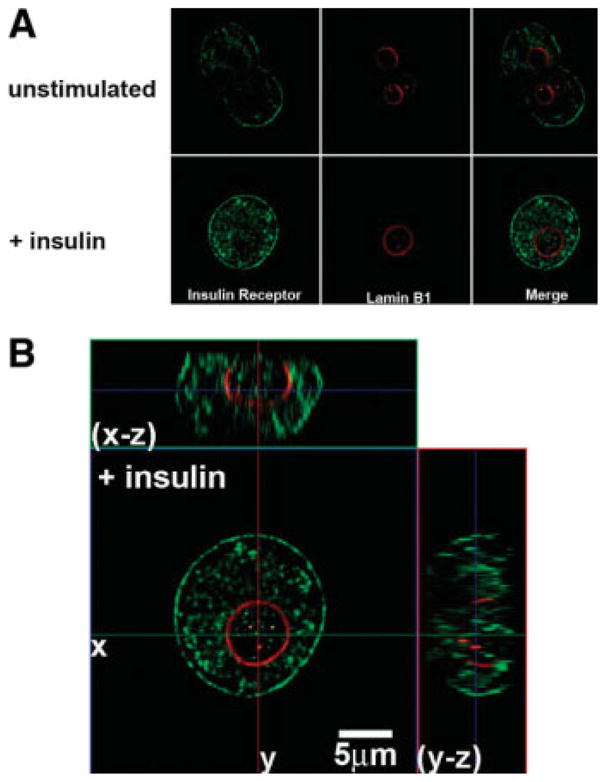
The insulin receptor translocates to the nucleus. (A) Confocal immunofluorescence images of the insulin receptor before and 5 minutes after stimulation with insulin (10 nM), respectively. Insulin receptor labeling is in green and the nuclear envelope is stained with Lamin B1 in red. Note that the receptor initially labels the plasma membrane and is heterogeneously distributed in the cytosol as well, but is excluded from the nuclear interior until after stimulation with insulin. (B) Serial confocal sections were collected for three-dimensional reconstruction. These double-labeled images confirm that the receptor is heterogeneously distributed within the nuclear interior after stimulation with insulin.
Discussion
Insulin is a potent mitogen for hepatocytes in vitro4 and also plays a role in liver regeneration in vivo.34 Insulin also plays an essential role in the growth and proliferation of hepatocytes in certain cell culture systems.35 Insulin acts through the insulin receptor, which is a RTK, and evidence from other RTKs suggests that translocation to the nucleus may be a common feature for this class of receptors. A number of RTKs have been found in the nucleus, including receptors for growth hormone, several cytokines, epidermal growth factor (EGF), hepatocyte growth factor, and fibroblast growth factor (FGF).21,36,37 Phosphorylated EGF receptor can be found in the nucleus within 1–2 minutes of stimulation with EGF, and reaches peak levels within 15 minutes.36 Phosphorylated hepatocyte growth factor receptor (c-met) appears in the nucleus within a similar time frame after stimulation with hepatocyte growth factor, and its appearance there has been linked to intranuclear formation of InsP3 and initiation of Ca2+ signals within the nucleus.21 Translocation of the FGF receptor to the nucleus occurs over a longer time scale, reaching peak amounts after 3–4 hours.37 Although these previous studies have demonstrated that RTKs can translocate to the nucleus in cell lines, the current work provides evidence that this also occurs in primary hepatocytes. Intranuclear RTKs can serve functional effects as well. For example, EGF receptors in the nucleus act as a transcription factor that promotes expression of cyclin D136 and COX-2,38 each of which may contribute to the mitogenic effects of EGF. The mechanism by which RTKs reach the nucleus is not known, although transport of the FGF receptor to the nucleus depends on importin β, rather than the presence of a nuclear localization sequence on either the receptor or its ligand,37 and transport of c-met to the nucleus depends upon both importin β and the adaptor protein GRB2-associated binding protein 1 (Gab1).21 Early studies based on binding of radiolabeled insulin to nuclear membranes,39 plus autoradiographic studies of hepatocytes and hepatocyte lysates using photolabeled insulin receptors,40 suggested that the insulin receptor can be intranuclear. This conclusion was questioned in later work using immunoblot and immunoelectron microscopic techniques,41 which had led many to conclude instead that the insulin receptor does not translocate to the nucleus.42 Similarly, previous evidence had suggested that the insulin receptor does not activate PLC, leading to the widely held conclusion that insulin does not stimulate the PLC/InsP3/Ca2+ signaling pathway.43,44 However, recent studies have shown an increase in InsP3 in rat epididymal cells stimulated with insulin,45 as well as an increase in PLC activity in insulin-stimulated adipocytes.46 Moreover, PLCγ coprecipitates with the insulin receptor, providing additional evidence that this receptor induces phospholipid hydrolysis.7 Finally, insulin has been reported to increase cytosolic Ca2+ in primary hepatocytes by triggering Ca2+ influx,47 but the current work provides evidence that insulin instead mobilizes intracellular Ca2+ stores in hepatocytes, through a PLC-dependent and InsP3-dependent mechanism. The current findings provide both structural and functional evidence that the insulin receptor moves to and acts within the nucleus in hepatocytes. Structural evidence includes immunoblots showing that total as well as phosphorylated insulin receptor accumulates in the nucleus, plus confocal immunofluorescence localization of the receptor within the nucleus. Functional evidence includes studies showing that insulin selectively hydrolyzes the nuclear pool of PIP2, plus Ca2+ imaging studies showing that insulin-induced Ca2+ signals can begin in the nucleus, and that these signals depend on intranuclear rather than cytoplasmic InsP3. Thus, previous studies plus the current work together suggest that insulin induces its receptor to move to the nucleus in hepatocytes, and this translocation is associated with PLC-mediated hydrolysis of nuclear PIP2, leading to formation of InsP3-mediated Ca2+ signals. Because Ca2+ signals within the nucleus are particularly important for cell growth,11 the effect of insulin on nuclear Ca2+ signaling may explain insulin’s action as a mitogen. The metabolic effects of insulin in the liver are mediated by Akt/protein kinase B, and these effects are enhanced in the liver-specific Gab1 knockout mouse.48 Since Gab1 may mediate nuclear translocation of RTKs,21 this suggests that the metabolic effects of insulin may be mediated by the non-nuclear insulin receptor, while the effects of insulin on growth and regeneration may be mediated by the insulin receptor that reaches the nucleus.
There is increasing evidence that the subcellular pattern of Ca2+ signals dictates the cellular effects of this second messenger. The InsP3 receptor is the only intracellular Ca2+ release channel in hepatocytes,18 so the subcellular distribution of this receptor determines the form of Ca2+ signals in these cells. For example, the type II InsP3 receptor, which is the principle isoform in hepatocytes, is most concentrated in the region of the endoplasmic reticulum beneath the canalicular membrane.18,19 Agonists such as vasopressin, angiotensin, or adenosine triphosphate increase InsP3 in the cytosol, and so the resulting Ca2+ signal takes the form of a Ca2+ wave that begins in the canalicular region, where the InsP3 receptor is most concentrated.18 This Ca2+ wave directs exocytosis49 and fluid and electrolyte secretion.50 Reduced expression of InsP3 receptors in hepatocytes impairs the formation of Ca2+ waves,51 but simple redistribution of the receptors away from the canalicular region impairs Ca2+ wave formation as well.19 This subcellular organization of the Ca2+ signaling machinery is relevant for the regulation of secretion, because treatment of cholangiocytes with small interfering RNA to decrease expression of apical InsP3 receptors in these cells results in impaired bicarbonate secretion.52 Expression of apical InsP3 receptors is also decreased or absent in bile ducts of patients with cholestatic disorders such as primary biliary cirrhosis, sclerosing cholangitis, and biliary atresia,53 although it has not yet been established that this loss of InsP3 receptors is responsible for the development of cholestasis in these disorders. Localization of InsP3 receptors to other microdomains can affect cell function as well. For example, the type III InsP3 receptor colocalizes more effectively than either the type I or II isoform of the receptor with mitochondria.54 This is associated with more efficient transmission of Ca2+ signals into the mitochondria, which in turn is more effective at inducing apoptosis.54 A number of Ca2+-mediated events occur in the nucleus; including: activation of cyclic adenosine monophosphate response element-binding transcription factor10 and the Elk-1 transcription factor9; translocation of nuclear protein kinase C to the region of the nuclear envelope14; and regulation of progression of the cell cycle through prophase.11 Although Ca2+ can spread passively from the cytosol into the nucleus under certain circumstances,55,56 intranuclear InsP3 can increase Ca2+ directly within the nucleus as well, in both isolated nuclei and in nuclei within intact cells.14,57 This is because the nuclear envelope57 and the nucleoplasmic reticulum14 both express InsP3 receptors, and these receptors can release Ca2+ into the nucleoplasm. How much InsP3 receptor is expressed in the nucleus? Although immunofluorescence studies suggest that the InsP3 receptor in hepatocytes is most concentrated in the pericanalicular region,18 quantitative immunoblots show that the ratio of nuclear:cytosolic InsP3 receptors is nearly 20:1.14 This ratio reflects InsP3 receptor concentration relative to other proteins in each compartment, but since there is presumably much less total protein per unit volume in the nucleus than in the cytoplasm, this may explain why immunofluorescence studies instead suggest that there is more InsP3 receptor in the cytoplasm. In any case, several mechanisms have been identified to control Ca2+ release from nuclear InsP3 receptors. The three InsP3 receptor isoforms have distinct sensitivities to InsP3, so targeting a more sensitive isoform to the nucleus will enable InsP3-mediated Ca2+ signals to occur preferentially in the nucleus, relative to the cytosol.20 Alternatively, selective hydrolysis of the nuclear pool of PIP2 will lead to local intranuclear formation of InsP3, so that Ca2+ will be released preferentially from nuclear InsP3 receptors. In particular, RTKs may selectively activate nuclear isoforms of PLC, particularly PLCβ1, and may also induce PLCγ1 to translocate to the nucleus.58,59 The current work suggests that the insulin receptor may also act in this fashion. Although insulin-induced Ca2+ signals begin before peak accumulation of the insulin receptor occurs within the nucleus, there is likely a threshold relationship rather than a linear relationship between accumulation of insulin receptor within the nucleus and triggering of Ca2+ signals, just as there is a threshold, “all-or-none” relationship between accumulation of InsP3 and initiation of Ca2+ signals in the cytoplasm.60 Therefore, although the increase in intranuclear insulin receptor does not become measurable for several minutes, smaller amounts, especially of the phosphorylated receptor, may be sufficient to generate enough InsP3 to initiate Ca2+ signals. Further work is needed to determine the mechanism by which the insulin receptor moves to the nucleus in hepatocytes and to demonstrate that this is responsible for insulin’s mitogenic effects.
Acknowledgments
Supported by National Institutes of Health (NIH) grants DK57751, DK34989, and DK45710, and by grants from the Conselho Nacional de Desenvolvimento Científico e Tecnológico, Fundação de Amparo à Pesquisa do Estado de Minas Gerais, and the Howard Hughes Medical Institute.
We thank Kathy Harry for hepatocyte isolations.
Abbreviations
- c-met
hepatocyte growth factor receptor
- Gab1
CRB2-associated binding protein 1
- EGF
epidermal growth factor
- FGF
fibroblast growth factor
- InsP3
inositol 1,4,5-trisphosphate
- KC1
potassium chloride
- MKK1
mitogen-activated protein kinase kinase 1
- mRFP
monomeric red fluorescent protein
- PIP2
phosphatidylinositol 4,5-bisphosphate
- PLC
phospholipase C
- RTK
receptor tyrosine kinase
Footnotes
Potential conflict of interest: Nothing to report.
References
- 1.Saltiel AR, Kahn CR. Insulin signalling and the regulation of glucose and lipid metabolism. Nature. 2001;414:799–806. doi: 10.1038/414799a. [DOI] [PubMed] [Google Scholar]
- 2.Rosen OM. After insulin binds. Science. 1987;237:1452–1458. doi: 10.1126/science.2442814. [DOI] [PubMed] [Google Scholar]
- 3.Straus DS. Growth-stimulatory actions of insulin in vitro and in vivo. Endocr Rev. 1984;5:356–369. doi: 10.1210/edrv-5-2-356. [DOI] [PubMed] [Google Scholar]
- 4.Koontz JW, Iwahashi M. Insulin as a potent, specific growth factor in a rat hepatoma cell line. Science. 1981;211:947–949. doi: 10.1126/science.7008195. [DOI] [PubMed] [Google Scholar]
- 5.Block GD, Locker J, Bowen WC, Petersen BE, Katyal S, Strom SC, et al. Population expansion, clonal growth, and specific differentiation patterns in primary cultures of hepatocytes induced by HGF/SF, EGF and TGF alpha in a chemically defined (HGM) medium. J Cell Biol. 1996;132:1133–1149. doi: 10.1083/jcb.132.6.1133. [DOI] [PMC free article] [PubMed] [Google Scholar]
- 6.De Meyts P, Whittaker J. Structural biology of insulin and IGF1 receptors: implications for drug design. Nat Rev Drug Discov. 2002;1:769–783. doi: 10.1038/nrd917. [DOI] [PubMed] [Google Scholar]
- 7.Eichhorn J, Kayali AG, Austin DA, Webster NJ. Insulin activates phospholipase C-gamma1 via a PI-3 kinase dependent mechanism in 3T3–L1 adipocytes. Biochem Biophys Res Commun. 2001;282:615–620. doi: 10.1006/bbrc.2001.4616. [DOI] [PubMed] [Google Scholar]
- 8.Nathanson MH, Rios-Velez L, Burgstahler AD, Mennone A. Communication via gap junctions modulates bile secretion in the isolated perfused rat liver. Gastroenterology. 1999;116:1176–1183. doi: 10.1016/s0016-5085(99)70021-1. [DOI] [PubMed] [Google Scholar]
- 9.Pusl T, Wu JJ, Zimmerman TL, Zhang L, Ehrlich BE, Berchtold MW, et al. Epidermal growth factor-mediated activation of the ETS domain transcription factor Elk-1 requires nuclear calcium. J Biol Chem. 2002;277:27517–27527. doi: 10.1074/jbc.M203002200. [DOI] [PubMed] [Google Scholar]
- 10.Hardingham GE, Chawla S, Johnson CM, Bading H. Distinct functions of nuclear and cytoplasmic calcium in the control of gene expression. Nature. 1997;385:260–265. doi: 10.1038/385260a0. [DOI] [PubMed] [Google Scholar]
- 11.Rodrigues MA, Gomes DA, Leite MF, Grant W, Zhang L, Lam W, et al. Nucleoplasmic calcium is required for cell proliferation. J Biol Chem. 2007;282:17061–17068. doi: 10.1074/jbc.M700490200. [DOI] [PMC free article] [PubMed] [Google Scholar]
- 12.Poenie M, Alderton J, Tsien RY, Steinhardt RA. Changes of free calcium levels with stages of the cell division cycle. Nature. 1985;315:147–149. doi: 10.1038/315147a0. [DOI] [PubMed] [Google Scholar]
- 13.Carrion AM, Link WA, Ledo F, Mellstrom B, Naranjo JR. DREAM is a Ca2+-regulated transcriptional repressor. Nature. 1999;398:80–84. doi: 10.1038/18044. [DOI] [PubMed] [Google Scholar]
- 14.Echevarria W, Leite MF, Guerra MT, Zipfel WR, Nathanson MH. Regulation of calcium signals in the nucleus by a nucleoplasmic reticulum. Nat Cell Biol. 2003;5:440–446. doi: 10.1038/ncb980. [DOI] [PMC free article] [PubMed] [Google Scholar]
- 15.Thompson M, Andrade VA, Andrade SJ, Pusl T, Ortega JM, Goes AM, et al. Inhibition of the TEF/TEAD transcription factor activity by nuclear calcium and distinct kinase pathways. Biochem Biophys Res Commun. 2003;301:267–274. doi: 10.1016/s0006-291x(02)03024-3. [DOI] [PubMed] [Google Scholar]
- 16.Saltiel AR, Pessin JE. Insulin signaling pathways in time and space. Trends Cell Biol. 2002;12:65–71. doi: 10.1016/s0962-8924(01)02207-3. [DOI] [PubMed] [Google Scholar]
- 17.Boyer JL, Phillips JM, Graf J. Preparation and specific applications of isolated hepatocyte couplets. Methods Enzymol. 1990;192:501–516. doi: 10.1016/0076-6879(90)92090-z. [DOI] [PubMed] [Google Scholar]
- 18.Hirata K, Pusl T, O’Neill AF, Dranoff JA, Nathanson MH. The type II inositol 1,4,5-trisphosphate receptor can trigger Ca2+ waves in rat hepatocytes. Gastroenterology. 2002;122:1088–1100. doi: 10.1053/gast.2002.32363. [DOI] [PubMed] [Google Scholar]
- 19.Nagata J, Guerra MT, Shugrue CA, Gomes DA, Nagata N, Nathanson MH. Lipid rafts establish calcium waves in hepatocytes. Gastroenterology. 2007;133:256–267. doi: 10.1053/j.gastro.2007.03.115. [DOI] [PMC free article] [PubMed] [Google Scholar]
- 20.Leite MF, Thrower EC, Echevarria W, Koulen P, Hirata K, Bennett AM, et al. Nuclear and cytosolic calcium are regulated independently. Proc Natl Acad Sci U S A. 2003;100:2975–2980. doi: 10.1073/pnas.0536590100. [DOI] [PMC free article] [PubMed] [Google Scholar]
- 21.Gomes DA, Rodrigues MA, Leite MF, Gomez MV, Varnai P, Balla T, et al. c-Met must translocate to the nucleus to initiate calcium signals. J Biol Chem. 2008;283:4344–4351. doi: 10.1074/jbc.M706550200. [DOI] [PMC free article] [PubMed] [Google Scholar]
- 22.Hsu SC, Hung MC. Characterization of a novel tripartite nuclear localization sequence in the EGFR family. J Biol Chem. 2007;282:10432–10440. doi: 10.1074/jbc.M610014200. [DOI] [PubMed] [Google Scholar]
- 23.Lo HW, Ali-Seyed M, Wu Y, Bartholomeusz G, Hsu SC, Hung MC. Nuclear-cytoplasmic transport of EGFR involves receptor endocytosis, importin beta1 and CRM1. J Cell Biochem. 2006;98:1570–1583. doi: 10.1002/jcb.20876. [DOI] [PubMed] [Google Scholar]
- 24.Gray A, Olsson H, Batty IH, Priganica L, Peter DC. Nonradioactive methods for the assay of phosphoinositide 3-kinases and phosphoinositide phosphatases and selective detection of signaling lipids in cell and tissue extracts. Anal Biochem. 2003;313:234–245. doi: 10.1016/s0003-2697(02)00607-3. [DOI] [PubMed] [Google Scholar]
- 25.Serrano R, Villar M, Martinez C, Carrascosa JM, Gallardo N, Andres A. Differential gene expression of insulin receptor isoforms A and B and insulin receptor substrates 1, 2 and 3 in rat tissues: modulation by aging and differentiation in rat adipose tissue. J Mol Endocrinol. 2005;34:153–161. doi: 10.1677/jme.1.01635. [DOI] [PubMed] [Google Scholar]
- 26.Nathanson MH, Burgstahler AD, Fallon MB. Multistep mechanism of polarized Ca2+ wave patterns in hepatocytes. Am J Physiol. 1994;267(Pt 1):G338–G349. doi: 10.1152/ajpgi.1994.267.3.G338. [DOI] [PubMed] [Google Scholar]
- 27.Woods NM, Cuthbertson KS, Cobbold PH. Repetitive transient rises in cytoplasmic free calcium in hormone-stimulated hepatocytes. Nature. 1986;319:600–602. doi: 10.1038/319600a0. [DOI] [PubMed] [Google Scholar]
- 28.Rooney TA, Sass EJ, Thomas AP. Characterization of cytosolic calcium oscillations induced by phenylephrine and vasopressin in single fura-2-loaded hepatocytes. J Biol Chem. 1989;264:17131–17141. [PubMed] [Google Scholar]
- 29.Divecha N, Banfic H, Irvine RF. The polyphosphoinositide cycle exists in the nuclei of Swiss 3T3 cells under the control of a receptor (for IGF-I) in the plasma membrane, and stimulation of the cycle increases nuclear diacylglycerol and apparently induces translocation of protein kinase C to the nucleus. EMBO J. 1991;10:3207–3214. doi: 10.1002/j.1460-2075.1991.tb04883.x. [DOI] [PMC free article] [PubMed] [Google Scholar]
- 30.Hirata K, Nathanson MH, Burgstahler AD, Okazaki K, Mattei E, Sears ML. Relationship between inositol 1,4,5-trisphosphate receptor isoforms and subcellular Ca2+ signaling patterns in nonpigmented ciliary epithelia. Invest Ophthalmol Vis Sci. 1999;40:2046–2053. [PubMed] [Google Scholar]
- 31.Gafni J, Munsch JA, Lam TH, Catlin MC, Costa LG, Molinski TF, et al. Xestospongins: potent membrane permeable blockers of the inositol 1,4,5-trisphosphate receptor. Neuron. 1997;19:723–733. doi: 10.1016/s0896-6273(00)80384-0. [DOI] [PubMed] [Google Scholar]
- 32.Irvine RF. Nuclear lipid signalling. Nat Rev Mol Cell Biol. 2003;4:349–360. doi: 10.1038/nrm1100. [DOI] [PubMed] [Google Scholar]
- 33.Balla A, Tuymetova G, Barshishat M, Geiszt M, Balla T. Characterization of type II phosphatidylinositol 4-kinase isoforms reveals association of the enzymes with endosomal vesicular compartments. J Biol Chem. 2002;277:20041–20050. doi: 10.1074/jbc.M111807200. [DOI] [PubMed] [Google Scholar]
- 34.Michalopoulos GK, DeFrances MC. Liver regeneration. Science. 1997;276:60–66. doi: 10.1126/science.276.5309.60. [DOI] [PubMed] [Google Scholar]
- 35.Michalopoulos G, Pitot HC. Primary culture of parenchymal liver cells on collagen membranes. Morphological and biochemical observations. Exp Cell Res. 1975;94:70–78. doi: 10.1016/0014-4827(75)90532-7. [DOI] [PubMed] [Google Scholar]
- 36.Lin SY, Makino K, Xia W, Matin A, Wen Y, Kwong KY, et al. Nuclear localization of EGF receptor and its potential new role as a transcription factor. Nat Cell Biol. 2001;3:802–808. doi: 10.1038/ncb0901-802. [DOI] [PubMed] [Google Scholar]
- 37.Reilly JF, Maher PA. Importin beta-mediated nuclear import of fibroblast growth factor receptor: role in cell proliferation. J Cell Biol. 2001;152:1307–1312. doi: 10.1083/jcb.152.6.1307. [DOI] [PMC free article] [PubMed] [Google Scholar]
- 38.Wang SC, Lien HC, Xia W, Chen IF, Lo HW, Wang Z, et al. Binding at and transactivation of the COX-2 promoter by nuclear tyrosine kinase receptor ErbB-2. Cancer Cell. 2004;6:251–261. doi: 10.1016/j.ccr.2004.07.012. [DOI] [PubMed] [Google Scholar]
- 39.Wong KY, Hawley D, Vigneri R, Goldfine ID. Comparison of solubilized and purified plasma membrane and nuclear insulin receptors. Biochemistry. 1988;27:375–379. doi: 10.1021/bi00401a056. [DOI] [PubMed] [Google Scholar]
- 40.Podlecki DA, Smith RM, Kao M, Tsai P, Huecksteadt T, Brandenburg D, et al. Nuclear translocation of the insulin receptor. A possible mediator of insulin’s long term effects. J Biol Chem. 1987;262:3362–3368. [PubMed] [Google Scholar]
- 41.Soler AP, Thompson KA, Smith RM, Jarett L. Immunological demonstration of the accumulation of insulin, but not insulin receptors, in nuclei of insulin-treated cells. Proc Natl Acad Sci U S A. 1989;86:6640–6644. doi: 10.1073/pnas.86.17.6640. [DOI] [PMC free article] [PubMed] [Google Scholar]
- 42.Wells A, Marti U. Signalling shortcuts: cell-surface receptors in the nucleus? Nat Rev Mol Cell Biol. 2002;3:697–702. doi: 10.1038/nrm905. [DOI] [PubMed] [Google Scholar]
- 43.Taylor D, Uhing RJ, Blackmore PF, Prpic V, Exton JH. Insulin and epidermal growth factor do not affect phosphoinositide metabolism in rat liver plasma membranes and hepatocytes. J Biol Chem. 1985;260:2011–2014. [PubMed] [Google Scholar]
- 44.Nishibe S, Wahl MI, Hernandez-Sotomayor SM, Tonks NK, Rhee SG, Carpenter G. Increase of the catalytic activity of phospholipase C-gamma 1 by tyrosine phosphorylation. Science. 1990;250:1253–1256. doi: 10.1126/science.1700866. [DOI] [PubMed] [Google Scholar]
- 45.Farese RV, Kuo JY, Babischkin JS, Davis JS. Insulin provokes a transient activation of phospholipase C in the rat epididymal fat pad. J Biol Chem. 1986;261:8589–8592. [PubMed] [Google Scholar]
- 46.Koepfer-Hobelsberger B, Wieland OH. Insulin activates phospholipase C in fat cells: similarity with the activation of pyruvate dehydrogenase. Mol Cell Endocrinol. 1984;36:123–129. doi: 10.1016/0303-7207(84)90091-1. [DOI] [PubMed] [Google Scholar]
- 47.Benzeroual K, Van de WG, Meloche S, Mathe L, Romanelli A, Haddad P. Insulin induces Ca2+ influx into isolated rat hepatocyte couplets. Am J Physiol. 1997;272(Pt 1):G1425–G1432. doi: 10.1152/ajpgi.1997.272.6.G1425. [DOI] [PubMed] [Google Scholar]
- 48.Bard-Chapeau EA, Hevener AL, Long S, Zhang EE, Olefsky JM, Feng GS. Deletion of Gab1 in the liver leads to enhanced glucose tolerance and improved hepatic insulin action. Nat Med. 2005;11:567–571. doi: 10.1038/nm1227. [DOI] [PubMed] [Google Scholar]
- 49.Ito K, Miyashita Y, Kasai H. Micromolar and submicromolar Ca2+ spikes regulating distinct cellular functions in pancreatic acinar cells. EMBO J. 1997;16:242–251. doi: 10.1093/emboj/16.2.242. [DOI] [PMC free article] [PubMed] [Google Scholar]
- 50.Kasai H, Augustine GJ. Cytosolic Ca2+ gradients triggering unidirectional fluid secretion from exocrine pancreas. Nature. 1990;348:735–738. doi: 10.1038/348735a0. [DOI] [PubMed] [Google Scholar]
- 51.Hernandez E, Leite MF, Guerra MT, Kruglov EA, Bruna-Romero O, Rodrigues MA, et al. The spatial distribution of inositol 1,4,5-trisphosphate receptor isoforms shapes Ca2+ waves. J Biol Chem. 2007;282:10057–10067. doi: 10.1074/jbc.M700746200. [DOI] [PMC free article] [PubMed] [Google Scholar]
- 52.Minagawa N, Nagata J, Shibao K, Masyuk AI, Gomes DA, Rodrigues MA, et al. Cyclic AMP regulates bicarbonate secretion in cholangiocytes through release of ATP into bile. Gastroenterology. 2007;133:1592–602. doi: 10.1053/j.gastro.2007.08.020. [DOI] [PMC free article] [PubMed] [Google Scholar]
- 53.Shibao K, Hirata K, Robert ME, Nathanson MH. Loss of inositol 1,4,5-trisphosphate receptors from bile duct epithelia is a common event in cholestasis. Gastroenterology. 2003;125:1175–1187. doi: 10.1016/s0016-5085(03)01201-0. [DOI] [PMC free article] [PubMed] [Google Scholar]
- 54.Mendes CC, Gomes DA, Thompson M, Souto NC, Goes TS, Goes AM, et al. The type III inositol 1,4,5-trisphosphate receptor preferentially transmits apoptotic Ca2+ signals into mitochondria. J Biol Chem. 2005;280:40892–40900. doi: 10.1074/jbc.M506623200. [DOI] [PubMed] [Google Scholar]
- 55.Lipp P, Thomas D, Berridge MJ, Bootman MD. Nuclear calcium signalling by individual cytoplasmic calcium puffs. EMBO J. 1997;16:7166–7173. doi: 10.1093/emboj/16.23.7166. [DOI] [PMC free article] [PubMed] [Google Scholar]
- 56.Fox JL, Burgstahler AD, Nathanson MH. Mechanism of long-range Ca2+ signalling in the nucleus of isolated rat hepatocytes. Biochem J. 1997;326(Pt 2):491–495. doi: 10.1042/bj3260491. [DOI] [PMC free article] [PubMed] [Google Scholar]
- 57.Gerasimenko OV, Gerasimenko JV, Tepikin AV, Petersen OH. ATP-dependent accumulation and inositol trisphosphate- or cyclic ADP-ribose-mediated release of Ca2+ from the nuclear envelope. Cell. 1995;80:439–444. doi: 10.1016/0092-8674(95)90494-8. [DOI] [PubMed] [Google Scholar]
- 58.Xu A, Suh PG, Marmy-Conus N, Pearson RB, Seok OY, Cocco L, et al. Phosphorylation of nuclear phospholipase C beta1 by extracellular signal-regulated kinase mediates the mitogenic action of insulin-like growth factor I. Mol Cell Biol. 2001;21:2981–2990. doi: 10.1128/MCB.21.9.2981-2990.2001. [DOI] [PMC free article] [PubMed] [Google Scholar]
- 59.Klein C, Gensburger C, Freyermuth S, Nair BC, Labourdette G, Malviya AN. A 120 kDa nuclear phospholipase Cgamma1 protein fragment is stimulated in vivo by EGF signal phosphorylating nuclear membrane EGFR. Biochemistry. 2004;43:15873–15883. doi: 10.1021/bi048604t. [DOI] [PubMed] [Google Scholar]
- 60.Parker I, Ivorra I. Localized all-or-none calcium liberation by inositol trisphosphate. Science. 1990;250:977–979. doi: 10.1126/science.2237441. [DOI] [PubMed] [Google Scholar]


