

Abstract
Potassium channels allow K+ ions to easily diffuse through their pores while effectively preventing smaller Na+ ions from permeation. The ability to discriminate between these two similar and abundant ions is vital for these proteins to control electrical and chemical activity in all organisms. This selection process occurs at the narrow selectivity filter that contains structurally identified K+ binding-sites. Selectivity is thought to arise because smaller ions such as Na+ do not bind to these K+ sites in a thermodynamically favorable way. Using the model K+ channel KcsA, we examined how intracellular Na+ and Li+ interact with the pore and the permeant ions using electrophysiology, molecular dynamics simulations, and X-ray crystallography. Our results suggest that these small cations have a binding site within the K+ selectivity filter, albeit different from the K+ sites. We propose that selective permeation from the intracellular side is achieved mainly by a large energy barrier blocking filter entry for Na+ and Li+ in the presence of K+, and not by a difference of binding affinity between ions inside the selectivity filter.
INTRODUCTION
An important characteristic for an ion channel is its selectivity for a particular ion. In K+ channels, the exquisite selectivity for K+ over smaller ions, especially Na+, is crucial for physiological function. As a result, identification of the mechanisms of K+ channel selectivity has been the focus of decades of ion channel research1–7. Early electrophysiological studies by Bezanilla and Armstrong1 proposed that selectivity in K+ channels is determined by the rates with which ions enter the pore, favoring a mechanism of ionic selectivity by selective exclusion (a kinetic view). Later, Neyton and Miller4,5 proposed that the K+ channel pore is composed of multiple sites with high affinities for permeant ions and low affinities for impermeant ions, favoring a mechanism of selectivity by selective binding (a thermodynamic view).
High-resolution structures of K+ channels from MacKinnon and coworkers6–10 appear consistent with the selective binding mechanism. In the narrow pore region forming the selectivity filter of K+ channels, the backbone carbonyl and threonine hydroxyl oxygens of the highly conserved TVGYG sequence1,11–13 form a series of distinct K+ binding sites, termed S1–S47,9 (Fig. 1a). These oxygen atoms coordinate K+ to compensate for the energetic cost of dehydration as they enter the narrow pore1,7,9. The “snug-fit” hypothesis for selectivity suggests that these S-sites will not optimally coordinate the smaller Na+ and thus cannot compensate for the ion dehydration energy, rendering Na+-binding thermodynamically unfavorable7,9.
Figure 1. Intracellular Li+ and Na+ modify the outward K+ current.

a, Two opposing KcsA subunits (ribbon), with oxygens (red stick) shown in the selectivity filter. The K+ binding sites (purple) and their z-coordinate relative to the center of mass of the filter atoms (defined by the backbone atoms of residues 75–78, in Å) are indicated. b, Single-channel KcsA recordings in 100mM symmetric K+ at indicated voltages, before and after addition of 5mM intracellular Li+ and Na+, as indicated in the figure.
Molecular dynamics (MD) simulations and structural studies7,9 of the KcsA channel have determined that individual S-sites are not equivalent; while there is selective binding for K+ over Na+ in sites S1–S3 inside the filter, limited selectivity was found for the aqueous cavity (Fig. 1a) and the S4 region14–20. Furthermore, it was proposed that the selective S-sites maintain selectivity for K+ over Na+ even during normal thermal fluctuations that could allow a “snug fit” for the smaller Na+16,21–23.
Irrespective of the exact mechanism of discrimination within these particular coordination sites, recent work appears to implicitly favor the hypothesis of selectivity by selective binding; K+ channels prevent Na+ from permeation because accommodating a Na+ inside the selectivity filter is a thermodynamically unfavorable process. Due to the multi-ion nature of K+ channels2, it is likely that the story is more complex and multiple mechanisms are at work to define selectivity in K+ channels 24,25.
Our studies suggest a mechanism for K+ channel selection against intracellular Na+ differing from that of selectivity through selective binding. Using the KcsA model K+ channel from Streptomyces lividans, we investigated the interaction of the small cations Na+ and Li+ with permeant ions within the intracellular side of the channel pore in order to elucidate the mechanism of exclusion under physiological conditions.
We employed electrophysiology (planar lipid bilayers), MD, and X-ray crystallography to probe the elusive selectivity property. While each technique has its limitations, using all three in concert offers a strong, consistent picture of the mechanism. We propose that both Na+ and Li+ have at least one binding site within the selectivity filter, distinct from the S-sites for K+. Our MD and X-ray crystallography data suggest that this binding site, termed the B-site, is positioned between S3 and S4 in-plane with the Thr75 carbonyl oxygen atoms. In order for intracellular Na+ or Li+ to bind at the B-site these two consecutive S-sites (S3 and S4) must be vacated by K+. We calculated that the outward movement of K+ in the selectivity filter required to liberate these S-sites is associated with a substantial free energy barrier. Consequently, these smaller ions rarely reach the B-site under physiological conditions. We propose that the height of this K+-induced energy barrier encountered by Na+ and Li+ before they reach the S4 region underlies selectivity against small intracellular monovalent cations by K+ channels. Our data regarding the initial rejection step against intracellular Na+ from the selectivity filter of K+ channels are in closer agreement with the original suggestion of selectivity by selective exclusion proposed by Bezanilla and Armstrong1 and reveal this mechanism of exclusion with microscopic detail.
RESULTS
Intracellular Na+ and Li+ affect the outward K+ current through KcsA
We previously showed that intracellular Na+ blocks the outward K+ flux through KcsA channels by binding with fast kinetics and low, voltage-dependent affinity in the pore26, as evidenced by a decrease in the amplitude of the single-channel currents in the presence of Na+ (fast block, Fig. 1b). We found that the fast blocking site (proposed at the time to be in the aqueous cavity) had a 5–7-fold preference for K+ over Na+ ions26,27, a binding selectivity that paled in comparison to that calculated at selectivity filter sites15,19 but whose origins were not immediately apparent (a 5–7-fold preference corresponds to a ΔΔG(Na+-K+) of ~1kcal/mol). We then hypothesized that this preference was due to the requirement of partial hydration shell disruption for Na+ to bind at its preferred site in the cavity. The presence of Na+ on the intracellular side also had a “gating” effect: it induced a dramatic decrease in open probability, mostly noticeable at high voltages (Fig. 1b). This latter effect was previously left at the observational level26.
The features of the fast Na+ block as well as the unstudied slow, gating effect, inspired further investigation of the interaction of Na+ with the KcsA pore by also using Li+ as a probe. Li+, a smaller (radius of ~0.6Å, compared to 1.33 and 0.95Å for K+ and Na+ respectively28), more strongly hydrated monovalent cation is a good probe to test the hydration shell disruption hypothesis and ascertain potential binding locations for these ions. We analyzed the fast block and slow gating effects in detail to gain insight into the mechanism of Na+ and Li+ interaction with K+ ions and the KcsA pore.
Intracellular Li+ blocks K+ current with fast kinetics in the cavity
Li+ blocked outward K+ flux from the intracellular side with fast kinetics in a similar manner to Na+, by decreasing the single-channel current amplitude (Fig. 1 and 2). The current was blocked more at higher voltages, indicating that Li+ block is voltage dependent, as expected if the Li+ blocking site is located within the transmembrane electric field (Fig. 2a). The block parameters (apparent affinity, Kappb, and voltage-dependence, z) were obtained as previously described26 using the Woodhull29 equilibrium block model over a range of K+ concentrations (Eq. 1 and 2 in Supplementary Discussion). Li+ shows higher apparent affinity for its blocking-site than Na+ (Fig. 2b). The apparent affinity for Li+ block decreases as the K+ concentration is increased, indicating that K+ and Li+ compete for the same binding site where K+ is preferred twofold to Li+ (Fig. 2b, and Supplementary Discussion). A similar analysis for Na+ block previously showed that K+ is preferred fivefold to Na+26. The fast block effect revealed the following selectivity sequence for binding at the fast blocking sites: KK<KLi<KNa. This sequence differs from the sequence of hydration free energies for these ions (ΔG0hydration, in kcal/mol: Li+ = −123.1, Na+ = −96.6, K+ = −79.430), suggesting either that hydration is not the largest factor contributing to the ionic selectivity at these sites or that Na+ and Li+ block at different sites.
Figure 2. Intracellular Li+ blocks K+ current with fast kinetics.

a, Open channel I–V at 100mM K+ (black circles), with 10mM (red), and 20mM (blue) intracellular Li+. Data are the mean of at least 3 measurements with S.E.M. error bars. Black circles are fit with a sigmoidal curve (black line). Red and blue lines represent fits with Eq.1 26 in the Supplementary Discussion and the following parameters (± s.e. from fit) for 10 and 20mM Li+, respectively: KBap(0)=268.4±33.8 and 345.4±45.9 mM, z =0.40±0.02. b, Apparent Li+ blocking affinity over a range of K+ concentrations. Data points are from fits as in a. Each symbol is mean ± S.E.M. of at least three different experiments. The red line represents a linear fit to equation Eq. S3, with a slope of 2.3. For comparison, a black dashed line (slope of 5.2 from ref. 26) is shown, for Na+ block. c, Voltage dependence of Li+ block is constant over a range of K+ concentrations. Red circles represent the mean ± S.E.M. from at least six experiments at each K+ concentration (from fits as in a). For comparison, the black dashed line shows the increase in voltage dependence for Na+ block26.
The voltage-dependence of Li+ block (z) is constant over a range of K+ concentrations (Fig. 2c). The z-value is a measure of the effective distance the blocking ion travels in the electric field to reach its binding site. An increase in z with the permeant ion concentration suggests the movement of the blocker to its site is coupled with the movement of permeant ions in the pore31, as was previously found for Na+26. The lack of dependence on the K+ concentration suggests the movement of Li+ to its blocking site may not be as strongly coupled with the movement of permeant ions in the filter 26, which can be interpreted as Li+ binding farther away from the selectivity filter than Na+. Li+ and Na+ appear to converge to z~0.4 at low concentrations of permeant ions, indicating that they block in the same pore region. These data are consistent with our previous conclusions26 that both Li+ and Na+ ions block K+ current with low affinity and fast kinetics in the K+ channel aqueous cavity, but possibly at different locations in the cavity (a z value of 0.4 is in agreement with previous calculations of the fraction of electric field drop over the KcsA cavity32, assuming that a component of the voltage dependence of Na+ and Li+ block comes from coupling between blocker moving to its site and permeant ions moving in the selectivity filter).
Intracellular Na+ and Li+ lead to a decrease in channel activity
Wild type KcsA gating is characterized by bursts of openings separated by long closed intervals (Fig. 1b), believed to represent excursions to inactivated states33. Addition of intracellular Na+ and Li+ leads to a dramatic decrease in open probability particularly at high, non-physiological voltages (Fig. 1b, 200 mV). A detailed kinetic analysis reveals that the Na+/Li+-induced decrease in open probability is due in large part to a dramatic shortening of these burst durations (Fig. 3a,b). The long closed inactivated intervals were not analyzed quantitatively, due to uncertainties in the numbers of channels between perfusion events caused by the known low steady state open probability of wild type KcsA34–36. The kinetics within the burst showed that the mean open time decreased in the presence of Na+/Li+ (Fig. 3c,d) while the durations of the intraburst closed intervals were not affected (Fig. 3e). The dramatic decrease in burst duration (and mean open time) with Na+/Li+ was both voltage and concentration-dependent. The concentration of Na+ and Li+ required for the half maximal effect at 100 mV was ~4mM (Fig. 3a–d), markedly lower than the concentration required to induce the fast block (~100mM at 100mV) suggesting that the fast and the slow Na+/Li+ effects on the K current may have two independent causes.
Figure 3. Intracellular Na+ and Li+ induce decrease of burst durations, consistent with slow block.

Decrease in burst durations as a function of Na+ (a) and Li+ (b) concentration. Decrease in mean open time as a function of Na+ (c) and Li+ (d) concentrations. Each plot represents data from a single bilayer perfused to all indicated blocker concentrations. The data in a and c, and the data in b and d, are from the same datasets, respectively. Different colors indicate different voltages: +50 mV (black), +100 mV (red), and +200 mV (blue). Solid lines in a and b represent global fits of the data with Eq.1, where kNa+(0)=0.11 M−1s−1, kLi+(0)=0.07 M−1s−1, zNa+= zLi+=0.5. zLi+ was constrained to be equal to zNa+ due to the difficulty in fitting the Li+ data with a unique set of parameters. Solid lines in c and d have no theoretical significance. e, Representative closed dwell time distributions from control and with intracellular blocker conditions indicated from data at +200 mV. The dashed lines mark the critical time used (15 msec) to separate intraburst from interburst closed times. The lines are fits with sums of two exponential components with the following parameters: control (τ1=0.84±0.08, τ2=1714±3.02, A1=0.97±0.06, A2=0.03±0.05), Li (τ1=1.3±0.11, τ 2=512±0.7, A1=0.87±0.07, A2=0.13±0.07), and Na+ (τ1=0.75±0.23, τ 2=2177±0.78, A1=0.81±0.13, A2=0.19±0.1). All experiments were repeated at least 3 times with similar outcomes. The data in this entire figure were not averaged due to substantial differences between individual bilayers, as previously reported34.
An obvious explanation that can account for the shortening of the bursts is that Na+ and Li+ binding in the cavity (to produce the fast block) also promotes channel entry into an inactivated state (see Scheme I in Supplementary Discussion), a mechanism inconsistent with two independent processes. Another plausible explanation for our data is that Na+ and Li+ induce the decrease in burst duration by binding with higher affinity at a site in the pore distinct from the site used for fast block, blocking K+ permeation on a slow time scale. This latter model, shown in Scheme II in Supplementary Discussion, is consistent with our MD and X-ray crystallography data, described in the following sections. Thus, we propose that intracellular Na+ and Li+ block the K+ flow through KcsA by binding with different affinities at two distinct sites in the KcsA pore. We propose that the low affinity fast block site occurs in the aqueous cavity of KcsA. It is possible that the second, higher-affinity binding site that leads to a decrease in mean burst durations occurs in the selectivity filter, as it requires larger voltages to become apparent. The existence of a binding site for Na+ in the selectivity filter is supported by previous experimental evidence for Na+ escaping through the selectivity filter at high voltages (punchthrough26). Li+ does not display block relief over the range of voltages explored (Fig. 2a). However, the decrease in the amplitude of Li+-modified K+ current appears to deviate from classical Woodhull block29 at high voltages (~300mV, Fig. 2a) suggesting potential Li+-punchthrough, but at higher voltages than required for Na+.
Electrophysiology measurements are very informative about interactions of ions with the KcsA pore. However, this technique cannot pinpoint the location or the coordination chemistry of the ion binding sites. To investigate the pore binding site locations for Li+ and Na+, we took two approaches: 1) we employed MD simulations to identify potential binding sites and energetic barriers encountered by Li+ and Na+ as they attempt to negotiate the KcsA pore in the presence of K+, and 2) we crystallized KcsA in the presence of Li+ (a crystal structure of KcsA in Na+ at 3.2Å resolution already exists8).
Free energy calculations identify Na+ and Li+ binding sites
Previous simulation studies of KcsA have revealed little selectivity for K+ over Na+ ions to bind in the cavity or the S4 region, but a strong selectivity for K+ at other sites, especially S214–20,37–39. Yet blocking experiments, such as described above, indicate that Na+ and Li+, under physiological conditions, are likely excluded from the channel before they reach the S2 site from the cavity. We carried out free energy perturbation (FEP) calculations to determine the relative free energies of K+, Na+ and Li+ ions in the cavity and the S4 region using a fully atomistic system (Fig. 4a). All calculations were performed with K+ ions present in the selectivity filter, using the two multi-ion configurations which represent the two low free energy configurations for K+ ions during conduction: S1/S3/Cavity and S0/S2/S4 (Fig. 1a)7,9,14,15.
Figure 4. Molecular dynamics simulations show different binding sites for K+, Na+, and Li+ within the S4 region.
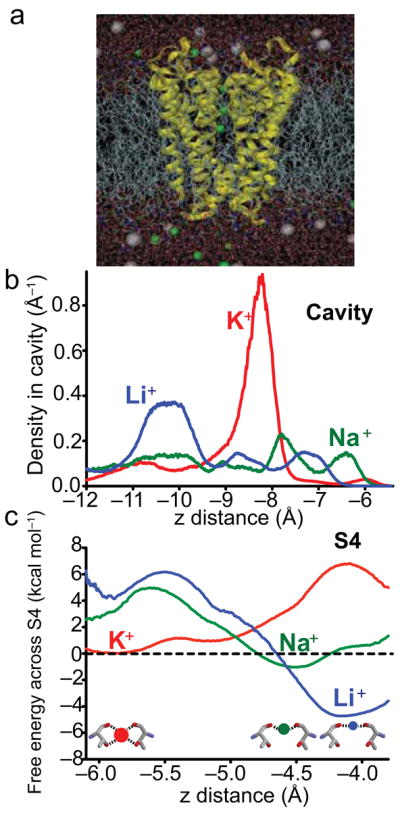
a, MD system consisting of KcsA (yellow) embedded in a DPPC lipid bilayer (gray tails) and 150mM KCl solution (water - red/white sticks, K+ and Cl− are green and gray spheres, respectively). b, Probability density of ions in the cavity obtained from corresponding free energy profiles such as in Fig. 4c. c, Free energy profile across the S4–S3 region from the 8-carbonyl coordinated “cage” to the 4-carbonyl coordinated “plane” obtained from analysis of FEP simulations. The insets illustrate the free energy minimum locations in the S4 region for K+, Na+ and Li+ ions (red, green, and blue circles respectively). Because each free energy profile is determined only to within a constant, the curves for Na+ and Li+ have been shifted, relative to K+, based on relative free energies in the S4 cage, given in Supplementary Table 2. An almost identical result was obtained when based on relative free energies in the S4 plane (not shown). The RMSD errors in the curves are 0.8, 0.4 and 1.0 kcal mol−1 for K+, Na+ and Li+, respectively (explained in the Supplementary Methods). The z-coordinate (x-axes in Fig. 4 and 6) maps positions along the pore as shown in Fig. 1a and 5e and is relative to the center of mass of the selectivity filter.
Supplementary Table 1 shows the positions/coordination of the ions in different regions of the pore while Supplementary Table 2 shows the relative free energies of the ions in different sites. The aqueous cavity was found to be roughly nonselective, with free energies of Na+ and Li+ relative to K+ similar to bulk water. This lack of selectivity may appear at odds with the small preference for K+ over Na+ determined from the electrophysiological measurements (Fig. 2). However, a factor of 5–7 between K+ and Na+ corresponds to a ΔΔG(K+-Na+) of ~1 kcal mol−1, which is within the error of the MD calculations (Supplementary Methods). In the cavity, our calculations reveal an absence of high-affinity binding sites (Fig. 4b). All ions are distributed across the cavity, with only a slight preference for K+ to bind weakly in the center, and for Li+ to bind deep in the cavity, away from the filter (Fig. 4b). The absence of high-affinity binding in the cavity is consistent with the electrophysiologically-observed fast block by Na+ and Li+ (Fig. 2). A preferred Li+ cavity position further away from the selectivity filter is consistent with reduced interaction of Li+ with permeant ions inferred from electrophysiology (Fig. 2c).
Remarkably, in the S4 region of the selectivity filter, we find a preference for both Na+ and Li+ binding over K+ (Supplementary Table 2). However, the position of the free energy minima for Na+ and Li+ is between K+ sites S3 and S4, near the plane of the Thr75 carbonyl oxygen atoms (together with two strongly coordinated water molecules), and not in the Thr75 carbonyl-hydroxyl oxygen “cage” that coordinates the K+ sites (Supplementary Table 1, Fig. 4c). We call this in-plane, 6-ligand location, the B-site. The B-site provides stronger interactions for the smaller ions than the S4 cage-site (in Supplementary Discussion, Supplementary Table S2). Unbiased simulations (where the ion is free to explore entire region) demonstrate that the S4 “region” is slightly selective for Na+ over K+ by −1.5kcal/mol, yet strongly selective for Li+ over K+ by −4.2kcal/mol (Supplementary Table 2). The S4 “region” is more thermodynamically stable for Na+ and Li+ than K+ because it consists of two distinct binding sites with different coordination geometries: the crystallographically-observed “cage” K+ binding S-site and the adjacent “plane” B-site. Biased simulations (where the ion is confined to a specific location) performed separately in the cage and plane sites reveal that while the cage of S4 is reminiscent of other K+-selective S-sites (4–5 kcal/mol selective for K+), the in-plane B-site is strongly selective for Na+ or Li+ (by ~5 and 9 kcal/mol, respectively) (Supplementary Table 2). Interestingly, we find a similar tendency for the smaller ions to move to the plane of carbonyls (other “B-sites”) even deeper inside the filter (data not shown), also reported for KcsA40,41 and for the NaK channel42,43. As we show later, the location of the B-site between S3 and S4 has a dramatic effect on the energetics of conduction of small ions in the presence of K+.
These calculations predict low affinity binding sites in the cavity for K+, Na+, and Li+ ions, consistent with the fast block observed in our functional experiments (Fig. 1 and 2). Calculation of a second binding site for Na+ and Li+ in the KcsA selectivity filter is consistent with their slow-blocking effect also observed in electrophysiological experiments (Fig. 1 and 3). These calculations suggest that crystal structures of KcsA with Li+ or Na+ will corroborate their proposed binding locations. In the following section we reveal X-ray crystallographic data that is supportive of these computational results.
Crystal structures of KcsA in Li+ support potential Li+ binding sites
We determined the crystal structure of KcsA from crystals grown in the presence of 150mM Li+ with either 3mM K+ or completely depleted of K+ to 2.75Å and 2.85Å resolution, respectively (LowK-Li+ (PDB ID:3IGA), NoK-Li+ (PDB ID: 3GB7), Table 1, Fig. 5). While Li+, which contains two electrons, cannot be directly observed in an x-ray diffraction experiment at this resolution, potential Li+ binding locations can be inferred by analyzing putative coordinating ligands44,45 both within the cavity and the selectivity filter. Inspection of the NoK-Li+ model (Fig. 5a) identifies three possible binding sites for Li+: one site within the selectivity filter in-plane with the backbone carbonyls of Thr75 (the B-site, Fig. 5a,f), and two mutually exclusive sites in the aqueous cavity at 2Å or 6Å below the base of the selectivity filter (Supplementary Fig. 1).
Table 1.
Data collection and refinement statistics (molecular replacement)
| NoK-Li+ | LowK-Li+ | |
|---|---|---|
| Data collection | ||
| Space group | I4 | I4 |
| Cell dimensions | ||
| a, b, c (Å) | 157.1, 157.1, 75.6 | 155.8, 155.8, 75.8 |
| α, β, γ (°) | 90, 90, 90 | 90, 90, 90 |
| Resolution (Å) | 20–2.85 (2.95–2.85) | 30–2.75 (2.85–2.75) |
| Rsym | 0.040 (0.360) | 0.056 (0.413) |
| I/σI | 25.2 (3.3) | 22.5 (2.3) |
| Completeness (%) | 95.5 (97.9) | 90.6 (89.6) |
| Redundancy | 3.0 (2.9) | 3.5 (2.3) |
| Refinement | ||
| Resolution (Å) | 2.85 | 2.75 |
| No. reflections | 20,652 | 21,554 |
| Rwork/Rfree | 0.240/0.284 | 0.242/0.273 |
| No. atoms | 4111 | 4109 |
| Protein | 4074 | 4074 |
| Ligand/ion | 31 | 31 |
| Water | 5 | 3 |
| B-factors | 78.8 | 79.5 |
| Protein | 78.3 | 79.6 |
| Ligand/ion | 94.6 | 69.2 |
| Water | 44.8 | 47.5 |
| R.m.s. deviations | ||
| Bond lengths (Å) | 0.01 | 0.01 |
| Bond angles (°) | 1.89 | 1.90 |
Values in parentheses are for the highest-resolution shell.
Figure 5. Structure of KcsA in Li+ indicates potential Li+ binding sites in the pore.

a, Composite omit electron density maps contoured to 1.25σ for KcsA in 150 mM Li+ (NoK-Li+, PDBID:3GB7), b, KcsA in 150mM Li+ and 3mM K+ (LowK-Li+, PDBID:3IGA), c, KcsA in low K+ (PDBID:1k4d7), and d, KcsA in Na+ (NoK-Na+, PDBID:2itc8). Waters (red), K+ (purple), Na+ (blue), and Li+ (green) e, Root mean squared (RMS) deviations of pair-wise comparisons of C-α atoms between NoK-Li+ and LowK-Li+ (blue), Low-K+ (red, PDBID:1k4d7) or High-K+ (grey, PDBID:1k4c7). The black bar indicates the selectivity filter. The RMS deviation of the NoK-Li+ structure to the Low-K+ structure excluding residues 75–80 is 0.22Å, and of residues 75–80 alone is 0.56Å. The RMS deviation of the NoK-Li+ structure C-α atoms within the filter decreases to 0.19Å when compared to the conductive form of the filter in High-K+. f, Overlay of the backbone residues of NoK-Li+ (yellow) with Low-K+ (red), high-K+ (grey), and LowK-Li+ (blue). g, The S3 and S4 sites of NoK-Li+ showing coordination (numbers in Å) of Li+ ion and water molecules within the filter. Waters (red) and Li+ (green).
The binding sites for Li+ in the aqueous cavity are consistent with the functional data and the MD calculations (Fig. 1,2, and 4b). We modeled eight water molecules in the cavity of the NoK-Li+ structure. While modeling of water molecules near the crystallographic 4-fold axis has caveats (see Supplementary Discussion), these resemble the hydration shell previously reported in higher-resolution KcsA structures7,9 (Fig. 5). In those structures, the water molecules coordinate a well defined K+ or Na+. In contrast, our NoK-Li+ structure shows no density in the center of the water molecule ring. Since the water molecules in the cavity are too remote to coordinate a Li+ located on the crystallographic 4-fold directly, we speculate that they may serve as a secondary hydration shell for a tetrahedrally-coordinated Li+, which can be modeled to bind in the cavity at two locations (Supplementary Fig. 1b,c). In our model, the degenerate tetrahedron modeled along the four-fold axis of symmetry to mimic the first water shell (modeled grey spheres in Supplementary Fig. 1b,c) would preclude direct observation of the primary hydration shell electron density. It is unclear why the second hydration shell is visible while the first one is not. One possibility is that electrostatic forces from the negative dipoles of the pore helices stabilize the second hydration shell waters. These helix dipoles have been previously suggested to be important for stabilizing ions within the cavity46.
A Li+ ion coordinated within the selectivity filter can be inferred by monitoring the backbone conformation of the NoK-Li+ and LowK-Li+ structures (Fig. 5a,b). Previous structures show that in 3mM K+, the selectivity filter of KcsA adopts a “non-conductive” or “collapsed” conformation7,9 (Fig. 5c). However, the addition of Li+ in either the presence or the absence of 3mM K+ returns the selectivity filter of KcsA to a “conductive” conformation7,9 (Fig. 5). A Li+ binding site located within the selectivity filter at the B-site would support this backbone conformation and is consistent with the MD calculations (Supplementary Table 1, Fig. 4). We hypothesize that the four carbonyl oxygens of Thr75 and the two water molecules at the S3 and S4 positions complete the octahedral coordination of Li+ (Fig. 5a,f). Extensive analysis of the densities in the selectivity filter of the NoK-Li+ and LowK-Li+ structures and comparisons to other KcsA structures is discussed in the Supplementary Discussion and Supplementary Fig. 2. The conductive conformation of the selectivity filter observed in both NoK-Li and LowK-Li structures could be a result of either structural support from increased occupancy of the S3 and B sites or due to the strong fields around a Li+ ion that polarize the Thr75 carbonyls.
While argument for these Li+-binding sites based on this x-ray structure alone relies on indirect evidence of structural changes and hydration waters, it provides considerable support to our MD calculations and electrophysiological data. Further support comes from a previous structure of KcsA determined in the presence of Na+ (Fig. 5d), which also shows density at the B-site in the pore (PDB ID: 2ITC8). The backbone of the Na+-containing structure adopts the “collapsed” conformation, indicating that Na+ cannot support the conductive conformation of the selectivity filter.
The B-site may be rarely occupied under physiological conditions, given that large voltages are needed for Na+ and Li+ to potentially reach it (Fig. 1,3). We used MD to search for the free energy barriers that would exclude Na+ and Li+ from the filter.
Na+ and Li+ encounter a high free energy barrier to bind at the B-site
We employed umbrella-sampling simulations to calculate the free energy cost of moving ions (K+, Na+, and Li+, grey circles Fig. 6a) from the cavity into the S4 region when the selectivity filter is occupied by K+ (red circles Fig. 6a). All calculations were done with K+ present in the selectivity filter in one of the two multi-ion configurations: S1/S3/Cavity and S0/S2/S4 7,9,14,15. With the filter K+ ions in the S1/S3 configuration, a K+ entering the filter from the cavity (Path I) experiences a shallow free-energy well in the cavity, and then, after traversing a ~2kcal/mol barrier, binds in S4 inside the hydroxyl-carbonyl cage of Thr75 (Fig. 6b, red; error analysis in Supplementary Fig. 4). The ability of K+ to bind in the S4 “cage” while two K+ ions reside in S1 and S3 has been previously shown to create a low free energy pathway for knock-on conduction in K+ channels15, leading to a configuration of the filter with K+ ions in S4/S2/S0 (path I′). However, we find that this low free energy intermediate state does not exist if either Na+ or Li+ attempts to cross into S4 from the cavity (green and blue, Fig. 6b). A steep climb in free energy occurs due to Coulomb repulsion resulting from Na+/Li+ attempting to bind to the “in-plane” B site, a site too close to a K+ already residing in S3 (the B-site straddles the S4 and S3 K+ sites, as shown in Fig. 5, and an ion binding at the B-site would be too close to a K+ in S3). As a result, Na+ and Li+ cannot reach the B-site via the low free energy permeation path preferred by K+ (paths I, I′).
Figure 6. Free energy profiles for different multi-ion configurations show large energy barriers for Na+ and Li+ to enter the filter.

a, Scheme of possible multi-ion permeation configurations where two K+ ions are inside the filter (red) and a K+, Na+ or Li+ ion attempts to enter from the cavity (grey). Path I describes the cavity ion (K+, in this case) entering the filter with two K+ ions in S1/S3, followed by the movement of the two K+ ions to S0/S2 depicted in Path I′. Path II describes two K+ ions in the filter moving from S1/S3 to S0/S2, and subsequently allowing the cavity ion to enter the filter, depicted in Path II′ (we note that for paths II and II′ the grey ion can bind either in the cage, as pictured, or in the plane). Path III describes the cavity ion entering the filter in a concerted motion with the K+ ions moving from S1/S3 to S0/S2. b, Free energy profiles along Path I for K+, Na+, and Li+ (red, green, and blue respectively in b–d) where the zero has been set arbitrarily at z=−12 Å in the cavity, independently for each ion (one could alternatively add the small sub-kcal/mol offsets from Supplementary Table 2 to enforce free energies relative to bulk solution). c, Free energy profiles along Paths II (solid lines) and III (dashed lines) where we arbitrarily set the zero at the minimum corresponding to a S1/S3 configuration. d, Free energy profile along Path II′, where the zero was set at z=−12 Å. The z coordinate in b and d is the position of the ion along the pore (see Fig. 1a and 5e). The z12 coordinate in c is the position of the center of mass of the two K+ ions relative to the filter. RMSD errors in these free energy profiles range from 0.4 to 1.6 kcal mol−1 (see Supplementary Methods and Supplementary Fig. 4).
In order for these smaller ions to bind to the B-site, the S3 and S4 sites must be emptied of K+. The K+ channel must be in the S0/S2 configuration, with only the S0 and S2 selectivity filter sites occupied by K+. If a Na+/Li+ in the cavity sees a selectivity filter with K+ in the S1/S3 configuration, it must wait for the K+ ions to move up one register and establish the S0/S2 configuration in order to enter the filter. Transition from the S1/S3 to the S0/S2 configuration (Path II) is associated with a large free energy barrier (4–5 kcal/mol) when an ion resides in the cavity, irrespective of whether it is a K+, Na+, or Li+ (Fig. 6c, solid curves). A similar value was found for K+ by Berneche and Roux15 if K+ is forced to follow this high free-energy path. Even if a concerted ion movement is allowed (path III, dashed curves, Fig. 6c), this barrier remains large for Na+ and Li+ but not for K+, which can take a low free-energy concerted path. The multi-ion permeation path is therefore optimized for K+ conduction. With K+ ions in the S0/S2 configuration, entry of the cavity ion is highly favorable with a remarkable −10 kcal/mol binding free energy for Li+ (path II′, Fig. 6d), indicating a high-affinity binding site. If one focuses on the region between −6 and −4Å, the plots resemble closely those in Fig. 4c, obtained with specialized simulations in the S4 site.
Our calculations predict the existence of a high affinity binding site for Na+ and Li+ in the (in-plane) selectivity filter B-site, also supported by the crystal structures8 (Fig. 5). Under normal physiological conditions, Na+ and Li+ rarely reach this high-affinity binding site due to large free energy barriers (at least 4–5 kcal/mol) associated with a costly alternative multi-ion conduction path.
DISCUSSION
The current view of ion selectivity in potassium channels is based on selective ion binding at the identified K+ binding sites (S-sites) within the selectivity filter. Previous MD simulations calculated that the sites are not equivalent in relative binding free energy and showed that site S2 is the most selective while S4 is the least selective15,19,22. We demonstrated that under physiological conditions (high intracellular K+ and low intracellular Na+), selection against intracellular Na+ occurs at the entryway into the S4 region of the filter, long before the S2 site is encountered. We also demonstrated that this selection occurs even though there is a binding (B) site for Na+ or Li+ between S4 and S3, in the selectivity filter. This B-site is in the plane of the carbonyls, and not “in cage”, like the K+ binding sites. A Na+ or Li+ in the cavity cannot reach the B-site unless K+ ions in S4 and S3 are displaced upward towards the extracellular site. This required outward movement of K+ ions inside the filter occurs infrequently due to a large free energy barrier.
Why is there a barrier only for Na+ and Li+, and not for K+? Movement of K+ into the selectivity filter is almost barrier-less when a K+ enters from the cavity because K+ is able to bind in the S4 cage to create a low free energy intermediate configuration S1/S3/S4, thus promoting the knock-on of ions through the filter15,47. In contrast, Na+ or Li+ cannot bind in the S4 cage and require a path that involves a large barrier of 4–5 kcal/mol (Fig. 6). This barrier is comparable to the relative free energy costs predicted for Na+/K+ selectivity in S2 and is of the correct magnitude to reproduce permeability ratios of K+ to Na+ in KcsA channels19,48. Valyiaveetil and colleagues10 found that a KcsA channel engineered to prevent collapse of the selectivity filter in low K+ allows Na+ permeation in the absence of K+ but not in the presence of K+, suggesting that a K+-occupied filter raises a free-energy barrier to Na+ entry, consistent with our model.
Our results argue that the K+ channel selectivity filter is not averse to Li+ and Na+; both ions can bind in the filter. In the presence of permeant ions, a large multi-ion energetic barrier inhibits entry of Na+ or Li+ into the selectivity filter. What prevents these ions from permeating in the absence of K+? Our favored hypothesis is that both Na+ and Li+ bind with high affinity at the B-site in the absence of K+ ions, disfavoring fast throughput through the filter. Additionally, barriers would be expected as Na+ or Li+ cross each of the S-sites in the filter. An alternative line of thought is that neither Na+ nor Li+ bind in the selectivity filter, and therefore favor the collapsed, “non-conductive”7,9 form of the KcsA selectivity filter, as proposed by Lockless and colleagues8. This is inconsistent with our finding that Li+ supports a selectivity filter configuration more similar to the “conductive” form in the absence of permeant ions (Fig. 5).
In this study, we have only examined the mechanism of selection for K+ over Na+ and Li+ ions from the intracellular side in KcsA channels. The mechanism of selectivity from the external side, where Na+ is the more abundant physiological ion, remains an open question. The architecture of the channel is asymmetric, with non-equivalent ion-binding sites, the narrow selectivity filter is at the extracellular end of the channel, while the moderately non-selective aqueous cavity is at the intracellular side. This asymmetry is reflected in differential effects of Na+/Li+ on the K+ currents; Na+ and Li+ do not block the K+ current with fast kinetics from the extracellular side36. Moreover, crystallography has not identified a potential binding site for Li+ near the external side of the selectivity filter, raising the possibility that selective binding may play a more important role from the external side.
In conclusion, our studies support a mechanism for intracellular selectivity in K+ channels that differs from the current view. We show that intracellular Na+ and Li+ can bind in the selectivity filter of K+ channels. Our finding of a K+-dependent, high free-energy barrier for Na+ and Li+ to enter the filter from the intracellular side argues that the initial rate of entry into the filter discriminates between Na+/Li+ and K+ ions, similar to the proposal by Bezanilla and Armstrong1. This study emphasizes that a complete understanding of selectivity requires an analysis of the true multi-ion nature of permeation in addition to the thermodynamics of binding to specific sites in the channel.
ONLINE METHODS
Materials
All chemicals were high purity reagent grade from Sigma-Aldrich unless noted otherwise. Anagrade n-Decyl-β-D-maltopyranoside (DM) and CHAPS detergents were from Anatrace. POPE (1-palmitoyl-2-oleoyl phosphatidylethanolamine) and POPG (phosphatidylglycerol) were from Avanti Polar Lipids.
Expression, purification, and reconstitution
N-terminal hexahistidine-tagged KcsA in the pASK90 plasmid49 was transformed into E. coli JM-83, grown at 37°C in Terrific Broth with 100 μg L−1 ampicillin. Cells were harvested by centrifugation 90 minutes after protein expression was induced with 200 μg L−1 anhydrotetracycline (ATC, Acros Organics) at OD600 =1.0. Purification was performed as described previously26,36. Briefly, cells were ruptured via sonication in the presence of protease inhibitors (Leupeptin (2μg ml−1), Pepstatin (3μg ml−1), and PMSF (0.17mg ml−1) (Roche)), extracted with 50mM DM for 2 hours, and extract clarified by centrifugation (40,000g). Protein was affinity purified over Ni-NTA resin (Qiagen), eluted with 300mM imidazole, concentrated using 50,000 molecular weight cutoff concentrators (Millipore), and purified over a Superdex-200 (GE) gel filtration column in protein buffer (100mM KCl, 5mM DM, 50mM Tris, pH 7.6). For reconstitution into vesicles, protein was mixed with lipids (3POPE:1POPG) solubilized in 34mM CHAPS and detergent was removed over a Sephadex G-50 column. The liposomes were flash frozen in liquid nitrogen and stored at −80° C.
Single channel recording
A horizontal planar lipid bilayer system, with two aqueous chambers separated by a partition was used to record channel activity, as described previously26,36. Since KcsA is inactive at neutral intracellular pH, we used pH 7.0 (10 mM HEPES) in the cis and pH 4.0 (10 mM Succinic acid) in the trans chamber to only record from channels oriented with their intracellular side facing the trans chamber. KcsA liposomes were pipeted onto lipid bilayers composed of 7.5 mg mL−1 POPE and 2.5 mg mL−1 POPG in n-decane painted over the partition hole. Single channel currents were recorded with Axopatch 200A and 200B amplifiers (Molecular Devices) and sampled at 20 kHz with low-pass filtering at 2 kHz. For display, traces were digitally filtered offline to 200 Hz. As per physiological convention, voltage is referenced to the external solution as the ground.
Single channel analysis
Single-channel current amplitudes were measured manually using Clampfit10.0 (Molecular Devices) and verified using amplitude histograms. The kinetic analysis was done using the Single Channel Search module in Clampfit. Additional low-pass filtering of 0.7–1.5kHz was applied prior to analysis. The open and closed intervals were measured from sections of non-overlapping single-channel data and collected into histograms. Open dwell-time histograms were fitted with a single exponential component with , where τo is the mean of the exponential component (Fig. 3c,d). Burst durations were extracted in Clampfit assuming a critical time of 15ms (Fig. 3e, dotted line). Closed events shorter than the critical time are intraburst closings, while durations longer than the critical time are interburst closings. Qualitatively, the observed blocker concentration and voltage effects on the burst durations (Fig. 3) were not dependent on the critical time choice (data not shown).
Mean burst duration (τburst) plots were fit assuming the channel gates according to Scheme II (Supplementary Discussion), where ki is the inactivation rate constant, kB is the block rate constant (intrinsic blocker on-rate) and [B] is the blocker concentration. The lifetime of the burst states is exponentially distributed with a mean equal to the inverse of the sum of the two rate constants leading away from the state:
| (Eq. 1) |
, where kB (0) is the intrinsic blocker on-rate constant at 0 mV, and zB is the voltage dependence of block. In the absence of the blocker, in control conditions, the model in Scheme II is reduced to C ↔ O ↔ I. Then, and we substituted it in Eq.1, assuming that the inactivating rate in the absence is the same as in the presence of the blocker (ki).
Crystallization, data collection, model building, and refinement
The C-terminal 35 amino acids were cleaved from KcsA with chymotrypsin (Worthington) for 30 minutes at 37°C in elution buffer (100mM KCl, 5mM DM, 20mM Tris, 300mM imidazole, pH 7.6). Purified KcsA was dialyzed against 150mM LiCl (with or without 3mM KCl), 50mM Tris, 5mM DM, pH 7.5 for two days with four buffer changes at room temperature. Extreme care was taken to avoid potassium contamination and the calculated level of potassium from the solutions we used is ~20μM, substantially lower than the K+ concentration used to obtain the collapsed, Low-K+ KcsA structure7. KcsA-FAB complexes were prepared by mixing KcsA and FAB 1:1 w/w for 30 minutes at room temperature7. Complexes were separated from individual components by gel filtration (Superdex 200, GE) in 100 mM LiCl, 5mM DM, and 50mM Tris pH 7.5 (with addition of 3mM KCl for the LowK-Li+). Crystals were grown at 20°C using sitting drop vapor diffusion from 10 mg ml−1 protein equilibrated against 24–26%(w/v)PEG 400, 100mM MES pH 5.5–6.5 (with LiOH) and 50 mM Mg(OAc)2. Crystals were cryoprotected by adding 40% PEG400 to the crystallization mother liquor 24 hours prior to freezing in liquid nitrogen as described8. X-ray diffraction data were collected from crystals under a cryostream at 100K using a MAR 225 CCD detector and a wavelength of 0.979 Å on beamline 21-ID-G at the Advanced Photon Source (Argonne, IL). Data were processed using the HKL suite of programs50 (Table 1). 5% (1047) of the reflections were selected randomly to be excluded from refinement in the NoK-Li+ data set and serve as the Rfree. The Rfree reflections for LowK-Li+ were the same reflections selected from NoK-Li+. The structures of both NoK-Li+ and LowK-Li+ were determined by molecular replacement in CNS51 using the co-crystal structure of KcsA-FAB in a low concentration of K+ as the starting model (PDBID:1K4D7). Iterative rounds of model building and refinement were performed using COOT52 and CNS51, to a final Rwork value of 0.24 and Rfree value of 0.28 (Table 1). Composite maps were calculated with CNS51. Fig. 5, and Supplementary Fig. 1 and 2 were prepared using PyMOL53. For NoK-Li = 90.2% of residues were in most favored region, 9.6% in additionally allowed regions, none in generously allowed regions, and a single residue (0.2%), AlaB54, was in the disallowed region. The same residue was in a disallowed region in the higher resolution KcsA structures7. For LowK-Li = 90.7% in most favored region, 9.1 in additionally allowed regions, none in generously allowed regions, and a single residue (0.2%), AlaB54, was in the disallowed region.
Molecular dynamics simulations
The simulation system (Fig. 4a) consists of KcsA protein (PDBID:1bl854 or 1k4c7) immersed in a dipalmitoylphosphatidylcholine (DPPC) membrane with explicit waters and ions (total atoms ~43,770). CHARMM55 32b2 version, with the PARAM27 force field56,57 was used, with modifications made to ensure correct free energies of solvation in water and N-methylacetamide (NMA) (e.g.58). We used free energy perturbation (FEP)59 to calculate relative free energies of K+, Na+, and Li+ ions at specific sites14–19,58 (with a total of 5–10ns calculation−1). When constraints were used on an ion’s position, unbiasing was carried out to obtain estimates of the free energy perturbation, or for the calculation of free energy profiles across binding sites. Separate potential of mean force-umbrella sampling60 calculations were also used to extract free energy profiles along positional coordinates involving single or multiple ions moving into or within the selectivity filter (each calculation requiring 10–30 ns). Full details of these methods, as well as discussion on force field parameterizations, are provided in the Supplementary Methods and Discussion.
Supplementary Material
Acknowledgments
The authors would like to thank D. Posson, J. McCoy, D. Kim, A. George, and L. DeFelice for insightful discussions and acknowledge support from AHA 0630168ZN and NIH GM077560 to CMN. ANT is funded by an NSF-GRFP grant. TWA and IK would like to thank Sergei Noskov for providing and testing Li+ parameters and acknowledge support from NSF CAREER award MCB-0546768. TDP acknowledges support from NIH 1 T32 NS07491-06 and NIH 5 T32 GM008320-19. TMI acknowledges support from 5-R01-GM079419-03. Use of the Advanced Photon Source at Argonne National Laboratory was supported by the U. S. Department of Energy, Office of Science, Office of Basic Energy Sciences, under Contract No. DE-AC02-06CH11357. Use of the LS-CAT Sector 21 was supported by the Michigan Economic Development Corporation and the Michigan Technology Tri-Corridor for the support of this research program (Grant 085P1000817).
Footnotes
ACCESSION CODES
Protein Data Bank: The X-ray crystallographic coordinates and structure factor data have been deposited in the Protein Data Bank under the accession numbers 3GB7 (NoK-Li+) and 3IGA (LowK-Li+).
AUTHOR CONTRIBUTIONS
A.N.T., I.K., T.D.P., T.M.I., T.W.A., C.M.N. performed research, analyzed data and wrote the paper.
Supplementary information is attached to this article online.
References
- 1.Bezanilla F, Armstrong CM. Negative conductance caused by entry of sodium and cesium ions into the potassium channels of squid axons. J Gen Physiol. 1972;60:588–608. doi: 10.1085/jgp.60.5.588. [DOI] [PMC free article] [PubMed] [Google Scholar]
- 2.Hille B, Schwarz W. Potassium channels as multi-ion single-file pores. J Gen Physiol. 1978;72:409–42. doi: 10.1085/jgp.72.4.409. [DOI] [PMC free article] [PubMed] [Google Scholar]
- 3.Hille B. Potassium channels in myelinated nerve. Selective permeability to small cations. J Gen Physiol. 1973;61:669–86. doi: 10.1085/jgp.61.6.669. [DOI] [PMC free article] [PubMed] [Google Scholar]
- 4.Neyton J, Miller C. Discrete Ba2+ block as a probe of ion occupancy and pore structure in the high-conductance Ca2+-activated K+ channel. J Gen Physiol. 1988;92:569–86. doi: 10.1085/jgp.92.5.569. [DOI] [PMC free article] [PubMed] [Google Scholar]
- 5.Neyton J, Miller C. Potassium blocks barium permeation through a calcium-activated potassium channel. J Gen Physiol. 1988;92:549–67. doi: 10.1085/jgp.92.5.549. [DOI] [PMC free article] [PubMed] [Google Scholar]
- 6.Zhou Y, MacKinnon R. The occupancy of ions in the K+ selectivity filter: charge balance and coupling of ion binding to a protein conformational change underlie high conduction rates. J Mol Biol. 2003;333:965–75. doi: 10.1016/j.jmb.2003.09.022. [DOI] [PubMed] [Google Scholar]
- 7.Zhou YF, Morais-Cabral JH, Kaufman A, MacKinnon R. Chemistry of ion coordination and hydration revealed by a K+ channel-Fab complex at 2.0 angstrom resolution. Nature. 2001;414:43–48. doi: 10.1038/35102009. [DOI] [PubMed] [Google Scholar]
- 8.Lockless SW, Zhou M, MacKinnon R. Structural and thermodynamic properties of selective ion binding in a K+ channel. PLoS Biol. 2007;5:e121. doi: 10.1371/journal.pbio.0050121. [DOI] [PMC free article] [PubMed] [Google Scholar]
- 9.Morais-Cabral JH, Zhou Y, MacKinnon R. Energetic optimization of ion conduction rate by the K+ selectivity filter. Nature. 2001;414:37–42. doi: 10.1038/35102000. [DOI] [PubMed] [Google Scholar]
- 10.Valiyaveetil FI, Leonetti M, Muir TW, Mackinnon R. Ion selectivity in a semisynthetic K+ channel locked in the conductive conformation. Science. 2006;314:1004–7. doi: 10.1126/science.1133415. [DOI] [PubMed] [Google Scholar]
- 11.Doyle DA, et al. The structure of the potassium channel: molecular basis of K+ conduction and selectivity. Science. 1998;280:69–77. doi: 10.1126/science.280.5360.69. [DOI] [PubMed] [Google Scholar]
- 12.Heginbotham L, Abramson T, MacKinnon R. A functional connection between the pores of distantly related ion channels as revealed by mutant K+ channels. Science. 1992;258:1152–5. doi: 10.1126/science.1279807. [DOI] [PubMed] [Google Scholar]
- 13.Heginbotham L, Lu Z, Abramson T, MacKinnon R. Mutations in the K+ channel signature sequence. Biophys J. 1994;66:1061–7. doi: 10.1016/S0006-3495(94)80887-2. [DOI] [PMC free article] [PubMed] [Google Scholar]
- 14.Aqvist J, Luzhkov V. Ion permeation mechanism of the potassium channel. Nature. 2000;404:881–4. doi: 10.1038/35009114. [DOI] [PubMed] [Google Scholar]
- 15.Berneche S, Roux B. Energetics of ion conduction through the K+ channel. Nature. 2001;414:73–7. doi: 10.1038/35102067. [DOI] [PubMed] [Google Scholar]
- 16.Bostick DL, Brooks CL., 3rd Selectivity in K+ channels is due to topological control of the permeant ion’s coordinated state. Proc Natl Acad Sci U S A. 2007;104:9260–5. doi: 10.1073/pnas.0700554104. [DOI] [PMC free article] [PubMed] [Google Scholar]
- 17.Burykin A, Kato M, Warshel A. Exploring the origin of the ion selectivity of the KcsA potassium channel. Proteins. 2003;52:412–26. doi: 10.1002/prot.10455. [DOI] [PubMed] [Google Scholar]
- 18.Fowler PW, Tai K, Sansom MS. The selectivity of K+ ion channels: testing the hypotheses. Biophys J. 2008;95:5062–72. doi: 10.1529/biophysj.108.132035. [DOI] [PMC free article] [PubMed] [Google Scholar]
- 19.Noskov SY, Berneche S, Roux B. Control of ion selectivity in potassium channels by electrostatic and dynamic properties of carbonyl ligands. Nature. 2004;431:830–4. doi: 10.1038/nature02943. [DOI] [PubMed] [Google Scholar]
- 20.Varma S, Rempe SB. Tuning ion coordination architectures to enable selective partitioning. Biophys J. 2007;93:1093–9. doi: 10.1529/biophysj.107.107482. [DOI] [PMC free article] [PubMed] [Google Scholar]
- 21.Allen TW, Andersen OS, Roux B. On the importance of atomic fluctuations, protein flexibility, and solvent in ion permeation. J Gen Physiol. 2004;124:679–90. doi: 10.1085/jgp.200409111. [DOI] [PMC free article] [PubMed] [Google Scholar]
- 22.Noskov SY, Roux B. Ion selectivity in potassium channels. Biophys Chem. 2006;124:279–91. doi: 10.1016/j.bpc.2006.05.033. [DOI] [PubMed] [Google Scholar]
- 23.Varma S, Rempe SB. Coordination numbers of alkali metal ions in aqueous solutions. Biophys Chem. 2006;124:192–9. doi: 10.1016/j.bpc.2006.07.002. [DOI] [PubMed] [Google Scholar]
- 24.Bichet D, Grabe M, Jan YN, Jan LY. Electrostatic interactions in the channel cavity as an important determinant of potassium channel selectivity. Proc Natl Acad Sci U S A. 2006;103:14355–60. doi: 10.1073/pnas.0606660103. [DOI] [PMC free article] [PubMed] [Google Scholar]
- 25.Grabe M, Bichet D, Qian X, Jan YN, Jan LY. K+ channel selectivity depends on kinetic as well as thermodynamic factors. Proc Natl Acad Sci U S A. 2006;103:14361–6. doi: 10.1073/pnas.0606662103. [DOI] [PMC free article] [PubMed] [Google Scholar]
- 26.Nimigean CM, Miller C. Na+ block and permeation in a K+ channel of known structure. J Gen Physiol. 2002;120:323–35. doi: 10.1085/jgp.20028614. [DOI] [PMC free article] [PubMed] [Google Scholar]
- 27.Zhou Y, MacKinnon R. Ion binding affinity in the cavity of the KcsA potassium channel. Biochemistry. 2004;43:4978–82. doi: 10.1021/bi049876z. [DOI] [PubMed] [Google Scholar]
- 28.Hille B. Ion Channels of Excitable Membranes. Sinauer Associates, Inc; 2001. [Google Scholar]
- 29.Woodhull AM. Ionic blockage of sodium channels in nerve. J Gen Physiol. 1973;61:687–708. doi: 10.1085/jgp.61.6.687. [DOI] [PMC free article] [PubMed] [Google Scholar]
- 30.Lamoureux G, Roux B. Absolute hydration free energy scale for alkali and halide ions established from simulations with a polarizable force field. J Phys Chem B. 2006;110:3308–22. doi: 10.1021/jp056043p. [DOI] [PubMed] [Google Scholar]
- 31.Spassova M, Lu Z. Coupled ion movement underlies rectification in an inward-rectifier K+ channel. J Gen Physiol. 1998;112:211–21. doi: 10.1085/jgp.112.2.211. [DOI] [PMC free article] [PubMed] [Google Scholar]
- 32.Roux B, Berneche S, Im W. Ion channels, permeation, and electrostatics: insight into the function of KcsA. Biochemistry. 2000;39:13295–306. doi: 10.1021/bi001567v. [DOI] [PubMed] [Google Scholar]
- 33.Cordero-Morales JF, et al. Molecular determinants of gating at the potassium-channel selectivity filter. Nat Struct Mol Biol. 2006;13:311–8. doi: 10.1038/nsmb1069. [DOI] [PubMed] [Google Scholar]
- 34.Chakrapani S, Cordero-Morales JF, Perozo E. A quantitative description of KcsA gating II: single-channel currents. J Gen Physiol. 2007;130:479–96. doi: 10.1085/jgp.200709844. [DOI] [PMC free article] [PubMed] [Google Scholar]
- 35.Chakrapani S, Cordero-Morales JF, Perozo E. A quantitative description of KcsA gating I: macroscopic currents. J Gen Physiol. 2007;130:465–78. doi: 10.1085/jgp.200709843. [DOI] [PMC free article] [PubMed] [Google Scholar]
- 36.Heginbotham L, LeMasurier M, Kolmakova-Partensky L, Miller C. Single streptomyces lividans K(+) channels: functional asymmetries and sidedness of proton activation. J Gen Physiol. 1999;114:551–60. doi: 10.1085/jgp.114.4.551. [DOI] [PMC free article] [PubMed] [Google Scholar]
- 37.Guidoni L, Torre V, Carloni P. Potassium and sodium binding to the outer mouth of the K+ channel. Biochemistry. 1999;38:8599–604. doi: 10.1021/bi990540c. [DOI] [PubMed] [Google Scholar]
- 38.Allen TW, Kuyucak S, Chung SH. Molecular dynamics study of the KcsA potassium channel. Biophys J. 1999;77:2502–16. doi: 10.1016/S0006-3495(99)77086-4. [DOI] [PMC free article] [PubMed] [Google Scholar]
- 39.Allen TW, Blizniuk A, Rendell A, Kuyucak S, Chung SH. The Potassium Channel: Structure, Selectivity and Diffusion. J Chem Phys. 2000;112 [Google Scholar]
- 40.Shrivastava IH, Tieleman DP, Biggin PC, Sansom MS. K(+) versus Na(+) ions in a K channel selectivity filter: a simulation study. Biophys J. 2002;83:633–45. doi: 10.1016/s0006-3495(02)75197-7. [DOI] [PMC free article] [PubMed] [Google Scholar]
- 41.Thomas M, Jayatilaka D, Corry B. The predominant role of coordination number in potassium channel selectivity. Biophys J. 2007;93:2635–43. doi: 10.1529/biophysj.107.108167. [DOI] [PMC free article] [PubMed] [Google Scholar]
- 42.Alam A, Jiang Y. Structural analysis of ion selectivity in the NaK channel. Nat Struct Mol Biol. 2009;16:35–41. doi: 10.1038/nsmb.1537. [DOI] [PMC free article] [PubMed] [Google Scholar]
- 43.Noskov SY, Roux B. Importance of hydration and dynamics on the selectivity of the KcsA and NaK channels. J Gen Physiol. 2007;129:135–43. doi: 10.1085/jgp.200609633. [DOI] [PMC free article] [PubMed] [Google Scholar]
- 44.Murata T, et al. Ion binding and selectivity of the rotor ring of the Na+-transporting V-ATPase. Proc Natl Acad Sci U S A. 2008;105:8607–12. doi: 10.1073/pnas.0800992105. [DOI] [PMC free article] [PubMed] [Google Scholar]
- 45.Plested AJ, Vijayan R, Biggin PC, Mayer ML. Molecular basis of kainate receptor modulation by sodium. Neuron. 2008;58:720–35. doi: 10.1016/j.neuron.2008.04.001. [DOI] [PMC free article] [PubMed] [Google Scholar]
- 46.Roux B, MacKinnon R. The cavity and pore helices in the KcsA K+ channel: electrostatic stabilization of monovalent cations. Science. 1999;285:100–2. doi: 10.1126/science.285.5424.100. [DOI] [PubMed] [Google Scholar]
- 47.Hodgkin AL, Keynes RD. The potassium permeability of a giant nerve fibre. J Physiol. 1955;128:61–88. doi: 10.1113/jphysiol.1955.sp005291. [DOI] [PMC free article] [PubMed] [Google Scholar]
- 48.LeMasurier M, Heginbotham L, Miller C. KcsA: it’s a potassium channel. J Gen Physiol. 2001;118:303–14. doi: 10.1085/jgp.118.3.303. [DOI] [PMC free article] [PubMed] [Google Scholar]
- 49.Skerra A. Use of the tetracycline promoter for the tightly regulated production of a murine antibody fragment in Escherichia coli. Gene. 1994;151:131–5. doi: 10.1016/0378-1119(94)90643-2. [DOI] [PubMed] [Google Scholar]
- 50.Otwinowski Z, Minor W. Processing of X-ray Diffraction Data Collected in Oscillation Mode. Methods in Enzymology. 1997;276:307–326. doi: 10.1016/S0076-6879(97)76066-X. [DOI] [PubMed] [Google Scholar]
- 51.Brunger AT. Version 1.2 of the Crystallography and NMR system. Nature Protocols. 2007;2:2728–2733. doi: 10.1038/nprot.2007.406. [DOI] [PubMed] [Google Scholar]
- 52.Emsley P, Cowtan K. Coot: model-building tools for molecular graphics. Acta Crystallogr D Biol Crystallogr. 2004;60:2126–32. doi: 10.1107/S0907444904019158. [DOI] [PubMed] [Google Scholar]
- 53.Delano WL. The PyMOL Molecular Graphics System. DeLano Scientific; Palo Alto, CA, USA: 2002. [Google Scholar]
- 54.Doyle DA, et al. The Structure of the Potassium Channel: Molecular Basis of K+ Conduction and Selectivity. Science. 1998;280:69–77. doi: 10.1126/science.280.5360.69. [DOI] [PubMed] [Google Scholar]
- 55.Brooks BR, et al. CHARMM: A program for macromolecular energy minimization and dynamics calculations. Journal of Computational Chemistry. 1983;4:187–217. [Google Scholar]
- 56.MacKerell AD, Jr, et al. All-atom empirical potential for molecular modeling and dynamics studies of proteins. Journal of Physical Chemistry B. 1998:3586–3616. doi: 10.1021/jp973084f. [DOI] [PubMed] [Google Scholar]
- 57.Feller SE, MacKerell AD., Jr An improved empirical potential energy function for molecular simulations of phospholipids. J Phys Chem B. 2000;104:7510–7515. [Google Scholar]
- 58.Noskov SY, Roux B. Control of ion selectivity in LeuT: two Na+ binding sites with two different mechanisms. J Mol Biol. 2008;377:804–18. doi: 10.1016/j.jmb.2008.01.015. [DOI] [PMC free article] [PubMed] [Google Scholar]
- 59.Zwanzig RW. High temperature equation of state by a perturbation method: I. Nonpolar gases. Chem Phys. 1954;22:1420–1426. [Google Scholar]
- 60.Torrie GM, Valleau JP. Nonphysical sampling distributions in Monte Carlo free-energy estimation: Umbrella sampling. J Comput Phys. 1977:187–199. [Google Scholar]
Associated Data
This section collects any data citations, data availability statements, or supplementary materials included in this article.