

Abstract
The postgenomic era has revolutionized approaches to defining host-pathogen interactions and the investigation of the influence of genetic variation in either protagonist upon infection outcome. We analyzed pathology induced by infection with two genetically distinct Trypanosoma brucei strains and found that pathogenesis is partly strain specific, involving distinct host mechanisms. Infections of BALB/c mice with one strain (927) resulted in more severe anemia and greater erythropoietin production compared to infections with the second strain (247), which, contrastingly, produced greater splenomegaly and reticulocytosis. Plasma interleukin-10 (IL-10) and gamma interferon levels were significantly higher in strain 927-infected mice, whereas IL-12 was higher in strain 247-infected mice. To define mechanisms underlying these differences, expression microarray analysis of host genes in the spleen at day 10 postinfection was undertaken. Rank product analysis (RPA) showed that 40% of the significantly differentially expressed genes were specific to infection with one or the other trypanosome strain. RPA and pathway analysis identified LXR/RXR signaling, IL-10 signaling, and alternative macrophage activation as the most significantly differentially activated host processes. These data suggest that innate immune response modulation is a key determinant in trypanosome infections, the pattern of which can vary, dependent upon the trypanosome strain. This strongly suggests that a parasite genetic component is responsible for causing disease in the host. Our understanding of trypanosome infections is largely based on studies involving single parasite strains, and our results suggest that an integrated host-parasite approach is required for future studies on trypanosome pathogenesis. Furthermore, it is necessary to incorporate parasite variation into both experimental systems and models of pathogenesis.
The African trypanosomes Trypanosoma congolense, T. vivax, and T. brucei infect a broad range of mammals across a wide swathe of sub-Saharan Africa and result in significant losses to domestic livestock. Sixty million cattle are at risk (as well as significant numbers of small ruminants and equines), and the financial burden to agriculture is estimated at $1,300 million/annum (73). In addition, T. brucei subspecies also cause approximately 20,000 cases of human African trypanosomiasis per year (85), although this number is undoubtedly a substantial underestimate (14). Given that the production of vaccines is a very unlikely prospect, coupled with a significant and rising incidence of resistance to trypanocidal drugs, new routes to identifying intervention strategies are urgently needed. In this context, understanding the mechanisms by which the disease is caused may provide a possible route for therapeutic intervention and/or disease control (1).
One approach, in cattle, has been to identify genetic loci associated with the control of disease in “trypanotolerant” host animals, which remain infected but do not display the severe pathology normally associated with trypanosome infection. This approach is intended to enable more-informed breeding strategies to increase the trypanotolerance of the cattle population as a whole while increasing productivity and lessening the disease burden. Trypanotolerance is fundamentally a reduction in the pathogenic consequences of infection, and understanding pathogenesis is therefore important for developing methods of disease control. This phenotype, with respect to T. congolense, has been examined in cattle (50, 51) and laboratory mice (48, 49), and genetic loci involved in host control of trypanosome infections have been identified in both host systems (20, 32). Host genetic variation is also implicated in differences in the severity of human African trypanosomiasis (11, 39). In contrast, the potential impact of parasite genetic variation upon disease severity and progression has received less attention. The classically described differences in humans infected with different subspecies of T. brucei are well recognized, with T. brucei rhodesiense causing acute disease and T. brucei gambiense causing a more chronic infection (2). However, there is also a range of clinical outcomes within these two subspecies: for example, the “mild” and “severe” T. b. rhodesiense disease observed in geographically different foci (63). Different parasite genotypes have been identified (23) and suggested to be associated with human African trypanosomiasis foci differing in severity between distinct geographical regions, such as Malawi and Uganda (38) but also within a relatively restricted geographical area of Uganda (39). Although this provides strong circumstantial evidence for a spectrum of pathogenesis influenced by parasite variation, this divergence of clinical signs could potentially be due to the host or other, as-yet-undetermined, factors (39).
Anemia was long ago identified as one of the key clinical signs of trypanosomiasis and is associated with infection in all species of African trypanosomes across many host backgrounds (28). In cattle infected with T. congolense, control of anemia is associated with control of parasitemia and is one of the definitions of trypanotolerance (52, 54). In mice, the criteria for trypanotolerance are subtly different, and susceptible strains of mice, such as A/J, develop high parasitemias with T. congolense infections and have early mortality compared to tolerant C57BL/6 mice, which have longer survival times and lower parasitemia but, in contrast to trypanotolerant cattle, develop more-severe anemia (55). The distinction in pathology is similar between tolerant C57BL/6 and susceptible BALB/c mice infected with T. b. brucei (43). Although the definitions of trypanotolerance lead to semantic contrasts between murine and bovine models, the actual process of induction of anemia is considered similar across host species (28). However, the mechanisms by which trypanosome infections instigate anemia are unclear. The causative processes of trypanosome-induced anemia have been variously attributed to a direct hemolytic factor released by trypanosomes (26), variant surface glycoprotein (VSG) transfer to the red blood cell and subsequent immune-mediated hemolysis (69), and upregulated erythrophagocytosis by the mononuclear phagocytic system (79, 84). However, the correlation of anemia severity with the host genetic background in mice and the independence of severity of clinical signs from the parasite load (43) have led to the suggestion that anemia associated with inflammation is the most important mechanism, certainly in T. brucei. Indeed, inflammatory cytokines have been heavily implicated in the induction of anemia in trypanosome infections of mice, with gamma interferon (IFN-γ), interleukin-10 (IL-10) (21, 57), and tumor necrosis factor alpha (TNF-α) (41, 42) being identified as key players. However, this situation is further complicated by the finding that the mechanisms underlying anemia may well be different between trypanosome species, with evidence for TNF-α being involved in anemia induced by T. b. rhodesiense infection but not in anemia induced by T. congolense infection (53). The latter study highlights the difficulty in directly comparing studies that have used different host backgrounds and, equally pertinently, different parasite species, subspecies, or strains.
The postgenomic era has resulted in a range of technological and information resources that allow broad questions to be asked. Microarray technology is one such approach that can produce detailed information on gene expression and has been used to dissect pathological processes in parasitic infections (29, 36, 72). In the context of genetic variation and parasite infections, several studies have concentrated on differences between hosts that are susceptible or tolerant to a particular parasite. In T. congolense infections, cytokine mRNA expression differences have been analyzed between peripheral blood mononuclear cells from N′Dama (trypanotolerant) and Boran (trypanosusceptible) cattle (61). Also, global expression level differences have been compared between livers from T. congolense infected A/J (trypanosusceptible) and C57BL/6 (trypanotolerant) mice (34). These studies highlighted differences between host strains (pro- versus counterinflammatory cytokines being implicated in infection control in cattle and chemokines, complement components, and interferon receptors in mice). This work has recently been expanded, with trypanotolerant cattle shown to have a more rapid and pronounced response to infection in general, in terms of the number of regulated genes and the level of differential expression, than their trypanosusceptible counterparts (60). Thus, our understanding of the host determinants of trypanosome susceptibility is expanding rapidly, but currently the role of parasite variation in disease pathogenesis is limited.
To address this gap, this study compared the differences in pathology induced by two genetically distinct lines of T. b. brucei, TREU927 and STIB247, in BALB/c mice. We developed a fluorescence-activated cell sorter (FACS)-based method to determine changes in hematological parameters during trypanosome infections. Gross organomegaly of the spleen and liver and the levels of several cytokines previously implicated in trypanosome infections were measured. We also undertook a microarray study to compare differences in host gene expression in mice infected with the two strains of parasite.
MATERIALS AND METHODS
Parasite strains and mouse infections.
Infections were carried out using cloned lines of two pleomorphic strains of T. brucei after recent tsetse fly transmission, genome reference strain TREU927, originally isolated from a tsetse fly in 1969 (17), and STIB247, isolated from a hartebeeste in 1971 (15) (the two are hereafter referred to as strains 927 and 247). All of the parasites used readily infect rodents and are tsetse fly transmissible. Passage of strains in our laboratory is kept to a maximum of six times in mice from tsetse fly transmission, in order to maintain tsetse fly transmissibility and minimize artificial selection by growth in rodents. Parasites were grown from stabilates in a donor ICR mouse (Harlan, United Kingdom). Parasites in the logarithmic growth phase were harvested from the donor mouse by terminal exsanguination. The trypanosomes were counted in triplicate in an improved Neubauer hemocytometer and diluted in Carter's balanced salt solution (CBSS) to 1 × 10⁴ trypanosomes per 0.2-ml inoculum. Parasites were then inoculated via the intraperitoneal route into the experimental BALB/c mice (Harlan, United Kingdom). Six mice were infected per strain, and an equivalent number of uninfected mice were included as controls. At days 3, 6, 10, and 12 postinfection (p.i.), mice were euthanized and blood was collected by cardiac puncture for FACS analysis and plasma isolation, as well as dissection and weighing of the spleen and liver. The spleens were snap-frozen in liquid nitrogen and stored at −80°C. The maintenance and care of experimental animals complied with the appropriate legislation, the United Kingdom Animals (Scientific Procedures) Act of 1986, and with the national and University of Glasgow maintenance and care guidelines.
FACS analysis of hematological parameters.
For the FACS analysis, 5 μl blood was taken into 2 μl of 100 U/ml heparin in CBSS. One hundred ninety-eight microliters of 1% paraformaldehyde in phosphate-buffered saline (PBS), pH 7.4, was added to the blood, mixed thoroughly, and fixed for 30 min at room temperature (RT). Then, 745 μl thiazole orange (100 ng/ml in PBS, pH 7.4), used to stain reticulocytes (83), was added to the blood-fixative mixture and allowed to stain for 1 h in the dark at RT. Fluorescent beads (Countbright absolute counting beads for flow cytometry; Invitrogen, United Kingdom) were diluted to 1,000 beads/μl and sonicated to ensure even mixing. Fifty microliters of the bead mixture was then added to the blood-thiazole orange preparation (total volume, 1 ml; 50,000 beads/ml).
FACS analysis was carried out with a Becton Dickinson FACScalibur by using the 488-nm detector for thiazole orange. Data were analyzed using CellQuest version 3.3. In pilot experiments, parameters for each of the main cell populations were determined separately, i.e., a known number of fluorescent beads, bloodstream trypanosomes purified from blood by DE52 (Whatman, United Kingdom) ion-exchange column (35), and murine red and white blood cells separated from whole blood by the use of Histopaque (Sigma, United Kingdom). FACS counts were then compared with manual counts of each cell population by hemocytometer. Reticulocytes were stained with methylene blue, counted by hemocytometer, and expressed as a percentage of the total red blood cell numbers. Using these preliminary data, the cell populations from infected blood samples were counted by gating (Fig. 1) and the number of cells per milliliter was extrapolated from the number of beads. All samples for FACS analysis were counted five times, with 10,000 events per run.
FIG. 1.

Measurement of cell populations by FACS. (Panel i) Forward scatter versus side scatter. Gated cell populations are shown. A, trypanosomes; B, calibration beads; C, red blood cells; D, white blood cells. (Panel ii) Forward scatter versus FL1 channel. X, reticulocytes stained by thiazole orange; Y, mature red blood cells.
Assays for cytokines, EPO, and NO.
Plasma samples were collected from the experimental mice and frozen at −80°C immediately upon collection. Individual plasma samples were tested separately for the levels of erythropoietin (EPO), TNF-α, IFN-γ, IL-12, IL-10, and nitric oxide (NO), according to the manufacturer's instructions [all measured using Endogen Colorimetric enzyme-linked immunosorbent assay (ELISA) kits, except for EPO (Quantikine mouse EPO immunoassay; R&D Systems) and NO (Griess reagent system; Promega)]. TNF-α was also assayed using an independent test according to the manufacturer's instructions (Murine TNF-α enzyme immunoassay kit; Promokine).
RNA isolation.
Spleens were used as the source of RNA at day 10 p.i., a time point that demonstrated significant differences in a range of phenotypes—splenomegaly, hematology parameters, and cytokine levels. Total spleen RNA was isolated from three spleens per group of mice (strain 927 infected, strain 247 infected, and uninfected) using the RNeasy RNA kit (Qiagen), after lysing the spleen tissue in RLT buffer (Qiagen) using ceramic beads (lysing matrix D; Qbiogene) in a RiboLyser centrifuge (Hybaid). RNA quality was checked using an Agilent 2100 bioanalyzer (Agilent Technologies), and RNA was quantified using a Nanodrop ND-1000 spectrophotometer (Thermo Fisher Scientific). RNA was routinely stored at −80°C. Only RNA with an RNA integrity number (71) of greater than 9.0 was used for the microarray hybridization.
Microarray hybridization.
RNA from each mouse spleen was used to create first-strand cDNA. cDNA synthesis and microarray hybridization were carried out at the Sir Henry Wellcome Functional Genomics Facility, University of Glasgow. Hybridization was performed using the GeneChip Mouse Genome 430A 2.0 Array (Affymetrix).
Real-time PCR.
Real-time PCR was carried out on selected genes using the same RNA as was utilized in the microarray hybridization. Approximately 1 μg of total RNA was treated with TURBO DNase (Ambion) according to the manufacturer's protocol. Reverse transcription was carried out using an Omniscript reverse transcription kit (Qiagen) with 5 μM oligo(dT) primers. Real-time PCRs were carried out in triplicate per individual sample on a 7500 Real-Time PCR system (Applied Biosystems), using approximately 100 ng cDNA, 1× Power SYBR Green Master Mix (Applied Biosystems), and the respective oligonucleotide primers at 4 μM in a final reaction volume of 25 μl. Oligonucleotide primers were designed using Primer Express 3.0 software (Applied Biosystems). Primers directed against glyceraldehyde 3-phosphate dehydrogenase were used as the endogenous control (the endogenous control and target gene primer sequences are shown in Table 1) in order to standardize the expression levels of target genes. The comparative quantification (ΔΔCT) was used as a measure of mRNA differences between each preparation.
TABLE 1.
Sequences of primers used in quantitative real-time PCR analyses
| Primer | Sequence (5′-3′) |
|---|---|
| GAPDHf | GACCCCTTCATTGACCTCAACT |
| GAPDHr | TCTCGCTCCTGGAAGATG |
| Ym1f | TTGCGTGACTATGAAGCATTGA |
| Ym1r | AGGAGTAGAGACCATGGCACTGA |
| Arg2f | ACCTCTCACCACTGTATCTG |
| Arg2r | CTCAGGCCAATGTACACAATAT |
Data analysis.
Phenotypes were analyzed by two-way analysis of variance (ANOVA) with the trypanosome strain (strain 927 infected, strain 247 infected, or uninfected) and day of infection as explanatory variables. Where significant differences among strains were detected, Tukey's post hoc analysis determined which groups were significantly different from each other. For IFN-γ, the data were not amenable to parametric statistics, and in these cases, Kruskal-Wallis analyses of day 10 data were undertaken with correction for tied values where appropriate. The above-described analyses were all undertaken using MINITAB v13 software. A post hoc test of the Kruskal-Wallis analysis was done as described previously (74). Raw microarray data were analyzed at the Sir Henry Wellcome Functional Genomics Facility, University of Glasgow, by using robust multichip average normalization (27), followed by calculation of the change in expression of each gene between arrays using the rank product method (7). Data are presented using a false-discovery rate (FDR) of ≤1. The microarray study design used, raw data, and normalized expression values are available on the Gene Expression Omnibus website (http://www.ncbi.nlm.nih.gov/geo/), series record number GSE17049. Visualization and clustering analysis of normalized microarray data were carried out using the Multi Experiment Viewer, version 3.1, included in the TM4 software package from The Institute of Genomic Research (http://www.tigr.org/). The context of gene up- or downregulation was examined by using the Ingenuity Pathways Analysis (IPA) web-based software (Ingenuity Systems, www.ingenuity.com). The functional analysis identified the biological functions that were most significant in the data set. Genes from the data set with an FDR of <5 that were associated with biological functions and/or diseases in the Ingenuity Pathways Knowledge Base were considered for the analysis. Fischer's exact test was used to calculate a P value determining the probability that each biological function assigned to that data set is due to chance alone. Canonical Pathways analysis identified the pathways from the IPA library of canonical pathways that were most significant in the data set. The significance of the association between the data set and the canonical pathway was measured in two ways: (i) by determining the ratio of the number of genes from the data set that map to the pathway divided by the total number of genes in the canonical pathway and (ii) by using Fischer's exact test to calculate a P value determining the probability that the association between the genes in the data set and the canonical pathway is explained by chance alone.
RESULTS
Longitudinal infections.
To analyze the pathogenesis caused by infection, groups of inbred BALB/c mice were infected with strain 927 or 247 and examined at four time points postinfection. A range of parameters were measured, and the data are summarized in Fig. 2 (for a statistical analysis of these data, see Table S1 in the supplemental material). Mice infected with strain 927 displayed a greater reduction in red blood cell numbers compared to the controls, exhibiting a steady decline as the infection progressed from day 3 to day 12 p.i. (Fig. 2). The red blood cell numbers of strain 247-infected mice were only slightly lower than those of uninfected mice and showed little evidence of a decline with time. In contrast, reticulocytosis was much more evident in the strain 247 infections and peaked at day 10 p.i., whereas the reticulocyte counts were much lower in the strain 927 infections (Fig. 2). As an adjunct to these hematological parameters, EPO levels in plasma were measured and were raised in both strains at day 6 p.i. Thereafter, there was a large increase in EPO levels at day 10 p.i. in mice infected with strain 927, which reduced to strain 247 levels by day 12 (Fig. 2). The changes in red blood cell numbers, reticulocytes, and EPO were clearly significantly different between infected and uninfected mice and, crucially, between the mice infected with strain 927 and those infected with strain 247.
FIG. 2.

Phenotypic parameters of strain 927-infected (black bars), strain 247-infected (gray bars), and uninfected (white bars) mice at days 3, 6, 10, and 12 p.i. (mean value ± 1 standard error, n = 6). For statistical analysis of phenotypes, see Table S1 in the supplemental material.
There was massive splenomegaly evident in mice infected with each strain that increased as the infection progressed when measured against uninfected controls, with an increase in strain 247-infected mice of 1,057% on day 12 p.i., compared to 747% for strain 927-infected mice. Differences in hepatomegaly were less clear-cut during the early stages of infection, with infections with both strains inducing an increase of more than 70% over uninfected controls by day 10 p.i. The degree of hepatomegaly in the strain 247 infections then reduced slightly on day 12 p.i., whereas strain 927 induced a further increase (Fig. 2). The splenomegaly trait showed clear significant differences among all three groups. In contrast, hepatomegaly only was clearly statistically significantly different between the uninfected and infected groups but not between the infected groups.
When plasma cytokine levels in the mice were compared, the levels of IL-10 showed clear significant differences among all three groups, with levels in strain 927-infected mice significantly greater than those in strain 247-infected mice. The levels of IFN-γ were greater in infected mice compared with uninfected controls but were statistically significantly different only between strain 927-infected mice and controls. The distinct differences between the results for strain 927- and 247-infected mice apparent in Fig. 2 are not statistically significant, in large part because of the reduced power of the Kruskal-Wallis test versus two-way ANOVA. The levels of IL-12 were consistently increased in infected versus uninfected mice at all time points for both parasite strains, with concentrations in strain 247-infected mice being greater than those in strain 927-infected mice. TNF-α concentrations were very low, being almost undetectable in all of the mice, despite being assayed using different dilutions of plasma and two assay systems (data not shown). Plasma NO levels similarly showed no differences between infected mice and uninfected controls (data not shown). In summary, there is clear evidence that different strains of T. brucei induce very different patterns of pathogenesis and specific differences in cytokine levels.
Microarray analysis of infected versus uninfected mice.
As the spleen is the major site of the hematopoietic and reticuloendothelial responses, as well as showing a highly significant strain-specific response to infection, we investigated the changes in gene expression in this tissue in order to gain insight into the pathways that could be responsible for the differential response. The day 10 time point was chosen for this analysis, as most of the measured parameters (Fig. 2) showed the maximal strain-specific difference. This approach also offered the opportunity to define the common or non-strain-specific responses. The expression of genes in the spleen was examined by microarray analysis in three ways: comparison of uninfected mice and mice infected with T. brucei 927, uninfected versus strain 247-infected mice, and finally differences between strain 247- and strain 927-infected mice (all using an FDR cutoff <1).
As might be expected, there were a considerable number of genes that were significantly upregulated or downregulated in both strain 247-infected mice and strain 927-infected mice versus control mice (Fig. 3). The genes unique to each set of infections at an FDR of <1 for strain 927-infected versus uninfected mouse and strain 247-infected versus uninfected mouse comparisons are shown in Tables S2 and S3 in the supplemental material (for full lists of the genes and rank product analysis results, go to http://tinyurl.com/trypmap or GEO series record number GSE17049). These data show that 59.5% of the genes differentially regulated in response to one strain were also differentially regulated to a similar degree in response to the other strain. The biological processes associated with the genes that were differentially regulated in infected and uninfected mice (as identified by IPA) were also similar between the strain 247 and 927 infections (Fig. 4), and as might be expected, the most significantly differentially regulated functions were the immune response and inflammation, together with genes associated with the hematological system. Indeed, the genes that predominate in both infections encode immunoglobulins (21 of the upregulated genes are immunoglobulin or immunoglobulin-related genes), which were not found in the analysis of differential expression between infections of the two strains, suggesting that the acquired immune response is upregulated in a similar fashion in both sets of infections.
FIG. 3.
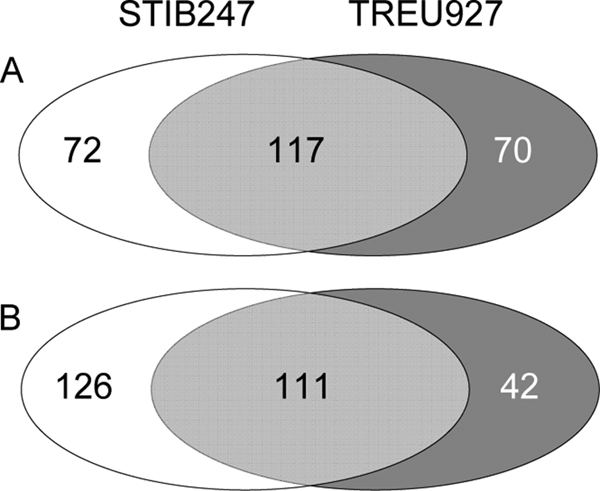
The number of genes significantly differentially expressed (FDR of <1) between trypanosome-infected and uninfected mouse spleens. The overlap represents commonality in strain 247- and 927-induced changes relative to uninfected controls, and numbers to the left and right are the strain-specifically regulated genes at this FDR level. Panel A represents genes upregulated in strain 927- or 247-infected mice relative to control mice, and panel B represents genes downregulated in strain 927- or 247-infected mice relative to control mice.
FIG. 4.

Significantly differentially regulated biological functions (A) and canonical pathways (B) between strain 247-infected and uninfected mice (247 versus C) and between strain 927-infected and uninfected mice (927 versus C), as identified by IPA. The y axis is the negative log of the Fischer exact test P value for the genes identified with the respective biofunction or canonical pathway. The dashed line indicates the threshold of significance (P < 0.05).
Microarray analysis of strain 927- versus strain 247-infected mice.
Approximately 40% of the regulated genes (up or down, FDR of <1) represent differentially expressed strain-specific responses (Fig. 3). The genes differentially regulated in the two sets of infected mice are potentially the key to understanding the different pathologies observed between infections with the two trypanosome strains. When analyses were undertaken to directly compare the gene expression from the strain 927-infected mice with that from the strain 247-infected mice, there were 62 genes upregulated in strain 927-infected mice compared to strain 247-infected mice and 39 genes downregulated at an FDR level of <1 (see Tables S4 and S5 in the supplemental material, respectively). However, this up- or downregulation is relative to the strain 927 expression value, and therefore “upregulation” of a gene in strain 927-infected mice compared to strain 247-infected mice could be due to downregulation of the gene in strain 247-infected mice, and equally, “downregulation” of genes in strain 927-infected mice could be due to upregulation of the gene in strain 247-infected mice. This was investigated by examining the relative expression values of the differentially regulated genes compared to control mouse expression values. In fact, 12 of the 62 genes “upregulated” in strain 927-infected mice compared to strain 247-infected mice are downregulated in strain 247-infected mice (see Table S4 in the supplemental material) and 3 of the 39 genes “downregulated” in strain 927-infected mice compared to strain 247-infected mice are upregulated in strain 247-infected mice (see Table S5 in the supplemental material).
IPA allows the genes that are differentially regulated to be placed in a physiological and biochemical context by grouping them according to pathway or function and also provides an alternative validation of up- or downregulation, with a correlation of statistical probability of validity with the number of genes being differentially expressed in the respective pathway. This analysis demonstrated that the most differentially regulated pathways are lipopolysaccharide/IL-1-mediated inhibition of retinoid X receptor (RXR) function, liver X receptor (LXR)/RXR activation, and IL-10 signaling (Fig. 5). These are interconnected pathways, as evidenced by the genes that are components of all three pathways (Table 2). This is a striking result, as it suggests that an interacting network of genes is differentially stimulated in a strain-specific manner.
FIG. 5.
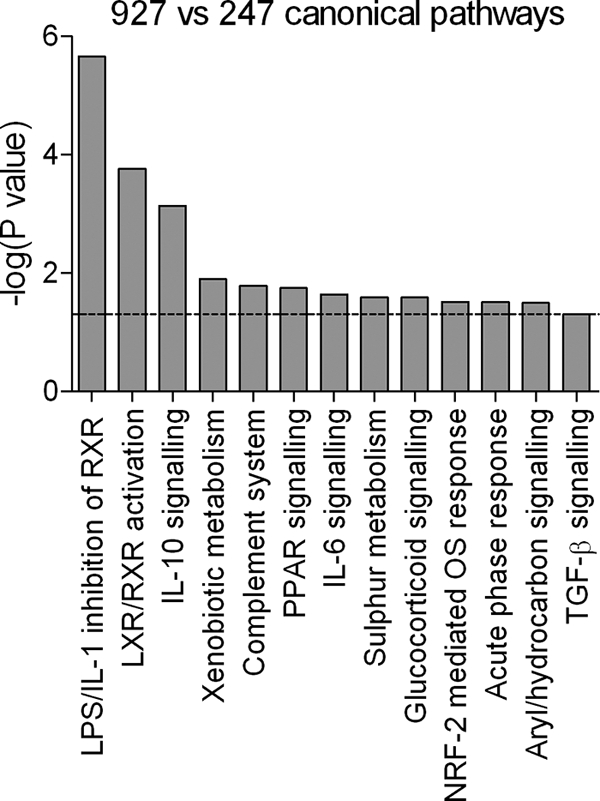
Canonical pathways significantly differentially regulated in strain 247- and strain 927-infected mice. The bar chart shows the Fischer exact test P values determining the probability that the association between the genes in the data set and the canonical pathway is explained by chance alone (the significance threshold of P < 0.05 is indicated by the dashed line).
TABLE 2.
Significantly differentially expressed genes associated with the three most significantly differentially expressed canonical pathways, i.e., LPS/IL-1-mediated inhibition of RXR function, LXR/RXR activation, and IL-10 signaling
| Pathway and gene | Description | FDRd | FCe |
|---|---|---|---|
| LPS/IL-1-mediated inhibition of RXR functiona | |||
| ApoE | Apolipoprotein E | 2.42 | 2.1 |
| Acsl6 | Acyl coenzyme A synthetase long-chain family member 6 | 0 | −5.0 |
| ApoC2 | Apolipoprotein C-II | 0.7 | 2.7 |
| IL4i1 | IL-4-induced 1 | 2.16 | −2.1 |
| Hmgcs2 | 3-Hydroxy-3-methylglutaryl coenzyme A synthase 2 (mitochondrial) | 1.2 | 2.9 |
| IL1r2 | IL-1 receptor, type II | 0.08 | 5.8 |
| Mgst2 | Microsomal glutathione S-transferase 2 | 3.48 | 2.0 |
| Gsta4 | Glutathione S-transferase A4 | 0.73 | 2.7 |
| Sult1A1 | Sulfotransferase family, cytosolic, 1A, phenol preferring, member 1 | 2.23 | 2.5 |
| CD14 | CD14 molecule | 0.26 | 3.7 |
| Xpo1 | Exportin 1 (CRM1 homolog, yeast) | 2.98 | −2.3 |
| Pltp | Phospholipid transfer protein | 2.63 | 2.1 |
| Abcc3 | ATP-binding cassette, subfamily C (CFTR/MRP), member 3 | 2.81 | −2.1 |
| Aldh6A1 | Aldehyde dehydrogenase 6 family, member A1 | 3.81 | 2.0 |
| LXR/RXR activationb | |||
| IL1r2 | IL-1 receptor, type II | 0.08 | 5.8 |
| ApoE | Apolipoprotein E | 2.42 | 2.1 |
| IL1rN | IL-1 receptor antagonist | 3.87 | 2.0 |
| CD14 | CD14 molecule | 0.26 | 3.7 |
| ApoC2 | Apolipoprotein C-II | 0.7 | 2.7 |
| Arg2 | Arginase, type II | 0 | 6.7 |
| Pltp | Phospholipid transfer protein | 2.63 | 2.1 |
| IL-10 signalingc | |||
| IL1r2 | IL-1 receptor, type II | 0.08 | 5.8 |
| Fos | v-fos FBJ murine osteosarcoma viral oncogene homolog | 0.11 | 5.2 |
| IL1rN | IL-1 receptor antagonist | 3.87 | 2.0 |
| CD14 | CD14 molecule | 0.26 | 3.7 |
| Arg2 | Arginase, type II | 0 | 6.7 |
| Fcgr2B | Fc fragment of immunoglobulin G, low-affinity IIb, receptor (CD32) | 1.79 | 2.3 |
−Log P value, 5.66E + 00 (Fischer's exact test for significance of pathway [see Materials and Methods]).
−Log P value, 3.76E + 00 (Fischer's exact test for significance of pathway [see Materials and Methods]).
−Log P value, 3.13E + 00 (Fischer's exact test for significance of pathway [see Materials and Methods]).
Only genes with FDRs of <5 are included.
FC, fold change in gene expression between strain 927-infected and strain 247-infected mice.
Several lines of evidence implicate alternative activation of macrophages as a major driver of strain-specific pathology. LXR activation (Fig. 5) has been linked with modulation of macrophage activation (30, 31). IL-10 (Fig. 2, 5) is a well-characterized counterinflammatory cytokine, and levels of IL-10 are important in determining pathogenesis in trypanosome-infected mice (18, 56). Arg2 transcription is known to be positively regulated by the LXR pathway (44) and is upregulated as a component of the IL-10 response (Table 2). Arginase II has a counterinflammatory effect upon macrophages by reducing NO production (44). In light of this evidence, the microarray output was analyzed for genes that are associated with alternative macrophage activation (those found to be significantly differentially regulated in the data set are listed in Table 3), as a set of genes associated with this process has recently been characterized in trypanosome and other parasitic infections (4, 16). There are 16 genes associated with alternative macrophage activation that are differentially regulated, and all (apart from IL-4 and IL-4il) are upregulated in strain 927-infected mice, with Ym1, Arg2, MglI, IL-10, IL1rl1, and Pla2g7 upregulated more than twofold. Fizz1, a gene strongly associated with the pathway (58, 67, 68), was not up- or downregulated between strain 927- and 247-infected mice. This may be due to the time of infection (early versus late), as Fizz1 is expressed later in infection, at least in C57BL/6 mice (58). It may also be due to the fact that spleen RNA was used, rather than RNA from purified macrophages, as has been the case in previous studies (16, 58). Both Arg2 and Ym1 induced much stronger differential signals than Fizz1 when purified macrophages from infected and uninfected mice were compared (58), suggesting that expression of these genes is more likely to be detected in RNA from a mixed cell population. To validate the alternative macrophage data from the microarray analysis, a quantitative real-time PCR was also carried out against two of the most differentially regulated genes involved in alternative macrophage activation, Ym1 and Arg2. The differences in the expression levels of these genes detected by real-time PCR correlated with the microarray differences, with strain 927-infected mice showing a similar fold increase in expression over strain 247-infected mice (Fig. 6). In addition, ELISA results examining day 10 levels of IL-10 (Fig. 2) correlate with microarray differences.
TABLE 3.
Significantly differentially expressed genes associated with alternative activation of macrophagesa
| Gene | Product | FCb |
|---|---|---|
| Arg2 | Arginase, type II | 6.7 |
| Ym1 | Chitinase 3-like 3 | 5.6 |
| Pla2g7 | Phospholipase A2, group VII | 2.4 |
| IL-10 | IL-10 | 2.1 |
| MglI | C-type lectin domain family 10, member A | 2.1 |
| IL1rl1 | IL-1 receptor-like 1 | 2.1 |
| Il1rn | IL-1 receptor antagonist | 2.0 |
| IL4i1 | IL-4-induced 1 | −2.0 |
| Socs3 | Suppressor of cytokine signaling 3 | 2.0 |
| Tgfb3 | TGF-β 3 | 1.9 |
| Tgfbi | TGF-β-induced, 68 kDa | 1.7 |
| F13a1 | Coagulation factor XIII, A1 polypeptide | 1.5 |
| IL4r | IL-4 receptor | 1.6 |
| Arg1 | Arginase, liver | 1.6 |
| IL-4 | IL-4 | −1.3 |
| Ptges | Prostaglandin E synthase | 1.3 |
FIG. 6.

Real-time PCR of the Ym1 (A) and Arg2 (B) genes. Real-time results are presented as relative quantification (RQ) with respect to control sample 1. Control reactions 1 to 3 were carried out with RNA from uninfected control mice, strain 927 reactions 1 to 3 used RNA extracted from mice infected with strain 927, and strain 247 reactions 1 to 3 used RNA from mice infected with strain 247. Negative controls (absence of reverse transcriptase and no-template controls) were all negative in each case (data not shown).
One of the main phenotypes analyzed in the experimental mice was anemia, with strain 927-infected mice showing significantly greater anemia than strain 247-infected mice and, conversely, strain 247-infected mice generating significantly greater reticulocytosis (Fig. 2). Genes associated with the hematological system, as identified from the Ingenuity database, were among the most significantly differentiated between infections with the two trypanosome strains (Table 4). Several genes that are implicated in the hematopoietic response were upregulated in strain 247-infected mice compared to strain 927-infected mice (presented as negative fold changes in Table 4). Chief among these genes are those for Krüppel-like factor 1 (Klf1), which coordinates erythroid cell proliferation and plays a role in hemoglobinization (8); erythrocyte membrane protein band 4.2 (Ebp4.2), also implicated in erythropoiesis (87); and dematin (Ebp4.9), which is implicated in maintaining the functional integrity of erythrocytes, the disruption of which is associated with anemia (33). Also upregulated is the gene for acetylcholinesterase (Ache), which has also been implicated in the expansion and proliferation of primary bone marrow cells (75). The Duffy antigen/receptor for chemokines (Darc) is also upregulated in strain 247-infected mice and has been suggested to play a role in controlling inflammation by acting as a chemokine sink (12). In contrast, the erythropoietic genes are downregulated in strain 927-infected mice, and the majority of the genes associated with the hematological system that are upregulated in strain 927-infected mice are immunological/inflammatory response associated. The splenic gene expression data, together with the reticulocyte measurements (Fig. 2), suggest that extramedullary hematopoiesis is occurring to a greater extent in strain 247-infected mice than in strain 927-infected mice, and this may be compensating for any loss of red blood cells in the strain 247 infections.
TABLE 4.
Genes associated with the hematological system that are differentially expressed in strain 927-infected mice and strain 247-infected mice
| Gene | Product | Location | Type | FCb |
|---|---|---|---|---|
| Achea | Acetylcholinesterase | Plasma membrane | Enzyme | −2.1 |
| Aicdaa | Activation-induced cytidine deaminase | Cytoplasm | Enzyme | −1.9 |
| ApoEa | Apolipoprotein E | Extracellular space | Transporter | 2.1 |
| Art2A | ADP-ribosyltransferase 2a | Extracellular space | Enzyme | −1.9 |
| C3ar1 | Complement component 3a receptor 1 | Plasma membrane | G-protein-coupled receptor | 1.9 |
| C5ar1 | Complement component 5a receptor 1 | Plasma membrane | G-protein-coupled receptor | 1.8 |
| Ccl3 | Chemokine (C-C motif) ligand 3 | Extracellular space | Cytokine | 2.2 |
| Ccl8 | Chemokine (C-C motif) ligand 8 | Extracellular space | Cytokine | 2.2 |
| Ccr6 | Chemokine (C-C motif) receptor 6 | Plasma membrane | G-protein-coupled receptor | −2 |
| CD14 | CD14 molecule | Plasma membrane | Transmembrane receptor | 3.7 |
| CD22a | CD22 molecule | Plasma membrane | Other | −2.3 |
| CD71a | CD71 molecule | Plasma membrane | Transporter | −2.3 |
| CD80 | CD80 molecule | Plasma membrane | Transmembrane receptor | 2.4 |
| CD163 | CD163 molecule | Plasma membrane | Transmembrane receptor | 1.9 |
| Cr2a | Complement component receptor 2 | Plasma membrane | Transmembrane receptor | −3.0 |
| Ctla4 | Cytotoxic T-lymphocyte-associated protein 4 | Plasma membrane | Other | 4.4 |
| Ctsl2 | Cathepsin L2 | Cytoplasm | Peptidase | 2.4 |
| Cxcl3 | Chemokine (C-X-C motif) ligand 3 | Extracellular space | Cytokine | 6.1 |
| Cxcr7 | Chemokine (C-X-C motif) receptor 7 | Plasma membrane | G-protein-coupled receptor | 3.6 |
| Darca | Duffy blood group, chemokine receptor | Plasma membrane | G-protein-coupled receptor | −3.8 |
| Dusp1 | Dual-specificity phosphatase 1 | Nucleus | Phosphatase | 2.8 |
| Epb42a | Erythrocyte membrane protein band 4.2 | Plasma membrane | Transporter | −4.7 |
| Epb49a | Erythrocyte membrane protein band 4.9 (dematin) | Plasma membrane | Other | −3.2 |
| F7 | Coagulation factor VII (serum prothrombin conversion accelerator) | Plasma membrane | Peptidase | 2.8 |
| Fcgr2b | Fc fragment of immunoglobulin G, low-affinity IIb, receptor (CD32) | Plasma membrane | Transmembrane receptor | 2.3 |
| Fos | v-fos FBJ murine osteosarcoma viral oncogene homolog | Nucleus | Transcription regulator | 5.2 |
| Fprl1 | Formyl peptide receptor 2 | Plasma membrane | G-protein-coupled receptor | 2.0 |
| Gna13 | Guanine nucleotide binding protein (G protein), alpha 13 | Plasma membrane | Enzyme | 2.8 |
| Igh-1A | Immunoglobulin heavy chain 1a (serum immunoglobulin G2a) | Extracellular space | Other | 1.9 |
| IL1rl1 | IL-1 receptor-like 1 | Plasma membrane | Transmembrane receptor | 2.1 |
| IL1rN | IL-1 receptor antagonist | Extracellular space | Cytokine | 2.0 |
| IL4Iia | IL-4-induced 1 | Cytoplasm | Enzyme | −2.0 |
| Klf1a | Krüppel-like factor 1 (erythroid) | Nucleus | Transcription regulator | −4.1 |
| Lcn2 | Lipocalin 2 | Extracellular space | Transporter | 1.9 |
| Lilrb4 | leukocyte immunoglobulin-like receptor, subfamily B (with TM and ITIM domains), member 4 | Plasma membrane | Other | 2.0 |
Gene upregulated in strain 247-infected mice compared to strain 927-infected mice.
FC, fold change.
Taken together, our data point toward the balance of pro- and counterinflammatory responses influencing the course of pathogenesis in mice, resulting in the strain 927-infected mice displaying a more severe and chronic anemia, associated with splenic alternative macrophage activation and increased expression of IL-10 and RXR/LXR. In contrast, the strain 247-infected mice are able to control their anemia and mount a reticulocytosis associated with higher plasma IL-12 levels. These data suggest that the innate immune response is a key determinant of strain-specific pathogenesis.
DISCUSSION
The differential pathogenesis induced by different parasite strains provides a route to dissecting the mechanisms of parasite control by the host and the disease-causing pathways induced by virulent parasites. We have demonstrated significant differences in the pathology induced by two genetically distinct parasite strains. Importantly, we have shown that different pathways are induced by the two strains and that the strain-specific pathogenesis is not simply due to a difference in the magnitude of the same pathways. Our results will include any host responses caused by any differences in growth rate and parasitemia between strains 927 and 247 (81), but we predict that these would be minor given that several studies have indicated a lack of correlation between parasite numbers and host pathology, both in mice infected with T. brucei (22, 43) and in trypanotolerant and susceptible cattle infected with T. congolense (64).
Three main findings arise from our data: the common expression profiles between the infections of genes related to the adaptive immune response, the differential regulation of genes associated with the hematological system and anemia, and the differential expression of genes associated with the inflammatory response and their association with the progression of pathogenesis.
Adaptive immune response.
The adaptive immune response is significantly differentially expressed between infected mice and uninfected controls, but the associated genes are not differentially expressed between strain 927- and 247-infected mice. The upregulation of genes associated with the adaptive immune response is expected, as trypanosomes provoke a strong and persistent antibody response, particularly against the surface-expressed and abundant VSGs (46). Interestingly, a recent study indicated that there was trypanosome-induced loss of memory responses in the spleen, probably by induction of apoptosis in splenic B cells (65). We examined the expression profiles of the genes identified as being differentially expressed during the splenic remodeling and inhibition of B-cell responsiveness, and in both the strain 927 and 247 infections, these genes were either downregulated (Bcl2, Baff, Baff-R) or upregulated (caspase-3), but there were no differences between infections with the two strains. This confirms that a trypanosome-driven disruption of the B-cell response is occurring, but it is common to both parasite strains and so is not responsible for the differential pathogenesis.
Anemia.
Much of the pathology we have measured is associated with the hematological system and anemia. In other studies, pathology associated with anemia does not correlate with the overall ability of mice to survive infections; for example, trypanotolerant C57BL/6 mice exhibit more-severe anemia than their trypanosusceptible counterparts and yet clearly are better able to survive infections (55). It has been shown previously that strain 927-infected mice develop clinical symptoms of disease much more rapidly than strain 247-infected mice and had to be removed from experiments on humane grounds earlier (the average time point for humane termination of infection was 29 days for strain 927-infected mice, compared to 45 days for strain 247-infected mice [81]). This study serves as a proxy survival assay and suggests that, in the case of these two strains of T. brucei, the pathology we are observing correlates with decreased survival.
Our data suggest that in the case of strain 247-infected mice, erythropoiesis may be compensating for any drop in red blood cell numbers, as there is a significant reticulocytosis and a greater degree of splenomegaly in strain 247-infected mice, accompanied by a limited drop in red blood cell counts. In contrast, in strain 927 infections, the red blood cell counts decrease much more markedly, and although there is a rise in EPO levels, there is very little detectable reticulocyte response coupled with more limited splenomegaly. The spleen has been identified as a major center of erythropoiesis in response to parasitic infection, in particular, malaria, but is also a major center for the mononuclear phagocytic system (13). Therefore, one could postulate that the general increase in mass in both infected spleens is due to the responsive phagocytic compartment and the additional increase in strain 247-infected spleens is due to the erythropoietic stimulation. Dyserythropoiesis has been suggested to play a role in anemia due to trypanosome infection, and the suppressive activity of infection-induced NO or cytokines has been implicated (22, 37), particularly early in infection (3). The microarray results in our study suggest that dyserythropoiesis is occurring in the strain 927-infected mice. However, negligible levels of NO were detected in plasma although IFN-γ and IL-10 plasma levels were associated with the more severe anemia. Both IFN-γ and IL-10 have suppressive effects upon erythropoiesis (10, 45), and we hypothesize that the anemia observed in the strain 927-infected mice is due to the suppression of erythropoiesis as a consequence of the increased expression of these cytokines.
Our findings on splenic hematological gene expression bear interesting comparison with the recent studies of the effects of T. congolense infections on anemia in trypanotolerant and trypanosusceptible mice (59). The trypanotolerant mice (C57BL/6) display more-severe anemia than trypanosusceptible mice (AJ or BALB/c), and recovery from anemia is correlated with spleen size, a feature also observed in our data. It was found that the erythropoietic and innate immune responses played crucial roles in the differential anemia observed but that the acquired immune response was not implicated (59), in concordance with our findings on T. brucei. The genes associated with a reduced erythropoietic response in C57BL/6 mice in response to T. congolense infection, namely, those for structural proteins (spectrin and glycophorin) and transcription factors (Lmo2, Zfpm1, Klf1, and Tcfe2a), were also expressed at lower levels in the spleens of BALB/c mice infected with strain 927-infected compared with strain 247-infected BALB/c mice (all significant at an FDR of <5). Iron homeostasis has also been suggested to play a role in trypanosome-induced anemia (59, 77), and we found some evidence for this in our study. Most of the genes previously identified were either not differentially expressed relative to control mice (hepcidin, ferritin, Dmt-1, Fpn-1, Fhc, CD16, CD91) or not differentially expressed between infections with the two trypanosome strains (Hmox-1, ceruloplasmin, CD36, and transferrin, all downregulated to similar levels in both infections). However, the genes for transferrin receptors 1 and 2 (Tf-R1 and Tf-R2), which are major determinants maintaining iron homeostasis, were both significantly upregulated in strain 247-infected mice compared to strain 927-infected mice. Of these two genes, Tf-R1 was highly significantly differentially expressed (3.0-fold change) at day 10, in agreement with previous data on the upregulation of this gene in the acute stage of infection (77). In the latter study and others (76), the acute stage of infection was associated with type 1 cytokines, but in the present study, the picture is less clear, as the anemic mice expressed both a type 2 (IL-10-dominated response) and a type 1 cytokine (IFN-γ). Therefore, from our data, there is some suggestion that iron homeostasis plays a role in the anemia seen, but this conclusion may well depend upon the strain of trypanosome used. Our data combine to suggest that strain 247-infected mice are mounting a greater erythropoietic response to counter the drop in red blood cell numbers than strain 927-infected mice, whereas the anemia observed in strain 927-infected mice is associated with the inflammatory response and an associated inability to stimulate erythropoiesis.
Inflammation.
One of the keys to the strain-specific pathogenesis seems to be the role of the IL-10-dominated counterinflammatory response linked to alternative macrophage activation. This pathway has also been identified as crucial in determining susceptibility in murine leishmaniasis (24). In addition, the LXR genes also contribute to modulation of macrophage activation, leading to counterinflammatory suppression of NO production (44). This indicates that the degree to which the initial inflammatory response is modulated may be a key determinant of the inflammatory response of the host (66). In our studies, infections with strain 927 where the IL-10/alternative macrophage dominated were those that displayed greater pathology. In previous studies, alternative macrophage activation has been implicated in T. brucei infections (4), but it has been suggested that these pathways result in amelioration of type 1-driven pathology (4, 18), and arginase II has been identified as differentially activated by different strains of T. b. gambiense in mice and is associated with differences in pathology (25). The role of both IL-10 and alternative macrophages in controlling pathology induced by trypanosomes has also been identified in T. congolense infections (4, 68). In addition, LXR and RXR, involved in the two most differentially regulated pathways between strain 927- and 247-infected mice (Fig. 5), are important determinants of the fate of macrophages and are thought to play a role in innate immunity to microbes (82, 86). Modulation of macrophage activation has been heavily implicated in the control of trypanosome infections, and the direction of polarization has been suggested to be the key in determining disease outcome (76). The linking of the identified pathways to pathology may be dependent upon the timing of the transition from proinflammatory cytokines, which are essential for controlling the parasites in the early stage of infection (21), to a counterinflammatory response that limits the pathology that would result from a prolonged proinflammatory environment (5, 18, 19, 76). In the context of our data, it may be that this switch occurs at different points, or the dynamics of the switch differ between infections with strain 247 or 927, and examining the cytokine/gene expression dynamics over a longer time course of infection may give further insight into the role that this switch plays in strain-specific pathogenesis. Our data certainly suggest that using parasite strains that differ in pathogenicity will prove a useful tool in this respect.
One surprising and perhaps contradictory finding is the stimulation of both pro- and counterinflammatory cytokines in the strain 927-infected mice (IFN-γ and IL-10) that are both less upregulated in the strain 247-infected mice, which, in contrast, display consistently greater concentrations of IL-12. The cytokines were measured directly from plasma and not from cells isolated from the spleen. The plasma may have cytokines contributed from multiple organs and tissues and therefore may not be representative of what is occurring in the spleen. Certainly, the microarray studies suggest that neither IL-12 nor IFN-γ is significantly differentially expressed in the spleen. This apparently paradoxical pattern of cytokine expression is a finding that requires further investigation, and the cellular source of the plasma cytokines would ideally be identified.
The results presented here clearly demonstrate that there are significant differences in virulence between strains of T. brucei involving different host pathways. The fact that different pathways are involved, rather than a simple difference in the magnitude of expression of the same pathways, is a novel finding in host-parasite dynamics. The conclusion that the balance of the innate immune response is crucial to disease outcome has intriguing parallels with studies examining the abilities of different mouse strains or cattle breeds to tolerate infection with trypanosomes, where similar conclusions have been drawn (59, 60). These results suggest that control of trypanosome infection should not be analyzed solely from the viewpoint of the host, but that parasite genetic diversity also has to be considered as a determinant of disease progression. In the future, therefore, it will be important to study different host-parasite genotype combinations, as the role of a particular host pathway may depend on both the host and parasite genetic backgrounds. The observed differences in pathology also open up the possibility of identifying the parasite genes that are responsible, for example, by using a forward genetic approach, as has been employed in Toxoplasma gondii (70, 78, 80), particularly as a genetic map exists for a cross using the strains involved in this study (40, 47). The findings also obviously have implications for the use of genetic improvement by selective breeding of cattle for trypanotolerance, as any breeding must take into account the ability of animals to cope with the range of trypanosome virulence that is undoubtedly present in the field.
Supplementary Material
Acknowledgments
This work has been supported by a Wellcome Trust Programme grant (074732). A. MacLeod is a Wellcome Trust Career Development Fellow (grant 079703) and also acknowledges financial support from Tenovus Scotland.
We acknowledge the assistance of Pawel Herzyk, Julie Galbraith, and Jing Wang at the Sir Henry Wellcome Functional Genomics Facility, University of Glasgow, for assistance with RNA quality control and microarray analysis.
Editor: J. F. Urban, Jr.
Footnotes
Published ahead of print on 19 January 2010.
Supplemental material for this article may be found at http://iai.asm.org/.
REFERENCES
- 1.Antoine-Moussiaux, N., P. Buscher, and D. Desmecht. 2009. Host-parasite interactions in trypanosomiasis: on the way to an antidisease strategy. Infect. Immun. 77:1276-1284. [DOI] [PMC free article] [PubMed] [Google Scholar]
- 2.Barrett, M. P., R. J. Burchmore, A. Stich, J. O. Lazzari, A. C. Frasch, J. J. Cazzulo, and S. Krishna. 2003. The trypanosomiases. Lancet 362:1469-1480. [DOI] [PubMed] [Google Scholar]
- 3.Beschin, A., L. Brys, S. Magez, M. Radwanska, and P. De Baetselier. 1998. Trypanosoma brucei infection elicits nitric oxide-dependent and nitric oxide-independent suppressive mechanisms. J. Leukoc. Biol. 63:429-439. [DOI] [PubMed] [Google Scholar]
- 4.Bosschaerts, T., M. Guilliams, W. Noël, M. Herin, R. F. Burk, K. E. Hill, L. Brys, G. Raes, G. H. Ghassabeh, P. De Baetselier, and A. Beschin. 2008. Alternatively activated myeloid cells limit pathogenicity associated with African trypanosomiasis through the IL-10 inducible gene selenoprotein P. J. Immunol. 180:6168-6175. [DOI] [PubMed] [Google Scholar]
- 5.Bosschaerts, T., M. Guilliams, B. Stijlemans, P. De Baetselier, and A. Beschin. 2009. Understanding the role of monocytic cells in liver inflammation using parasite infection as a model. Immunobiology 214:737-747. [DOI] [PubMed] [Google Scholar]
- 6.Boulland, M. L., J. Marquet, V. Molinier-Frenkel, P. Moller, C. Guiter, F. Lasoudris, C. Copie-Bergman, M. Baia, P. Gaulard, K. Leroy, and F. Castellano. 2007. Human IL4I1 is a secreted l-phenylalanine oxidase expressed by mature dendritic cells that inhibits T-lymphocyte proliferation. Blood 110:220-227. [DOI] [PubMed] [Google Scholar]
- 7.Breitling, R., P. Armengaud, A. Amtmann, and P. Herzyk. 2004. Rank products: a simple, yet powerful, new method to detect differentially regulated genes in replicated microarray experiments. FEBS Lett. 573:83-92. [DOI] [PubMed] [Google Scholar]
- 8.Coghill, E., S. Eccleston, V. Fox, L. Cerruti, C. Brown, J. Cunningham, S. Jane, and A. Perkins. 2001. Erythroid Krüppel-like factor (EKLF) coordinates erythroid cell proliferation and hemoglobinization in cell lines derived from EKLF null mice. Blood 97:1861-1868. [DOI] [PubMed] [Google Scholar]
- 9.Colotta, F., S. Saccani, J. G. Giri, S. K. Dower, J. E. Sims, M. Introna, and A. Mantovani. 1996. Regulated expression and release of the IL-1 decoy receptor in human mononuclear phagocytes. J. Immunol. 156:2534-2541. [PubMed] [Google Scholar]
- 10.Cooper, A. C., A. Mikhail, M. W. Lethbridge, D. M. Kemeny, and I. C. Macdougall. 2003. Increased expression of erythropoiesis inhibiting cytokines (IFN-gamma, TNF-alpha, IL-10, and IL-13) by T cells in patients exhibiting a poor response to erythropoietin therapy. J. Am. Soc. Nephrol. 14:1776-1784. [DOI] [PubMed] [Google Scholar]
- 11.Courtin, D., J. Milet, V. Jamonneau, C. S. Yeminanga, V. K. Kumeso, C. M. Bilengue, C. Betard, and A. Garcia. 2007. Association between human African trypanosomiasis and the IL6 gene in a Congolese population. Infect. Genet. Evol. 7:60-68. [DOI] [PubMed] [Google Scholar]
- 12.Dawson, T. C., A. B. Lentsch, Z. Wang, J. E. Cowhig, A. Rot, N. Maeda, and S. C. Peiper. 2000. Exaggerated response to endotoxin in mice lacking the Duffy antigen/receptor for chemokines (DARC). Blood 96:1681-1684. [PubMed] [Google Scholar]
- 13.Engwerda, C. R., L. Beattie, and F. H. Amante. 2005. The importance of the spleen in malaria. Trends Parasitol. 21:75-80. [DOI] [PubMed] [Google Scholar]
- 14.Fèvre, E. M., B. V. Wissmann, S. C. Welburn, and P. Lutumba. 2008. The burden of human African trypanosomiasis. PLoS Negl. Trop. Dis. 2:e333. [DOI] [PMC free article] [PubMed] [Google Scholar]
- 15.Geigy, R., and M. Kauffmann. 1973. Sleeping sickness survey in the Serengeti area (Tanzania) 1971. I. Examination of large mammals for trypanosomes. Acta Trop. 30:12-23. [PubMed] [Google Scholar]
- 16.Ghassabeh, G. H., P. de Baetselier, L. Brys, W. Noël, J. Van Ginderachter, S. Meerschaut, A. Beschin, F. Brombacher, and G. Raes. 2006. Identification of a common gene signature for type II cytokine-associated myeloid cells elicited in vivo in different pathologic conditions. Blood 108:575-583. [DOI] [PubMed] [Google Scholar]
- 17.Goedbloed, E., G. S. Ligthart, D. M. Minter, A. J. Wilson, F. K. Dar, and J. Paris. 1973. Serological studies of trypanosomiasis in East Africa. II. Comparisons of antigenic types of Trypanosoma brucei subgroup organisms isolated from wild tsetse flies. Ann. Trop. Med. Parasitol. 67:31-43. [PubMed] [Google Scholar]
- 18.Guilliams, M., K. Movahedi, T. Bosschaerts, T. VandenDriessche, M. K. Chuah, M. Herin, A. Acosta-Sanchez, L. Ma, M. Moser, J. A. Van Ginderachter, L. Brys, P. De Baetselier, and A. Beschin. 2009. IL-10 dampens TNF/inducible nitric oxide synthase-producing dendritic cell-mediated pathogenicity during parasitic infection. J. Immunol. 182:1107-1118. [DOI] [PubMed] [Google Scholar]
- 19.Guilliams, M., G. Oldenhove, W. Noël, M. Herin, L. Brys, P. Loi, V. Flamand, M. Moser, P. De Baetselier, and A. Beschin. 2007. African trypanosomiasis: naturally occurring regulatory T cells favor trypanotolerance by limiting pathology associated with sustained type 1 inflammation. J. Immunol. 179:2748-2757. [DOI] [PubMed] [Google Scholar]
- 20.Hanotte, O., Y. Ronin, M. Agaba, P. Nilsson, A. Gelhaus, R. Horstmann, Y. Sugimoto, S. Kemp, J. Gibson, A. Korol, M. Soller, and A. Teale. 2003. Mapping of quantitative trait loci controlling trypanotolerance in a cross of tolerant West African N′Dama and susceptible East African Boran cattle. Proc. Natl. Acad. Sci. U. S. A. 100:7443-7448. [DOI] [PMC free article] [PubMed] [Google Scholar]
- 21.Hertz, C. J., H. Filutowicz, and J. M. Mansfield. 1998. Resistance to the African trypanosomes is IFN-gamma dependent. J. Immunol. 161:6775-6783. [PubMed] [Google Scholar]
- 22.Hertz, C. J., and J. M. Mansfield. 1999. IFN-gamma-dependent nitric oxide production is not linked to resistance in experimental African trypanosomiasis. Cell. Immunol. 192:24-32. [DOI] [PubMed] [Google Scholar]
- 23.Hide, G., N. Buchanan, S. Welburn, I. Maudlin, J. D. Barry, and A. Tait. 1991. Trypanosoma brucei rhodesiense: characterisation of stocks from Zambia, Kenya, and Uganda using repetitive DNA probes. Exp. Parasitol. 72:430-439. [DOI] [PubMed] [Google Scholar]
- 24.Hölscher, C., B. Arendse, A. Schwegmann, E. Myburgh, and F. Brombacher. 2006. Impairment of alternative macrophage activation delays cutaneous leishmaniasis in nonhealing BALB/c mice. J. Immunol. 176:1115-1121. [DOI] [PubMed] [Google Scholar]
- 25.Holzmuller, P., D. G. Biron, P. Courtois, M. Koffi, R. Bras-Goncalves, S. Daulouede, P. Solano, G. Cuny, P. Vincendeau, and V. Jamonneau. 2008. Virulence and pathogenicity patterns of Trypanosoma brucei gambiense field isolates in experimentally infected mouse: differences in host immune response modulation by secretome and proteomics. Microbes Infect. 10:79-86. [DOI] [PubMed] [Google Scholar]
- 26.Huan, C. N., L. Webb, P. H. Lambert, and P. A. Miescher. 1975. Pathogenesis of the anemia in African trypanosomiasis: characterization and purification of a hemolytic factor. Schweiz. Med. Wochenschr. 105:1582-1583. [PubMed] [Google Scholar]
- 27.Irizarry, R. A., B. Hobbs, F. Collin, Y. D. Beazer-Barclay, K. J. Antonellis, U. Scherf, and T. P. Speed. 2003. Exploration, normalization, and summaries of high density oligonucleotide array probe level data. Biostatistics 4:249-264. [DOI] [PubMed] [Google Scholar]
- 28.Jenkins, G. C., and C. A. Facer. 1985. Hematology of African trypanosomiasis, p. 13-44. In I. Tizard (ed.), Immunology and pathogenesis of trypanosomiasis. Academic Press, Inc., New York, NY.
- 29.Jensen, K., E. Paxton, D. Waddington, R. Talbot, M. A. Darghouth, and E. J. Glass. 2008. Differences in the transcriptional responses induced by Theileria annulata infection in bovine monocytes derived from resistant and susceptible cattle breeds. Int. J. Parasitol. 38:313-325. [DOI] [PubMed] [Google Scholar]
- 30.Joseph, S. B., M. N. Bradley, A. Castrillo, K. W. Bruhn, P. A. Mak, L. Pei, J. Hogenesch, R. M. O'Connell, R. G. Cheng, E. Saez, J. F. Miller, and P. Tontonoz. 2004. LXR-dependent gene expression is important for macrophage survival and the innate immune response. Cell 119:299-309. [DOI] [PubMed] [Google Scholar]
- 31.Joseph, S. B., A. Castrillo, B. A. Laffitte, D. J. Mangelsdorf, and P. Tontonoz. 2003. Reciprocal regulation of inflammation and lipid metabolism by liver X receptors. Nat. Med. 9:213-219. [DOI] [PubMed] [Google Scholar]
- 32.Kemp, S. J., F. Iraqi, A. Darvasi, M. Soller, and A. J. Teale. 1997. Localization of genes controlling resistance to trypanosomiasis in mice. Nat. Genet. 16:194-196. [DOI] [PubMed] [Google Scholar]
- 33.Khanna, R., S. H. Chang, S. Andrabi, M. Azam, A. Kim, A. Rivera, C. Brugnara, P. S. Low, S. C. Liu, and A. H. Chishti. 2002. Headpiece domain of dematin is required for the stability of the erythrocyte membrane. Proc. Natl. Acad. Sci. U. S. A. 99:6637-6642. [DOI] [PMC free article] [PubMed] [Google Scholar]
- 34.Kierstein, S., H. Noyes, J. Naessens, Y. Nakamura, C. Pritchard, J. Gibson, S. Kemp, and A. Brass. 2006. Gene expression profiling in a mouse model for African trypanosomiasis. Genes Immun. 7:667-679. [DOI] [PMC free article] [PubMed] [Google Scholar]
- 35.Lanham, S. M., and D. G. Godfrey. 1970. Isolation of salivarian trypanosomes from man and other mammals using DEAE-cellulose. Exp. Parasitol. 28:521-534. [DOI] [PubMed] [Google Scholar]
- 36.Lovegrove, F. E., L. Pena-Castillo, N. Mohammad, W. C. Liles, T. R. Hughes, and K. C. Kain. 2006. Simultaneous host and parasite expression profiling identifies tissue-specific transcriptional programs associated with susceptibility or resistance to experimental cerebral malaria. BMC Genomics 7:295. [DOI] [PMC free article] [PubMed] [Google Scholar]
- 37.Mabbott, N., and J. Sternberg. 1995. Bone marrow nitric oxide production and development of anemia in Trypanosoma brucei-infected mice. Infect. Immun. 63:1563-1566. [DOI] [PMC free article] [PubMed] [Google Scholar]
- 38.MacLean, L., J. E. Chisi, M. Odiit, W. C. Gibson, V. Ferris, K. Picozzi, and J. M. Sternberg. 2004. Severity of human African trypanosomiasis in East Africa is associated with geographic location, parasite genotype, and host inflammatory cytokine response profile. Infect. Immun. 72:7040-7044. [DOI] [PMC free article] [PubMed] [Google Scholar]
- 39.MacLean, L., M. Odiit, A. MacLeod, L. Morrison, L. Sweeney, A. Cooper, P. G. Kennedy, and J. M. Sternberg. 2007. Spatially and genetically distinct African trypanosome virulence variants defined by host interferon-gamma response. J. Infect. Dis. 196:1620-1628. [DOI] [PMC free article] [PubMed] [Google Scholar]
- 40.MacLeod, A., A. Tweedie, S. McLellan, S. Taylor, N. Hall, M. Berriman, N. M. El-Sayed, M. Hope, C. M. Turner, and A. Tait. 2005. The genetic map and comparative analysis with the physical map of Trypanosoma brucei. Nucleic Acids Res. 33:6688-6693. [DOI] [PMC free article] [PubMed] [Google Scholar]
- 41.Magez, S., M. Radwanska, A. Beschin, K. Sekikawa, and P. De Baetselier. 1999. Tumor necrosis factor alpha is a key mediator in the regulation of experimental Trypanosoma brucei infections. Infect. Immun. 67:3128-3132. [DOI] [PMC free article] [PubMed] [Google Scholar]
- 42.Magez, S., B. Stijlemans, M. Radwanska, E. Pays, M. A. Ferguson, and P. De Baetselier. 1998. The glycosyl-inositol-phosphate and dimyristoylglycerol moieties of the glycosylphosphatidylinositol anchor of the trypanosome variant-specific surface glycoprotein are distinct macrophage-activating factors. J. Immunol. 160:1949-1956. [PubMed] [Google Scholar]
- 43.Magez, S., C. Truyens, M. Merimi, M. Radwanska, B. Stijlemans, P. Brouckaert, F. Brombacher, E. Pays, and P. De Baetselier. 2004. P75 tumor necrosis factor-receptor shedding occurs as a protective host response during African trypanosomiasis. J. Infect. Dis. 189:527-539. [DOI] [PubMed] [Google Scholar]
- 44.Marathe, C., M. N. Bradley, C. Hong, F. Lopez, C. M. Ruiz de Galarreta, P. Tontonoz, and A. Castrillo. 2006. The arginase II gene is an anti-inflammatory target of liver X receptor in macrophages. J. Biol. Chem. 281:32197-32206. [DOI] [PubMed] [Google Scholar]
- 45.McDevitt, M. A., J. Xie, V. Gordeuk, and R. Bucala. 2004. The anemia of malaria infection: role of inflammatory cytokines. Curr. Hematol. Rep. 3:97-106. [PubMed] [Google Scholar]
- 46.Morrison, L. J., L. Marcello, and R. McCulloch. 2009. Antigenic variation in the African trypanosome: molecular mechanisms and phenotypic complexity. Cell. Microbiol. 11:1724-1734. [DOI] [PubMed] [Google Scholar]
- 47.Morrison, L. J., A. Tait, S. McLellan, L. Sweeney, C. M. Turner, and A. MacLeod. 2009. A major genetic locus in Trypanosoma brucei is a determinant of host pathology. PLoS Negl. Trop. Dis. 3:e557. [DOI] [PMC free article] [PubMed] [Google Scholar]
- 48.Morrison, W. I., and M. Murray. 1979. Trypanosoma congolense: inheritance of susceptibility to infection in inbred strains of mice. Exp. Parasitol. 48:364-374. [DOI] [PubMed] [Google Scholar]
- 49.Morrison, W. I., G. E. Roelants, K. S. Mayor-Withey, and M. Murray. 1978. Susceptibility of inbred strains of mice to Trypanosoma congolense: correlation with changes in spleen lymphocyte populations. Clin. Exp. Immunol. 32:25-40. [PMC free article] [PubMed] [Google Scholar]
- 50.Murray, M., D. J. Clifford, G. Gettinby, W. F. Snow, and W. I. McIntyre. 1981. Susceptibility to African trypanosomiasis of N′Dama and Zebu cattle in an area of Glossina morsitans submorsitans challenge. Vet. Rec. 109:503-510. [PubMed] [Google Scholar]
- 51.Murray, M., W. I. Morrison, and D. D. Whitelaw. 1982. Host susceptibility to African trypanosomiasis: trypanotolerance. Adv. Parasitol. 21:1-68. [DOI] [PubMed] [Google Scholar]
- 52.Naessens, J. 2006. Bovine trypanotolerance: a natural ability to prevent severe anaemia and haemophagocytic syndrome? Int. J. Parasitol. 36:521-528. [DOI] [PubMed] [Google Scholar]
- 53.Naessens, J., H. Kitani, Y. Nakamura, Y. Yagi, K. Sekikawa, and F. Iraqi. 2005. TNF-alpha mediates the development of anaemia in a murine Trypanosoma brucei rhodesiense infection, but not the anaemia associated with a murine Trypanosoma congolense infection. Clin. Exp. Immunol. 139:405-410. [DOI] [PMC free article] [PubMed] [Google Scholar]
- 54.Naessens, J., S. G. Leak, D. J. Kennedy, S. J. Kemp, and A. J. Teale. 2003. Responses of bovine chimaeras combining trypanosomosis resistant and susceptible genotypes to experimental infection with Trypanosoma congolense. Vet. Parasitol. 111:125-142. [DOI] [PubMed] [Google Scholar]
- 55.Nakamura, Y., J. Naessens, M. Takata, T. Taniguchi, K. Sekikawa, J. Gibson, and F. Iraqi. 2003. Susceptibility of heat shock protein 70.1-deficient C57BL/6J, wild-type C57BL/6J, and A/J mice to Trypanosoma congolense infection. Parasitol. Res. 90:171-174. [DOI] [PubMed] [Google Scholar]
- 56.Namangala, B., P. De Baetselier, and A. Beschin. 2009. Both type-I and type-II responses contribute to murine trypanotolerance. J. Vet. Med. Sci. 71:313-318. [DOI] [PubMed] [Google Scholar]
- 57.Namangala, B., W. Noël, P. De Baetselier, L. Brys, and A. Beschin. 2001. Relative contribution of interferon-gamma and interleukin-10 to resistance to murine African trypanosomosis. J. Infect. Dis. 183:1794-1800. [DOI] [PubMed] [Google Scholar]
- 58.Noël, W., G. Hassanzadeh, G. Raes, B. Namangala, I. Daems, L. Brys, F. Brombacher, P. D. Baetselier, and A. Beschin. 2002. Infection stage-dependent modulation of macrophage activation in Trypanosoma congolense-resistant and -susceptible mice. Infect. Immun. 70:6180-6187. [DOI] [PMC free article] [PubMed] [Google Scholar]
- 59.Noyes, H. A., M. H. Alimohammadian, M. Agaba, A. Brass, H. Fuchs, V. Gailus-Durner, H. Hulme, F. Iraqi, S. Kemp, B. Rathkolb, E. Wolf, M. H. de Angelis, D. Roshandel, and J. Naessens. 2009. Mechanisms controlling anaemia in Trypanosoma congolense infected mice. PLoS One 4:e5170. [DOI] [PMC free article] [PubMed] [Google Scholar]
- 60.O'Gorman, G., S. D. Park, E. W. Hill, K. G. Meade, P. M. Coussens, M. Agaba, J. Naessens, S. J. Kemp, and D. E. Machugh. 2009. Transcriptional profiling of cattle infected with Trypanosoma congolense highlights gene expression signatures underlying trypanotolerance and trypanosusceptibility. BMC Genomics 10:207. [DOI] [PMC free article] [PubMed] [Google Scholar]
- 61.O'Gorman, G. M., S. D. Park, E. W. Hill, K. G. Meade, L. C. Mitchell, M. Agaba, J. P. Gibson, O. Hanotte, J. Naessens, S. J. Kemp, and D. E. MacHugh. 2006. Cytokine mRNA profiling of peripheral blood mononuclear cells from trypanotolerant and trypanosusceptible cattle infected with Trypanosoma congolense. Physiol. Genomics 28:53-61. [DOI] [PubMed] [Google Scholar]
- 62.Ohmori, Y., M. F. Smith, Jr., and T. A. Hamilton. 1996. IL-4-induced expression of the IL-1 receptor antagonist gene is mediated by STAT6. J. Immunol. 157:2058-2065. [PubMed] [Google Scholar]
- 63.Ormerod, W. E. 1967. Taxonomy of the sleeping sickness trypanosomes. J. Parasitol. 53:824-830. [PubMed] [Google Scholar]
- 64.Paling, R. W., S. K. Moloo, J. R. Scott, F. A. McOdimba, L. L. Logan-Henfrey, M. Murray, and D. J. Williams. 1991. Susceptibility of N′Dama and Boran cattle to tsetse-transmitted primary and rechallenge infections with a homologous serodeme of Trypanosoma congolense. Parasite Immunol. 13:413-425. [DOI] [PubMed] [Google Scholar]
- 65.Radwanska, M., P. Guirnalda, C. De Trez, B. Ryffel, S. Black, and S. Magez. 2008. Trypanosomiasis-induced B cell apoptosis results in loss of protective anti-parasite antibody responses and abolishment of vaccine-induced memory responses. PLoS Pathog. 4:e1000078. [DOI] [PMC free article] [PubMed] [Google Scholar]
- 66.Raes, G., A. Beschin, G. H. Ghassabeh, and P. De Baetselier. 2007. Alternatively activated macrophages in protozoan infections. Curr. Opin. Immunol. 19:454-459. [DOI] [PubMed] [Google Scholar]
- 67.Raes, G., P. De Baetselier, W. Noël, A. Beschin, F. Brombacher, and G. Hassanzadeh Gh. 2002. Differential expression of FIZZ1 and Ym1 in alternatively versus classically activated macrophages. J. Leukoc. Biol. 71:597-602. [PubMed] [Google Scholar]
- 68.Raes, G., W. Noël, A. Beschin, L. Brys, P. de Baetselier, and G. H. Hassanzadeh. 2002. FIZZ1 and Ym as tools to discriminate between differentially activated macrophages. Dev. Immunol. 9:151-159. [DOI] [PMC free article] [PubMed] [Google Scholar]
- 69.Rifkin, M. R., and F. R. Landsberger. 1990. Trypanosome variant surface glycoprotein transfer to target membranes: a model for the pathogenesis of trypanosomiasis. Proc. Natl. Acad. Sci. U. S. A. 87:801-805. [DOI] [PMC free article] [PubMed] [Google Scholar]
- 70.Saeij, J. P., J. P. Boyle, S. Coller, S. Taylor, L. D. Sibley, E. T. Brooke-Powell, J. W. Ajioka, and J. C. Boothroyd. 2006. Polymorphic secreted kinases are key virulence factors in toxoplasmosis. Science 314:1780-1783. [DOI] [PMC free article] [PubMed] [Google Scholar]
- 71.Schroeder, A., O. Mueller, S. Stocker, R. Salowsky, M. Leiber, M. Gassmann, S. Lightfoot, W. Menzel, M. Granzow, and T. Ragg. 2006. The RIN: an RNA integrity number for assigning integrity values to RNA measurements. BMC Mol. Biol. 7:3. [DOI] [PMC free article] [PubMed] [Google Scholar]
- 72.Sexton, A. C., R. T. Good, D. S. Hansen, M. C. D'Ombrain, L. Buckingham, K. Simpson, and L. Schofield. 2004. Transcriptional profiling reveals suppressed erythropoiesis, up-regulated glycolysis, and interferon-associated responses in murine malaria. J. Infect. Dis. 189:1245-1256. [DOI] [PubMed] [Google Scholar]
- 73.Shaw, A. P. M. 2004. Economics of African trypanosomiasis, p. 369-402. In I. Maudlin, P. H. Holmes, and M. A. Miles (ed.), The trypanosomiases. CABI Publishing, Wallingford, United Kingdom.
- 74.Siegel, S., and N. J. Castellan. 1988. Nonparametric statistics for the behavioural sciences. McGraw Hill, London, United Kingdom.
- 75.Soreq, H., D. Patinkin, E. Lev-Lehman, M. Grifman, D. Ginzberg, F. Eckstein, and H. Zakut. 1994. Antisense oligonucleotide inhibition of acetylcholinesterase gene expression induces progenitor cell expansion and suppresses hematopoietic apoptosis ex vivo. Proc. Natl. Acad. Sci. U. S. A. 91:7907-7911. [DOI] [PMC free article] [PubMed] [Google Scholar]
- 76.Stijlemans, B., M. Guilliams, G. Raes, A. Beschin, S. Magez, and P. De Baetselier. 2007. African trypanosomosis: from immune escape and immunopathology to immune intervention. Vet. Parasitol. 148:3-13. [DOI] [PubMed] [Google Scholar]
- 77.Stijlemans, B., A. Vankrunkelsven, L. Brys, S. Magez, and P. De Baetselier. 2008. Role of iron homeostasis in trypanosomiasis-associated anemia. Immunobiology 213:823-835. [DOI] [PubMed] [Google Scholar]
- 78.Su, C., D. K. Howe, J. P. Dubey, J. W. Ajioka, and L. D. Sibley. 2002. Identification of quantitative trait loci controlling acute virulence in Toxoplasma gondii. Proc. Natl. Acad. Sci. U. S. A. 99:10753-10758. [DOI] [PMC free article] [PubMed] [Google Scholar]
- 79.Taiwo, V. O., and V. O. Anosa. 2000. In vitro erythrophagocytosis by cultured macrophages stimulated with extraneous substances and those isolated from the blood, spleen and bone marrow of Boran and N′Dama cattle infected with Trypanosoma congolense and Trypanosoma vivax. Onderstepoort J. Vet. Res. 67:273-287. [PubMed] [Google Scholar]
- 80.Taylor, S., A. Barragan, C. Su, B. Fux, S. J. Fentress, K. Tang, W. L. Beatty, H. E. Hajj, M. Jerome, M. S. Behnke, M. White, J. C. Wootton, and L. D. Sibley. 2006. A secreted serine-threonine kinase determines virulence in the eukaryotic pathogen Toxoplasma gondii. Science 314:1776-1780. [DOI] [PubMed] [Google Scholar]
- 81.Turner, C. M., N. Aslam, and C. Dye. 1995. Replication, differentiation, growth and the virulence of Trypanosoma brucei infections. Parasitology 111(Pt 3):289-300. [DOI] [PubMed] [Google Scholar]
- 82.Valledor, A. F., L. C. Hsu, S. Ogawa, D. Sawka-Verhelle, M. Karin, and C. K. Glass. 2004. Activation of liver X receptors and retinoid X receptors prevents bacterial-induced macrophage apoptosis. Proc. Natl. Acad. Sci. U. S. A. 101:17813-17818. [DOI] [PMC free article] [PubMed] [Google Scholar]
- 83.Weiss, D. J. 2002. Application of flow cytometric techniques to veterinary clinical hematology. Vet. Clin. Pathol. 31:72-82. [DOI] [PubMed] [Google Scholar]
- 84.Witola, W. H., and C. E. Lovelace. 2001. Demonstration of erythrophagocytosis in Trypanosoma congolense-infected goats. Vet. Parasitol. 96:115-126. [DOI] [PubMed] [Google Scholar]
- 85.World Health Organization. 2006. Human African trypanosomiasis (sleeping sickness): epidemiological update. Wkly. Epidemiol. Rec. 81:71-80. [PubMed] [Google Scholar]
- 86.Zhang-Gandhi, C. X., and P. D. Drew. 2007. Liver X receptor and retinoid X receptor agonists inhibit inflammatory responses of microglia and astrocytes. J. Neuroimmunol. 183:50-59. [DOI] [PMC free article] [PubMed] [Google Scholar]
- 87.Zhu, L., S. B. Kahwash, and L. S. Chang. 1998. Developmental expression of mouse erythrocyte protein 4.2 mRNA: evidence for specific expression in erythroid cells. Blood 91:695-705. [PubMed] [Google Scholar]
Associated Data
This section collects any data citations, data availability statements, or supplementary materials included in this article.