

Abstract
In order to determine the pharmacokinetic disposition of chloroquine (CQ) and its active metabolite, desethylchloroquine (DECQ), when administered as intermittent presumptive treatment in pregnancy (IPTp) for malaria, 30 Papua New Guinean women in the second or third trimester of pregnancy and 30 age-matched nonpregnant women were administered three daily doses of 450 mg CQ (8.5 mg/kg of body weight/day) in addition to a single dose of sulfadoxine-pyrimethamine. For all women, blood was taken at baseline; at 1, 2, 4, 6, 12, 18, 24, 30, 48, and 72 h posttreatment; and at 7, 10, 14, 28, and 42 days posttreatment. Plasma was subsequently assayed for CQ and DECQ by high-performance liquid chromatography, and population pharmacokinetic modeling was performed. Pregnant subjects had significantly lower area under the plasma concentration-time curve for both CQ (35,750 versus 47,892 μg·h/liter, P < 0.001) and DECQ (23,073 versus 41,584 μg·h/liter, P < 0.001), reflecting significant differences in elimination half-lives and in volumes of distribution and clearances relative to bioavailability. Reduced plasma concentrations of both CQ and DECQ could compromise both curative efficacy and posttreatment prophylactic properties in pregnant patients. Higher IPTp CQ doses may be desirable but could increase the risk of adverse hemodynamic effects.
There are few affordable antimalarial drugs that can be used safely in pregnancy. The efficacy of one of these, chloroquine (CQ), has been compromised by the widespread development of Plasmodium falciparum resistance. However, due to a lack of suitable alternatives, CQ is still widely used in pregnant women, either alone or in combination with other drugs such as sulfadoxine-pyrimethamine (SP), while it remains the drug of choice for Plasmodium vivax in most countries (13, 21, 34). Although the physiologic changes of pregnancy can alter drug disposition through increased plasma volume, increased clearance, and altered protein binding (15), there have been only three relatively small published studies of CQ pharmacokinetics, from which only limited conclusions can be drawn (9, 21, 23).
Detailed antimalarial pharmacokinetic studies of pregnant women have been identified as an urgent priority, both for optimization of acute treatment and development of new intervention strategies such as intermittent preventive treatment in pregnancy (IPTp) (29). We have, therefore, assessed CQ disposition in pregnant Papua New Guinean (PNG) women and a matched group of nonpregnant female controls. In order to maximize the clinical relevance of our data, we utilized a long (42-day) sampling period (32), measured simultaneous plasma concentrations of the active metabolite of CQ, desethylchloroquine (DECQ) (6), and incorporated both CQ and DECQ in the development of pharmacokinetic models.
MATERIALS AND METHODS
Study site and sample.
The present study was conducted at Alexishafen Health Centre, Madang Province, between February and July 2006. Eligibility criteria and the characteristics of the 30 pregnant and 30 nonpregnant subjects who were recruited have been detailed elsewhere in a study of SP pharmacokinetics in the same women (18). In brief, subjects were recruited regardless of parasitemia if (i) they had no features of severe malaria (35) or other significant comorbidity, (ii) they had not taken CQ in the previous 14 days, and (iii) informed written consent was obtained. The pregnant patients were first-time antenatal clinic attendees who were beyond first trimester, and the nonpregnant subjects were from the same villages as the pregnant patients. The study was approved by the PNG Institute of Medical Research Institutional Review Board and the Medical Research Advisory Committee of the Department of Health, PNG.
Clinical procedures.
Study procedures were identical for pregnant and nonpregnant subjects (18). A 3-ml venous blood sample was taken for blood film microscopy and baseline tests, including hemoglobin (Hb) and blood glucose (HaemoCue, Angelholm, Sweden), and for providing plasma for subsequent drug assay. In line with PNG standard treatment recommendations (13, 25), all subjects were also given three tablets of CQ (Chloroquin; Astra, Sydney, Australia; 450 mg CQ base) daily for 3 days plus single-dose SP (Fansidar; Roche, Basel, Switzerland; 1,500 mg sulfadoxine and 75 mg pyrimethamine) with the first CQ dose. Drugs were administered as whole tablets swallowed with water under supervision. Subjects were not required to fast. Further blood samples were drawn at 1, 2, 4, 6, 12, 18, 24, 30, 48, and 72 h and then at 7, 10, 14, 28, and 42 days. To enable blood sampling, hemodynamic and other monitoring, and administration of standard adverse event questionnaires, all patients were admitted for at least 48 h and then reviewed as outpatients on days 3, 7, 10, 14, 28, and 42. A thick blood film was taken on each occasion and, in patients with P. falciparum parasitemia at baseline, confirmed by at least two skilled microscopists; efficacy outcomes were assessed according to World Health Organization definitions (33).
Assay methods.
Extraction and chromatographic assay of CQ and DECQ were as described previously (17). In brief, plasma samples were spiked with piperaquine base as an internal standard, alkalinized, and extracted in tert-butyl methyl ether. After centrifugation, the supernatant was back-extracted into HCl, aspirated, and recentrifuged. Aliquots of 25 μl were injected onto a Chromolith Performance column (E. Merck GmbH, Darmstadt, Germany) at 30°C with a mobile phase of acetonitrile in K2HPO4 buffer pumped at 2 ml/min. Retention times were 4.9 min for DECQ and 6.7 min for CQ. Analytes were detected at 340 nm and quantified using Chemstation software (version 9; Agilent Technology, Waldbronn, Germany).
The linear assay range was 2 to 2,000 μg/liter for CQ and 1 to 2,000 μg/liter for DECQ. For CQ at 5, 200, and 2,000 μg/liter, (i) intraday relative standard deviations (RSDs) were 8.4, 8.6, and 2.1% (n = 5), respectively; (ii) interday RSDs were 8.6, 6.8, and 2.7% (n = 15), respectively; and (iii) recovery and accuracy were 95 to 99% and 95 to 100%, respectively. For DECQ at 3, 123, and 1,234 μg/liter, (i) intraday RSDs were 8.9, 9.6, and 1.5%; (ii) interday RSDs were 8.2, 8.3, and 3.5%, respectively; and (iii) recovery and accuracy were 95 to 96% and 98 to 103%, respectively. The limits of quantitation were 2 μg/liter for CQ and 1 μg/liter for DECQ.
Population pharmacokinetic analysis.
Plasma CQ and DECQ concentration-time profiles were analyzed by nonlinear mixed-effect modeling using NONMEM (version 6.2.0; ICON Development Solutions, Ellicott City, MD) and strategies similar to those used for generating SP pharmacokinetic data from the same patients (18). Initial attempts to model plasma CQ and DECQ concentrations together using single compartments and first-order CQ absorption were confounded by nonconvergence. One-, two-, and three-compartment models were then applied to the plasma CQ data set, all with first-order absorption with or without a lag time, and central and peripheral DECQ compartments were added sequentially. Since CQ metabolic clearance to DECQ (CLM) accounts for 15.2% of total clearance (CLCQ) (11), the ratio CLM/CLCQ was fixed at 15.2/84.8 to facilitate model identifiability. Volume (V) and clearance terms (CL) were scaled allometrically (i.e., as a function of body weight [WT]) using ×(WT/70)1.0 and ×(WT/70)0.75, respectively (4), and expressed relative to bioavailability (F). Between-subject variability (BSV) was also assessed for model parameters such as V and CL. Between-occasion variability (BOV) related to F was tested for the second and third doses versus the first dose (16).
The influence of age, pregnancy, fundal height/gestational age, Hb, parasitemia, and blood glucose on model parameters was investigated using a stepwise, forwards and backwards covariate building process. Model performance was assessed using the objective function value (OFV) and the distribution of weighted residuals versus time after dose (WRES). Model validation used a bootstrap procedure involving 1,000 new data sets and a stratified visual predictive check (VPC) (18). The resulting 80% prediction intervals (PI) for CQ and DECQ were plotted with the observed data and their 10th, 50th, and 90th percentiles.
Pharmacokinetic simulations.
The effect of different CQ dose regimens on plasma drug and metabolite concentration profiles was assessed by using the mvtnorm package in R (the R Foundation for Statistical Computing, http://www.r-project.org/foundation/) to generate a hypothetical range of both pregnant and nonpregnant women (n = 1,000 each) with covariate characteristics (e.g., WT) based on those of the original subjects. The parameters from the final pharmacokinetic model and NONMEM were then used to determine maximum plasma concentration (Cmax), time of the maximum plasma concentration after dose (Tmax), and area under the plasma concentration-time curve (AUC0-∞) for both CQ and DECQ for a range of plausible CQ regimens in the simulated samples.
Statistical analysis.
Sample size calculations assumed that (i) a 30% difference in the magnitude of a pharmacokinetic parameter between pregnant and nonpregnant groups is clinically important, (ii) V/F and/or CL/F increases with pregnancy, and (iii) the disposition of CQ in nonpregnant females would be that in a previous study of nonpregnant adults (14). At an α of 0.05 and β of 0.1, up to 21 subjects/group were required depending on the pharmacokinetic parameter. A sample size of 30/group was chosen to allow for a 15% attrition rate. Student's t test or the Mann-Whitney U test for nonnormally distributed data was used for two-sample comparisons, and categorical data were compared using the chi-squared or Fisher's exact test. A two-tailed level of significance (P < 0.05) was used.
RESULTS
Patient characteristics.
Most of the pregnant women (77%) were in the second trimester, and the remainder were in the third, while the majority of nonpregnant controls were nulliparous. The two groups were well matched for age (mean ± standard deviation [SD] 26.0 ± 5.9 versus 25.5 ± 8.9 years for pregnant versus nonpregnant subjects), weight (54.0 ± 6.4 versus 51.8 ± 5.5 kg), and height (151 ± 5 versus 149 ± 5 cm; P > 0.17 in each case), but there were significant differences in baseline supine pulse rate (88 ± 12 versus 75 ± 9 beats/min), Hb (80 ± 13 versus 107 ± 19 g/liter), and blood glucose (4.8 ± 2.0 versus 5.8 ± 1.5 mmol/liter; P ≤ 0.02). Although 57% and 30% of pregnant and nonpregnant subjects, respectively, had detectable parasitemia (P. falciparum in most cases), no subject had an axillary temperature of >37.5°C.
Antimalarial efficacy.
Of the subjects with P. falciparum at entry, 5 of 13 pregnant women and 2 of 7 nonpregnant women redeveloped parasitemia over the 28-day monitoring period (a 65% overall uncorrected adequate clinical and parasitologic response), while the 4 subjects with P. vivax and 2 with Plasmodium malariae did not redevelop parasitemia.
Safety and tolerability.
No significant adverse events were reported, and side effect profiles did not differ between the two groups. There were falls in supine pulse rate and blood pressure during the first 72 h in both groups, but these were minor, and there were no significant differences by pregnancy status. There were also no between-group differences in the frequency of postural hypotension (a >20-mm-Hg systolic or >10-mm-Hg diastolic fall in blood pressure after 2 min of standing), Hb, or blood glucose during follow-up (data not shown). Only one subject, a pregnant woman, became hypoglycemic, with blood glucose concentrations of 3.1, 2.7, and 2.2 mmol/liter on days 1, 2, and 3, respectively, but she remained asymptomatic and responded to oral glucose replacement.
Pharmacokinetic modeling.
Median plasma concentrations of CQ and DECQ are shown in Fig. 1. Concentrations of both compounds were significantly higher in nonpregnant subjects than in pregnant subjects throughout. The mean AUC0-∞ values for the pregnant group were 25% lower for CQ and 45% lower for DECQ than those for nonpregnant women (see below).
FIG. 1.
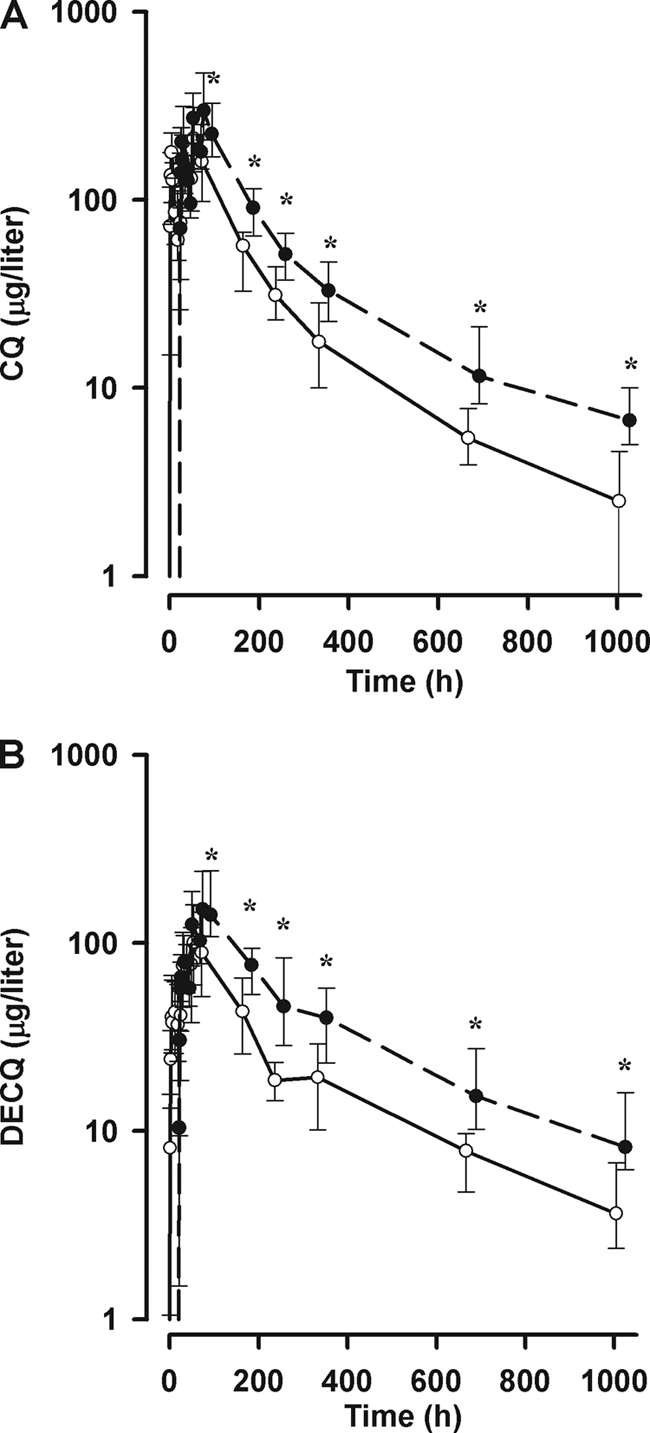
CQ (A) and DECQ (B) concentrations in pregnant (solid line) and nonpregnant (dashed line) groups. Data are medians and interquartile ranges. Significant differences (P < 0.001) between pregnant and nonpregnant subjects at individual time points are indicated by asterisks.
Although the 3-compartment model for CQ had a lower OFV than either the 1- or 2-compartment model, the WRES distribution was not improved and the additional parameters were ill defined. We therefore selected a 2-compartment model for CQ. Adding a lag time did not further decrease OFV. When a single compartment for DECQ was added, the DECQ WRES plots showed significant positive bias at later sampling times. A peripheral DECQ compartment was, therefore, added, and OFV decreased significantly, with acceptable WRES plots. The addition of BOV related to FCQ for doses 2 and 3 produced a further significant decrease in OFV. The final model structure with parameter definitions is shown in Fig. 2. Only pregnancy related to CLCQ (23% of total CL/FCQ) and CLDECQ (36% of total CL/FDECQ) and Hb related to VC CQ (5% of total VC/FCQ; increase in VC/FCQ with decrease in Hb) resulted in significant improvements in the fit. For both the base and final models, BSV was estimable for CLCQ, VC CQ, CLDECQ, and VC DECQ, while for random unexplained variability (RUV) a proportional model was found to be optimal for both CQ and DECQ.
FIG. 2.

Structural model used in the final pharmacokinetic analysis. ka, first-order absorption rate constant; VC/FCQ, central compartment volume of distribution for CQ; VP/FCQ, peripheral compartment volume of distribution for CQ, Q/FCQ, intercompartment clearance for CQ, CL/FCQ, clearance of CQ; CLM/FCQ, metabolic clearance for CQ to DECQ (fixed ratio CLM/CLCQ = 15.2/84.8; see Materials and Methods), VC/FDECQ, central volume of distribution for DECQ; VP/FDECQ, peripheral volume of distribution for DECQ; Q/FDECQ, intercompartment clearance for DECQ; CL/FDECQ, clearance of DECQ.
The OFVs, pharmacokinetic parameters, and BOV, BSV, and RUV terms for both the base and final models are summarized in Table 1, and secondary pharmacokinetic parameters are summarized in Table 2. Bootstrap results are also shown in Table 1 and demonstrate robust fixed and random parameter estimates for the final model, with biases of <2% and <5%, respectively. Plots of observed versus population-predicted and individual-predicted concentrations for both CQ and DECQ showed acceptable linearity, and the WRES versus time postdose plots for both CQ and DECQ showed no evidence of time-related deviation (data not shown). VPC plots of actual drug concentrations and their 10th, 50th, and 90th percentiles versus time, as well as the 10th, 50th, and 90th percentile boundaries (80% PI) from 1,000 simulations stratified according to pregnancy status are shown in Fig. 3A and B, respectively, for CQ and Fig. 3C and D, respectively, for DECQ. VPC plots stratified for Hb also showed similar agreement between simulated and observed data (data not shown).
TABLE 1.
Model building, parameters, and bootstrap runs for CQ and DECQ disposition
| Parametera | Value from: |
||
|---|---|---|---|
| Base model | Final covariate model | Bootstrap replicates (n = 1,000) (median [95% empirical CIe]) | |
| OFV | 13,497 | 13,462 | 13,442 [12,915-13,840] |
| Pharmacokinetic parametersb | |||
| ka (h−1) | 1.4 [17] | 1.4 [18] | 1.4 [1.0-2.0] |
| CLCQ/F (liters/h) | 34.1 [7] | 29.3 [6] | 29.4 [25.9-32.7] |
| Pregnancy on CLCQ/F (liters/h) | 8.7 [23] | 8.7 [4.7-13.2] | |
| VC CQ/F (liters) | 4,160 [7] | 4,220 [6] | 4,220 [3,727-4,713] |
| Hemoglobin on VC CQ/F (liters/Hb unit) | 221 [32] | 221 [77-347] | |
| QCQ/F (liters/h) | 20 [14] | 20 [13] | 20.1 [16.1-26.2] |
| VP CQ/F (liters) | 5,200 [10] | 5,190 [10] | 5,240 [4,380-6,460] |
| CLDECQ/F (liters/h) | 9.2 [9] | 7.0 [7] | 7.0 [6.1-8.0] |
| Pregnancy on CLDECQ/F (liters/h) | 4.0 [16] | 4.0 [2.6-5.5] | |
| VC DECQ/F (liters) | 39.9 [10] | 40.0 [10] | 40.2 [33.0-47.7] |
| QDECQ/F (liters/h) | 3.6 [11] | 3.6 [10] | 3.6 [3.03-4.4] |
| VP DECQ/F (liters) | 812 [17] | 840 [17] | 838 [610-1,130] |
| Random parameters (BSV and BOV)c | |||
| BSV CLCQ | 33.5 [24] | 28.5 [24] | 27.8 [21.1-34.4] |
| BSV VC CQ | 44.7 [20] | 40.1 [22] | 39.2 [30.6-48.3] |
| BSV CL DECQ | 48.6 [19] | 38.7 [20] | 38.1 [30.5-45.6] |
| BSV VC DECQ | 86.7 [25] | 87.9 [26] | 86.3 [64.4-108.6] |
| BOV FCQ | 62.4 [22] | 61.9 [22] | 61.8 [49.4-77.1] |
| Correlations between BSV pairs | |||
| R (CLC CQ, VC CQ) | 0.69 [24] | 0.63 [27] | 0.64 [0.44-0.79] |
| R (CLC CQ, CLC DECQ) | 0.86 [24] | 0.81 [26] | 0.82 [0.61-0.93] |
| R (CLC DECQ, VC CQ) | 0.86 [20] | 0.88 [20] | 0.90 [0.80-0.98] |
| RUVd | |||
| Proportional error in CQ | 40.6 [8] | 40.6 [8] | 40.5 [37.4-43.5] |
| Proportional error in DECQ | 39.7 [7] | 39.7 [7] | 39.6 [37.1-42.2] |
ka, absorption rate constant; VC CQ/F, central compartment volume of distribution for CQ; VP CQ/F, peripheral compartment volume of distribution for CQ; QCQ/F, intercompartment clearance for CQ; CLCQ/F, clearance of CQ; CLM/F, metabolic clearance for CQ to DECQ; VC DECQ/F, central volume of distribution for DECQ; VP DECQ/F, peripheral volume of distribution for DECQ; QDECQ/F, intercompartment clearance for DECQ; CLDECQ/F, clearance of DECQ.
Values for the base and covariate models are estimates, with relative standard errors (RSE; %) in brackets.
Values for the base and covariate models are coefficients of variation (CV; %), with RSE (%) in brackets.
Values for the base and covariate models are CV (%), with RSE (%) in brackets.
CI, confidence interval.
TABLE 2.
Post hoc Bayesian predicted pharmacokinetic parameters derived for CQ and DECQ for nonpregnant and pregnant women
| Parametera | Valueb for: |
P | |
|---|---|---|---|
| Nonpregnant women (n = 30) | Pregnant women (n = 30) | ||
| t1/2abs CQ (h) | 0.492 | 0.492 | NAc |
| CL/FCQ (liters/h) | 23.9 [21.3-26.3] | 32.0 [28.8-36.5] | <0.001 |
| VC/FCQ (liters) | 2,702 [2,230-3,535] | 3,406 [2,819-4,919] | 0.007 |
| VP/FCQ (liters) | 3,781 [3,503-4,106] | 4,041 [3,707-4,254] | NS |
| VSS/FCQ (liters) | 6,707 [5,843-7,158] | 7,147 [6,721-9,638] | 0.009 |
| t1/2α CQ (h) | 38.6 [31.8-44.5] | 42.1 [35.4-47.6] | NSd |
| t1/2β CQ (h) | 291 [272-313] | 266 [244-280] | <0.001 |
| AUC0-∞ CQ (mg·h/liter) | 47,892 [43,486-53,746] | 35,750 [31,343-39,729] | <0.001 |
| CLM/FCQ (liters/h) | 4.29 [3.82-4.72] | 5.74 [5.17-6.55] | <0.001 |
| CL/FDECQ (liters/h) | 4.9 [4.3-6.4] | 8.9 [7.2-11.8] | <0.001 |
| VC/FDECQ (liters) | 23.1 [15.7-43.1] | 32.2 [24.1-50.1] | NS |
| VP/FDECQ (liters) | 612 [567-665] | 654 [600-689] | NS |
| VSS/FDECQ (s) | 653 [606-701] | 684 [624-731] | NS |
| t1/2α DECQ (h) | 2.03 [1.22-3.61] | 2.08 [1.20-2.97] | NS |
| t1/2β DECQ (h) | 234 [221-259] | 199 [190-212] | <0.001 |
| AUC0-∞ DECQ (mg·h/liter) | 41,584 [31,836-47,629] | 23,073 [17,444-28,380] | <0.001 |
Abbreviations are as defined for Table 1 plus the following: AUC0-∞, area under the plasma concentration-time curve from time zero to infinity; t1/2abs, absorption half-life; t1/2α, distribution half-life; t1/2β, elimination half-life; VSS/F, steady-state volume of distribution relative to bioavailability (VSS/F; given by the formula VC/F + VP/F).
Data are medians, with interquartile ranges in brackets.
NA, not applicable.
NS, not significant.
FIG. 3.

Visual predicted check plots showing simulated 10th (short dashed line), 50th (long dashed line), and 90th (solid line) percentile concentrations and observed concentration (log scale) data (○) versus time (log scale) for CQ (panel A, nonpregnant; panel B, pregnant) and DECQ (panel C, nonpregnant; panel D, pregnant). The 10th (×), 50th (•), and 90th (▪) percentiles for the observed data are also shown.
Simulated data are shown in Table 3. For the conventional CQ regimen, there were lower median Cmax values for both CQ and DECQ in pregnant women (79% and 75%, respectively, of values for nonpregnant women), which occurred at a Tmax between 3 and 9 h after the last of the three doses. AUC0-∞ values were also lower. An increase in the dose of CQ to 4 tablets daily for 3 days in pregnancy raised the median AUC0-∞ of CQ to a value close to that in the simulated nonpregnant subjects, but the 5-tablet regimen was required to raise the median AUC0-∞ for DECQ to the same extent.
TABLE 3.
Median Cmax and AUC0-∞ values for CQ and DECQ after different CQ dose regimens for 1,000 nonpregnant and 1,000 pregnant hypothetical subjectsa
| Group (no. of tablets × no. of daily doses) | CQ |
DECQ |
||
|---|---|---|---|---|
| Cmax (μg/liter) | AUC0-∞ (μg·h/liter) | Cmax (μg/liter) | AUC0-g∞ (μg·h/liter) | |
| Nonpregnant (3 × 3) | 376 | 50,028 | 186 | 41,255 |
| Pregnant (3 × 3) | 296 (79) | 35,659 (71) | 139 (75) | 23,876 (58) |
| Pregnant (4 × 3) | 395 (105) | 47,545 (95) | 185 (100) | 31,835 (77) |
| Pregnant (5 × 3) | 494 (131) | 59,431 (119) | 232 (125) | 39,793 (96) |
The numbers in parentheses represent the simulated medians for pregnant subjects expressed as percentages of that for the standard dose of 3 tablets (450 mg CQ base) in 3 daily doses for nonpregnant subjects.
DISCUSSION
In the present study, the first to have evaluated CQ pharmacokinetics using nonlinear mixed-effect modeling with incorporation of DECQ disposition, we found that pregnancy had a significant effect on CQ and DECQ disposition after conventional doses of CQ. Both the parent drug and metabolite were present in measurable concentrations for the full 42 days of follow-up in the two groups, but plasma concentrations were significantly lower in the pregnant subjects. This suggests that higher doses could be given in pregnancy although potential adverse pharmacodynamic effects, including hypotension, would need to be considered in the development of pregnancy-specific dosing recommendations.
The CQ pharmacokinetic parameters derived for our nonpregnant women were consistent with those in previous studies of children and adults. All have shown large volumes of distribution (3,500 to 53,000 liters) (2, 12, 20, 31), consistent with the median steady-state volume of distribution (VSS/F) of 6,707 liters in our nonpregnant group. The multiexponential elimination observed in previous studies was also evident (Fig. 1), suggesting that the beta phase elimination half-life (t1/2β) estimation depends on the duration of sampling and assay sensitivity (27). The present median t1/2β of 12.1 days in nonpregnant women is consistent with values of 5.8 to 20.0 days generated from studies using similar assay methodology and sampling duration (1, 2, 8, 10, 14, 24, 28, 30), while our median CLCQ/F (23.9 liters/h) was also consistent with previous reports (7.9 to 66 liters/h) (1, 2, 8, 10, 14, 24, 28, 30). Few previous studies have reported detailed pharmacokinetic data for DECQ. All have been limited to noncompartmental analyses, and none have reported values of V or systemic CL. However, the median t1/2β of 9.8 days in our nonpregnant women is within the published range (7.8 to 12.1 days) for studies employing a sampling duration of between 28 and 52 days (8, 14, 17, 24).
Pregnancy was associated with a lower median AUCs for both CQ and DECQ, with reductions of 25% and 45%, respectively, relative to those for nonpregnant subjects. Consistent with the physiologic changes of pregnancy (15), there were contributions to this change from both VSS CQ/F (7% increase) and t1/2β CQ (9% decrease), and more significantly from CLM CQ/F (34% increase). There was also an 80% increase in CLDECQ/F in the pregnant subjects but no significant change in VSS DECQ/F. There was a modest 15% decrease in t1/2β DECQ. While we cannot rule out a contribution of pregnancy-associated changes in bioavailability to differences in key pharmacokinetic parameters, the similarity of the plasma concentration-time profiles in the two groups of subjects after dosing during the first 3 days of treatment and group-specific estimates of the absorption rate constant (ka) suggest that F is not altered significantly by pregnancy. Indeed, there has been no evidence that pregnancy alters bioavailability in studies of a range of other drugs (5).
To enable simultaneous modeling of CQ and DECQ data sets, we fixed the metabolic conversion ratio using published data (11). A limitation of this approach is that BSV contained in CLM/F cannot be assessed, but it becomes a component of the BSV for VC DECQ/F, which was large (87.9%). The finding that VC CQ/F decreased with increasing Hb is consistent with the concentration of CQ in erythrocytes, which contain 70 to 85% of the whole-blood concentration (3, 7). The inclusion BOV related to F for CQ improved the model description significantly. Although proportional error in both data sets was high (around 40%), we do not believe that this resulted from model misspecification or assay imprecision. It may reflect minor hemolysis in the plasma samples, with variability in observed-versus-expected and WRES plots for both CQ and DECQ. Nevertheless, the combined pharmacokinetic model gave a robust description of the primary data, as indicated by the goodness-of-fit plots, including the visual predictive checks, and the results of the bootstrap procedure.
Of the three small previously published studies of CQ disposition in pregnancy (9, 21, 23), two employed a limited sampling schedule that precluded estimation of most pharmacokinetic parameters (9, 23). In one of these (23), there was a modest 18% increase in clearance between the 26th and 36th weeks of gestation in women receiving weekly CQ prophylaxis, a finding consistent with observations indicating that major pregnancy-related physiologic changes become established early in gestation (15). In the second study (9), which involved only 5 pregnant and 5 nonpregnant women sampled over 48 h after a single CQ dose, there were markedly higher DECQ concentrations in the pregnant group. The DECQ/CQ AUC ratios were 13.6-fold higher during pregnancy, raising fears of potential toxicity. However this result is at odds with the results of subsequent studies which found ratios of 0.91 (21) and 0.86 (present study) at 3 days.
Lee et al. evaluated the pharmacokinetics of CQ and DECQ in 12 pregnant and 15 nonpregnant Karen women with P. vivax malaria over 42 days following 3 days of treatment with 25 mg/kg of body weight CQ base (21). Although the study was restricted to a noncompartmental analysis, there were, in contrast to the present study, no significant differences in any pharmacokinetic parameter, including t1/2β, CL/F, and AUC0-∞, between pregnant and nonpregnant groups. The subjects were comparable to those in the present study with regard to age, gestational age, parity, and CQ dose, but they were febrile and had a higher mean Hb and a lower mean body weight. In addition, the nonpregnant subjects were older than the pregnant patients (median age, 29 versus 21 years) (21). Although acute malaria infection does not alter the disposition of CQ (10), the other between-study differences in patient characteristics could help to explain the discrepant pharmacokinetic findings. The use of a whole-blood rather than a plasma CQ assay in the presence of higher Hb concentrations and the relatively small sample size might also confound direct comparison with the present study. Interestingly, the authors found that a more advanced gestational age was associated with a lower AUC0-∞ in univariate analysis (21).
Even though dosing regimens similar to those of the present study were used, the CL estimates derived by Lee et al. (21) were 3-fold lower regardless of pregnancy status. This could reflect the use of whole-blood rather than plasma samples and/or differences in CQ metabolism in the two populations. Indeed, the DECQ/CQ AUC0-14 ratios calculated by the authors (0.26 and 0.28 for pregnant and nonpregnant women, respectively) (21) were substantially lower than the 0.48 to 0.87 ratios found by other groups (8, 17, 24) and ourselves for AUCs up to 42 days. Similarly, studies in various ethnogeographic settings have found values of CLCQ/F (31 to 57 liters/h) (1, 10, 12, 14, 28, 30) that accord with our estimates for pregnant and nonpregnant women (23.9 and 32.0 liters/h, respectively) but not with those reported by Lee et al. (10 and 9 liters/h) (21). CQ is a substrate for CYP2D6, CYP2C8, and CYP3A4 (19, 26). The population in Madang Province display either extensive-metabolizer (49%) or ultrarapid-metabolizer (15%) genotypes (N. von Ahsen et al., unpublished data), consistent with relatively rapid CQ clearance and a higher DECQ/CQ AUC ratio. It is possible that the Karen have different CYP2D6 genotypes. Nevertheless, because DECQ has antimalarial activity that may be equivalent or even greater than that of the parent compound (6), the clinical implications of these differences are uncertain.
Our data suggest that an increased CQ dose may be required in pregnancy to match the efficacy achieved in nonpregnant subjects. Since the effects of pregnancy are predominantly on CL/F rather than V/F, the most pronounced pregnancy-related differences in plasma CQ and DECQ concentrations were at the later time points, which are considered important for the effectiveness of IPTp strategies (32). Consistent with this observation, our simulations show a disproportionate increase in Cmax relative to AUC0-∞ for both CQ and DECQ with CQ doses above those currently recommended. Our data obtained using conventional doses suggest that pregnancy-related reductions in peripheral vascular resistance do not have major clinical implications. However, the possibility of side effects at higher plasma concentrations needs to be considered. Systolic hypotension accompanies transiently high serum CQ concentrations ranging from 784 to 6,649 μg/liter after intravenous administration in healthy males (22). Although the Cmaxs after the higher-dose regimens in Table 3 are below this range, the physiologic changes of pregnancy and malaria-associated anemia may mean that symptomatic blood pressure changes nevertheless occur.
Because of the theoretical risk of such hemodynamic changes, we recommend that the CQ dose for pregnant women should be 4 tablets of 150 mg (or 8.3 mg CQ base/kg in a typical 54-kg woman) taken each day for 3 days. This regimen would increase the AUCs for CQ and DECQ to 95% and 77% of the respective values in nonpregnant subjects without a significant increase in median Cmax. A CQ regimen of 5 tablets daily for 3 days would increase the median Cmax for CQ toward levels associated with adverse cardiovascular effects. Further safety and pharmacokinetic studies are needed to confirm our recommendations, but the risks to mother and fetus of inadequate dosing should not be underestimated, especially where CQ is used in an area of emerging malaria parasite resistance such as PNG.
Acknowledgments
We are most grateful to Valsi Kurian and the staff of Alexishafen Health Centre for their kind cooperation during the study. We also thank Jovitha Lammey, Maria Goretti, Wesley Sikuma, Donald Paiva, and Bernard (Ben) Maamu for clinical and/or logistic assistance.
The authors note with regret that Servina Gomorrai passed away after the manuscript had been submitted.
The study was funded by the National Health and Medical Research Council of Australia (grant 458555). T.M.E.D. is supported by a National Health and Medical Research Council of Australia Practitioner Fellowship.
Footnotes
Published ahead of print on 19 January 2010.
REFERENCES
- 1.Aderounmu, A. F., L. A. Salako, B. Lindstrom, O. Walker, and L. Ekman. 1986. Comparison of the pharmacokinetics of chloroquine after single intravenous and intramuscular administration in healthy Africans. Br. J. Clin. Pharmacol. 22:559-564. [DOI] [PMC free article] [PubMed] [Google Scholar]
- 2.Adjepon-Yamoah, K. K., D. Ofori-Adjei, N. M. Woolhouse, and B. Lindstrom. 1986. Whole-blood single-dose kinetics of chloroquine and desethylchloroquine in Africans. Ther. Drug Monit. 8:195-199. [DOI] [PubMed] [Google Scholar]
- 3.Ajayi, F. O., L. A. Salako, and J. O. Kuye. 1989. Comparison of the partitioning in vitro of chloroquine and its desethyl metabolites between the erythrocytes and plasma of healthy subjects and those with falciparum malaria. Afr. J. Med. Med. Sci. 18:95-100. [PubMed] [Google Scholar]
- 4.Anderson, B. J., and N. H. Holford. 2008. Mechanism-based concepts of size and maturity in pharmacokinetics. Annu. Rev. Pharmacol. Toxicol. 48:303-332. [DOI] [PubMed] [Google Scholar]
- 5.Anderson, G. D. 2006. Using pharmacokinetics to predict the effects of pregnancy and maternal-infant transfer of drugs during lactation. Expert Opin. Drug Metab. Toxicol. 2:947-960. [DOI] [PubMed] [Google Scholar]
- 6.Basco, L. K., and P. Ringwald. 2003. In vitro activities of piperaquine and other 4-aminoquinolines against clinical isolates of Plasmodium falciparum in Cameroon. Antimicrob. Agents Chemother. 47:1391-1394. [DOI] [PMC free article] [PubMed] [Google Scholar]
- 7.Bergqvist, Y., and B. Domeij-Nyberg. 1983. Distribution of chloroquine and its metabolite desethyl-chloroquine in human blood cells and its implication for the quantitative determination of these compounds in serum and plasma. J. Chromatogr. 272:137-148. [DOI] [PubMed] [Google Scholar]
- 8.Bustos, D. G., J. E. Lazaro, F. Gay, A. Pottier, C. J. Laracas, B. Traore, and B. Diquet. 2002. Pharmacokinetics of sequential and simultaneous treatment with the combination chloroquine and sulfadoxine-pyrimethamine in acute uncomplicated Plasmodium falciparum malaria in the Philippines. Trop. Med. Int. Health 7:584-591. [DOI] [PubMed] [Google Scholar]
- 9.Chukwuani, M. C., O. O. Bolaji, C. O. Onyeji, O. N. Makinde, and F. A. Ogunbona. 2004. Evidence for increased metabolism of chloroquine during the early third trimester of human pregnancy. Trop. Med. Int. Health 9:601-605. [DOI] [PubMed] [Google Scholar]
- 10.Edwards, G., S. Looareesuwan, A. J. Davies, Y. Wattanagoon, R. E. Phillips, and D. A. Warrell. 1988. Pharmacokinetics of chloroquine in Thais: plasma and red-cell concentrations following an intravenous infusion to healthy subjects and patients with Plasmodium vivax malaria. Br. J. Clin. Pharmacol. 25:477-485. [DOI] [PMC free article] [PubMed] [Google Scholar]
- 11.Ette, E. I., E. E. Essien, W. O. Thomas, and E. A. Brown-Awala. 1989. Pharmacokinetics of chloroquine and some of its metabolites in healthy volunteers: a single dose study. J. Clin. Pharmacol. 29:457-462. [DOI] [PubMed] [Google Scholar]
- 12.Frisk-Holmberg, M., Y. Bergqvist, E. Termond, and B. Domeij-Nyberg. 1984. The single dose kinetics of chloroquine and its major metabolite desethylchloroquine in healthy subjects. Eur. J. Clin. Pharmacol. 26:521-530. [DOI] [PubMed] [Google Scholar]
- 13.Gerhardy, C. L., and M. Garrett. 2002. Obstetrics and gynaecology for nurses and midwives, 5th ed. Lutheran School of Nursing, Madang, Papua New Guinea.
- 14.Gustafsson, L. L., O. Walker, G. Alvan, B. Beermann, F. Estevez, L. Gleisner, B. Lindstrom, and F. Sjoqvist. 1983. Disposition of chloroquine in man after single intravenous and oral doses. Br. J. Clin. Pharmacol. 15:471-479. [DOI] [PMC free article] [PubMed] [Google Scholar]
- 15.Hodge, L. S., and T. S. Tracy. 2007. Alterations in drug disposition during pregnancy: implications for drug therapy. Expert Opin. Drug Metab. Toxicol. 3:557-571. [DOI] [PubMed] [Google Scholar]
- 16.Karlsson, M. O., and L. B. Sheiner. 1993. The importance of modeling interoccasion variability in population pharmacokinetic analyses. J. Pharmacokinet. Biopharm. 21:735-750. [DOI] [PubMed] [Google Scholar]
- 17.Karunajeewa, H. A., K. F. Ilett, I. Mueller, P. Siba, I. Law, M. Page-Sharp, E. Lin, J. Lammey, K. T. Batty, and T. M. Davis. 2008. Pharmacokinetics and efficacy of piperaquine and chloroquine in Melanesian children with uncomplicated malaria. Antimicrob. Agents Chemother. 52:237-243. [DOI] [PMC free article] [PubMed] [Google Scholar]
- 18.Karunajeewa, H. A., S. Salman, I. Mueller, F. Baiwog, S. Gomorrai, I. Law, M. Page-Sharp, S. Rogerson, P. Siba, K. F. Ilett, and T. M. Davis. 2009. The pharmacokinetic properties of sulfadoxine-pyrimethamine in pregnancy. Antimicrob. Agents Chemother. 53:4368-4376. [DOI] [PMC free article] [PubMed] [Google Scholar]
- 19.Kim, K. A., J. Y. Park, J. S. Lee, and S. Lim. 2003. Cytochrome P450 2C8 and CYP3A4/5 are involved in chloroquine metabolism in human liver microsomes. Arch. Pharm. Res. 26:631-637. [DOI] [PubMed] [Google Scholar]
- 20.Krishna, S., and N. J. White. 1996. Pharmacokinetics of quinine, chloroquine and amodiaquine. Clinical implications. Clin. Pharmacokinet. 30:263-299. [DOI] [PubMed] [Google Scholar]
- 21.Lee, S. J., R. McGready, C. Fernandez, K. Stepniewska, M. K. Paw, S. J. Viladpai-Nguen, K. L. Thwai, L. Villegas, P. Singhasivanon, B. M. Greenwood, N. J. White, and F. Nosten. 2008. Chloroquine pharmacokinetics in pregnant and nonpregnant women with vivax malaria. Eur. J. Clin. Pharmacol. 74:987-992. [DOI] [PubMed] [Google Scholar]
- 22.Looareesuwan, S., N. J. White, P. Chanthavanich, G. Edwards, D. D. Nicholl, C. Bunch, and D. A. Warrell. 1986. Cardiovascular toxicity and distribution kinetics of intravenous chloroquine. Br. J. Clin. Pharmacol. 22:31-36. [DOI] [PMC free article] [PubMed] [Google Scholar]
- 23.Massele, A. Y., C. Kilewo, Y. Aden Abdi, G. Tomson, V. K. Diwan, O. Ericsson, G. Rimoy, and L. L. Gustafsson. 1997. Chloroquine blood concentrations and malaria prophylaxis in Tanzanian women during the second and third trimesters of pregnancy. Eur. J. Clin. Pharmacol. 52:299-305. [DOI] [PubMed] [Google Scholar]
- 24.Na-Bangchang, K., L. Limpaibul, A. Thanavibul, P. Tan-Ariya, and J. Karbwang. 1994. The pharmacokinetics of chloroquine in healthy Thai subjects and patients with Plasmodium vivax malaria. Br. J. Clin. Pharmacol. 38:278-281. [DOI] [PMC free article] [PubMed] [Google Scholar]
- 25.Papua New Guinea Department of Health. 2000. Standard treatment of common illnesses of children in Papua New Guinea, 7th ed. Government of Papua New Guinea, Port Moresby, Papua New Guinea.
- 26.Projean, D., B. Baune, R. Farinotti, J. P. Flinois, P. Beaune, A. M. Taburet, and J. Ducharme. 2003. In vitro metabolism of chloroquine: identification of CYP2C8, CYP3A4, and CYP2D6 as the main isoforms catalyzing N-desethylchloroquine formation. Drug Metab. Dispos. 31:748-754. [DOI] [PubMed] [Google Scholar]
- 27.Tett, S. E., and D. J. Cutler. 1987. Apparent dose-dependence of chloroquine pharmacokinetics due to limited assay sensitivity and short sampling times. Eur. J. Clin. Pharmacol. 31:729-731. [DOI] [PubMed] [Google Scholar]
- 28.Walker, O., L. A. Salako, G. Alvan, O. Ericsson, and F. Sjoqvist. 1987. The disposition of chloroquine in healthy Nigerians after single intravenous and oral doses. Br. J. Clin. Pharmacol. 23:295-301. [DOI] [PMC free article] [PubMed] [Google Scholar]
- 29.Ward, S. A., E. J. Sevene, I. M. Hastings, F. Nosten, and R. McGready. 2007. Antimalarial drugs and pregnancy: safety, pharmacokinetics, and pharmacovigilance. Lancet Infect. Dis. 7:136-144. [DOI] [PubMed] [Google Scholar]
- 30.Wetsteyn, J. C., P. J. De Vries, B. Oosterhuis, and C. J. Van Boxtel. 1995. The pharmacokinetics of three multiple dose regimens of chloroquine: implications for malaria chemoprophylaxis. Br. J. Clin. Pharmacol. 39:696-699. [DOI] [PMC free article] [PubMed] [Google Scholar]
- 31.White, N. J. 1985. Clinical pharmacokinetics of antimalarial drugs. Clin. Pharmacokinet. 10:187-215. [DOI] [PubMed] [Google Scholar]
- 32.White, N. J. 2005. Intermittent presumptive treatment for malaria. PLoS Med. 2:e3. [DOI] [PMC free article] [PubMed] [Google Scholar]
- 33.World Health Organization. 2003. Assessment and monitoring of antimalarial drugs for the treatment of acute uncomplicated falciparum malaria. WHO/HTM/RBM/2003.50. World Health Organization, Geneva, Switzerland.
- 34.World Health Organization. 2006. Guidelines for the treatment of malaria. WHO/HTM/MAL/2006.1108. World Health Organization, Geneva, Switzerland.
- 35.World Health Organization. 2000. Severe falciparum malaria. Trans. R. Soc. Trop. Med. Hyg. 94(Suppl. 1):S1-S90. [PubMed] [Google Scholar]