

Abstract
The ability to recognize and accurately interpret facial expressions are critical social cognition skills in primates, yet very few studies have examined how primates discriminate these social signals and which features are the most salient. Four experiments examined chimpanzee facial expression processing using a set of standardized, prototypical stimuli created using the new ChimpFACS coding system. First, chimpanzees were found to accurately discriminate between these expressions using a computerized matching-to-sample task, and recognition was impaired for all but one expression category when they were inverted. Third, a multidimensional scaling analysis examined the perceived dissimilarity among these facial expressions revealing 2 main dimensions, the degree of mouth closure and extent of lip-puckering and retraction. Finally, subjects were asked to match each facial expression category using only individual component features. For each expression category, at least 1 component movement was more salient or representative of that expression than the others. However, these were not necessarily the only movements implicated in subject's overall pattern of errors. Therefore, similar to humans, both configuration and component movements are important during chimpanzee facial expression processing.
Keywords: facial expression, FACS, social cognition, visual processing, inversion
The ability to discriminate facial expressions and interpret their meaning during ongoing social interactions are critical skills for many animal species, but particularly for primates that rely on visual cues as one of their primary modes of social communication. Among humans, it has long been claimed that specific facial expressions correspond to basic emotions, such as anger, fear, happiness, sadness, surprise, and disgust, and that these are universally recognized across different cultures (Ekman, 1973; Ekman & Friesen, 1971). This universality, as it is described, provides support for the idea that emotional facial expressions are strongly biological in nature and, therefore, any similarity between facial expressions in human and nonhuman primates might reflect a similar underlying emotion and/or motivation (Chevalier-Skolnikoff, 1973; Darwin, 1872/1955). To understand the evolutionary significance of primate facial expressions, comparative studies must examine in detail how similar these expression are to human emotional expressions and, moreover, whether nonhuman primates process these expressions using similar cognitive and perceptual strategies.
Strong traditions in ethology and animal behavior research have provided detailed descriptions of primate facial expressions, but only a handful of studies to date have examined how nonhuman primates discriminate their own facial expressions and which features are most salient or conspicuous. Using a technique that scans the gaze patterns made by rhesus monkeys when processing images, Nahm and colleagues (Nahm, Perret, Amaral, & Albright, 1997) found viewing preferences for the eyes over the mouth region when monkeys were shown naturalistic photographs of conspecifics' open mouth threats, fear grins (i.e., bared-teeth display), and neutral faces, but greater visual exploration was directed to the mouth region for yawns and lip-smack displays. These authors suggested that, although information gained from the mouth region is highly socially relevant, revealing the size of the canines, viewing such features in agonistic displays, like threats and bared-teeth displays, might be aversive. Monkeys would best be served by concentrating on the directed intent of these agonistic displays, such as where the monkey is looking, rather than dwelling on the quality of the teeth. Gothard, Erickson, and Amaral (2004) used a similar visual eye-tracking procedure in rhesus monkeys but, in contrast to Nahm and colleagues, found greater exploration of the eye region for lip-smack displays and the greatest mouth exploration for bared-teeth displays. Viewing eye and mouth regions was about equal for threat faces and yawns (Gothard et al., 2004). The study by Nahm and colleagues presented images in a free viewing paradigm, whereas the images in Gothard and colleagues were presented within a visual paired comparison task, in which monkeys must detect a novel image when paired with a familiar one. Therefore, monkey studies have been somewhat inconsistent in identifying the features that are most prominent when monkeys view and/or discriminate conspecific facial expressions.
Kanazawa (1996) conducted a more detailed study using a matching-to-sample procedure that examined the specific features used by Japanese monkeys to discriminate among human and monkey expressions. Although four monkeys were initially trained, only one was able to learn the basic task, to match identical pictures of the same expression versus a different expression as the nonmatching image. To assess perceived differences between the conspecific expression photographs, a multidimensional scaling (MDS) analysis was performed, similar to that used in Experiment 3 of the present study. The expressions presented included bared-teeth displays and threat faces, and these were shown ranging from peak intensity to neutral. The MDS analysis revealed a horizontal axis involving bared-teeth displays to threat faces, which Kanazawa identified as a subordinate–dominant axis, and a vertical axis that ranged from neutral faces to a type of tense mouth face, which was identified as a neutral–tense axis. Correlations were then performed between individual features shared by the expressions along each axis. This revealed eye-width, mouth thrust, and mouth curve to be the prominent features for the subordinate–dominant axis, and brow raise to be the predominant feature for the neutral–threat axis. When discriminating among human facial expressions, the monkeys were able to classify only the smile and were unable to discriminate anger and disgust faces from sad faces. Therefore, even though perceptual features could enable the discrimination of these human expressions, the macaque seemed unable to attend to these features, perhaps because they lacked biological relevance for the monkey. Interesting, researchers have proposed that the human smile is homologous to the monkey bared-teeth display, so the smile expression may have evoked greater familiarity for the monkeys, as the features shared between these expressions are very similar (Preuschoft & van Hooff, 1995; van Hooff, 1972).
Chimpanzee facial expressions are highly graded signals, varying in both form and intensity, and may appear across a wide variety of social contexts (Parr, Cohen, & de Waal, 2005; Goodall, 1986; Marler, 1976; van Hooff, 1967). Basic facial expression categories include the bared-teeth display, pant-hoot, play face, scream, pout, and whimper. In general, very few studies have examined the functional meaning of these facial expressions. Most notable is a proposed homology between two expressions in chimpanzees and humans, the silent bared-teeth display and the human smile, and the play face (formally called the relaxed open mouth face) and human laughter (Preuschoft & van Hooff, 1997; van Hooff, 1972). Bared-teeth displays are reassurance gestures that signal a lack of agonistic intent in the sender (Waller & Dunbar, 2005). Play faces almost exclusively accompany play bouts and are likely to facilitate the play interaction (Parr et al., 2005). Screams are one of the most conspicuous expressions among chimpanzees and are accompanied by a loud, raspy vocalization. Researchers have identified several acoustic subtypes of screams, one used predominantly by the aggressor of a conflict and the other used by the victim (Slocombe & Zuberbuhler, 2005). However, no attempt has been made to determine if the visual components of these subtypes also differs. Pouts and whimpers are visually quite similar, in which the noticeable difference is the additional retraction of the lip corners and baring of the upper teeth in the whimper. They are both used by individuals in situations in which access to something is desired but not obtained, that is, during weaning by young individuals, when seeking contact reassurance, or when prevented from obtaining something, as in food begging. Finally, the pant-hoot is used during situations of extreme excitement, that is, when building momentum for a bluff display, when announcing the presence of a desirable food source, or when groups of individuals reunite after an absence.
Only one study has examined how chimpanzees may discriminate among these different facial expression categories. Parr and colleagues (Parr, Hopkins, & de Waal, 1998) presented six chimpanzees with the task of discriminating five conspecific facial expressions, bared-teeth, play face, relaxed-lip face (a type of neutral face), pant-hoot, and scream, from a neutral portrait. Each facial expression showed a different individual, so that individual identity could not be used as a basis for the discriminations. The chimpanzee subjects had already performed a variety of matching-to-sample tasks involving individual identity (Parr, Winslow, Hopkins, & de Waal, 2000), but they had never been presented with the task of matching facial expressions. Three of the five expressions were discriminated above chance on the first testing session, the bared-teeth, scream, and play faces. The pant-hoot was discriminated above chance on the fourth testing session, but the relaxed-lip face was never discriminated from the neutral face, despite the prominent droopy “relaxed” lower lip. These last expressions, however, are functionally neutral and may have been categorized according to their emotional neutrality. In a follow-up task, expressions were paired with each other, as opposed to a neutral face, so that every dyadic combination of expressions was presented. This format enabled researchers to examine the resulting pattern of errors and ultimately understand something about the perceptual processes involved in these discriminations. Correlations were performed between subjects performance (% correct matching) on each expression dyad and the number of features shared between those two expressions. Negative correlations would indicate a bias for feature processing, where poorer performance would be expected as the number of shared features in the dyad increased. The overall correlation, however, was only weakly negative, suggesting that expressions were not discriminated exclusively by attending to distinctive features. However, when the same analysis was conducted separately for each expression category, some expressions appeared to be more influenced by specific features, that is, the bared-teeth display and pant-hoot, than others, that is, play face and scream (Parr, Hopkins, et al., 1998). The identification of specific features in this study was very simplistic, that is, eyes open, mouth closed. Moreover, obtaining photographs of high quality, peak intensity expressions from subjects during naturally occurring behavior is extremely difficult. In many cases, the expression examples used in these studies were graded, by either not showing peak intensity or appearing as a blend between two categories. Therefore, the results of these studies would undoubtedly become clearer through the use of more standardized facial expression stimuli, either by showing the same individual in all examples, or by using only peak intensity examples.
Despite anecdotal reports of similarity in the appearance of some human and nonhuman primate facial expressions, systematic studies to assess homology have rarely been attempted. This is due, in part, to the lack of a standardized measurement tool for making such comparisons. Moreover, inferring emotion from facial expressions is such a prominent bias in human perception that it can often be difficult for humans to objectively evaluate these signals in other people or other species. To overcome these biases in his own human cross-cultural research, Ekman and Friesen (1978) developed a novel and innovative method for quantifying facial movement, The Facial Action Coding System (FACS). The FACS measures changes in facial movements that correspond to the action of the underlying facial musculature. Each movement is given a numerical code, or action unit (AU), that corresponds to that muscular contraction. Thus, FACS represents an objective and biologically based tool for comparing facial movements across populations of individuals and experimental conditions. Because of its rigor, both in design and in the training and certification process, the FACS has become the gold standard for facial expression research in humans (Ekman & Rosenberg, 1997).
Recently, in an effort to aid comparative, evolutionary research on emotion and nonverbal communication, researchers have developed a chimpanzee Facial Action Coding System (Chimp-FACS; Vick, Waller, Parr, Pasqualini-Smith, & Bard, 2007), which was modeled after the human FACS. This has not only enabled greater precision and objectivity in classifying chimpanzee facial expressions, but it has enabled researchers to identify the most prototypical movements in each expression category by deconstructing these expressions into their individual action unit configurations. Recently, Parr, Waller, Vick, and Bard (2007) coded hundreds of naturalistic photographs of chimpanzee facial expressions using ChimpFACS and subjected then analyzed the uniqueness of these codes using a discriminant functions analysis. This enabled the identification of prototypical movement configurations for each basic facial expression category, those movements that most commonly occurred for each category (Parr et al., 2007). They then adopted a commercially available 3D animation software package (Poser, efrontiers.com) to manually create a set of chimpanzee facial expression stimuli based on these prototypical movement configurations. The software enables the user to animate different regions of the face in a very precise way. This was done so that the resulting facial movements were comparable to the action units (AUs) described in ChimpFACS. Therefore, the chimpanzee model can be posed in various facial configurations with any head orientation, eye gaze direction, and intensity while keeping individual identity standardized. Just as most human facial expression research employs a set of standardized facial expression stimuli (Ekman & Friesen, 1975; Martinez & Benavente, 1998), studies of chimpanzee facial expression processing can now utilize similarity controlled images (Parr & Waller, 2006).
It is the goal of this paper to further examine the nature of facial expression processing in the chimpanzee using these standardized Poser stimuli. Four studies are presented. The first experiment examined whether chimpanzees were able to discriminate the 3D facial expression figures in a matching-to-sample task by attempting a replication of the initial study by Parr, Hopkins, et al. (1998) described above. Second, an inversion task was performed to examine the general influence of stimulus orientation on facial expression processing, and whether inversion would affect each category of expressions similarly. Third, an MDS analysis was performed using the training data from Experiment 2 to examine the perceived dissimilarity among the set of expressions. Finally, the features important for the perceived dissimilarity identified by the MDS were examined by presenting subjects with the task of matching each prototypical facial expression using only its individual component movements. Therefore, this last experiment examined which individual movements were the most salient when discriminating each expression category.
General Method
Subjects
Data were collected from 6 adult chimpanzees (Pan troglodytes, 4 males). One male and one female were approximately 11 years of age and the remaining subjects were approximately 18 years of age at the time of testing. All subjects were socially housed in adjacent indoor/outdoor enclosures at the Yerkes National Primate Research Center, Atlanta, Georgia. The chimpanzees were raised by humans in peer groups in the Yerkes Primate Center nursery. This provided them with appropriate peer contact and social interaction early in their development. At 4 years of age they were moved to semipermanent social groups comprised of different aged individuals, in addition to a variety of neighbors with whom they shared visual and auditory contact, as well as some physical contact, through mesh. All subjects had prior experience with a range of computerized tasks using matching-to-sample (MTS) procedures, including face recognition tasks, and represent a subset of the Yerkes Primate Center's Chimpanzee Cognitive Research Core (Parr, Hopkins, et al., 1998; Parr et al., 2000).
Procedure
Chimpanzees were tested voluntarily in their home cage. In brief, a computer housed in an audio-visual cart (90.0 × 67.5 × 100.0 cm) enclosed in clear Plexiglas was wheeled to the front of subjects' home cage and positioned approximately 30 cm from the cage mesh. This was approximately 40 cm from the subjects' eyes and inline with regard to height. A joystick (approximately 5.0 × 2.5 × 5.0 cm) was then attached vertically to the front of the home cage so that the stick protruded approximately 4 cm into the mesh. A MTS task was then initiated. In accordance with the MTS procedure, subjects were first required to make an orienting response to a single photograph, hereafter referred to as the sample, by moving the cursor to contact this image presented on a black background (Figure 1a). After subjects oriented to the sample image, two comparison stimuli appeared (Figure 1b). These three images are collectively referred to as a stimulus set and represent one trial. The comparison stimuli were presented in the corners of the monitor such that the images were across from one another and equidistant from the sample, that is, bottom left and right, upper and lower left, upper and lower right, and top left and right. All images were formatted so that their presentation size was 300 pixels high. The delay between the presentation of the sample image and the two comparisons was approximately 500 ms. Subjects were required to move the joystick-controlled cursor to contact the comparison image that matched the sample (the target). If this occurred, a “correct” sound was played from speakers located on the lower shelf of the A/V cart and subjects were given a small food reward, such as a piece of fruit or squirt of juice. If the nonmatching comparison image was selected (the foil), an “incorrect” sound played and no food reward was given. Correct responses were followed by a short intertrial interval of 2 s, while incorrect responses were followed by a 6 s interval.
Figure 1.
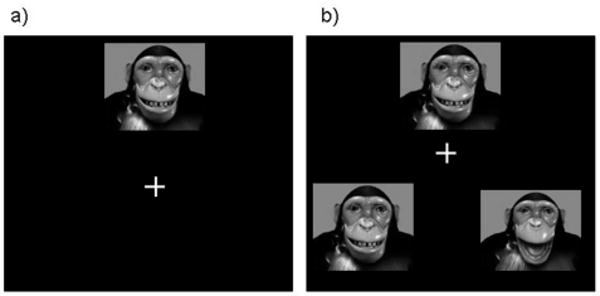
An overview of the matching-to-sample (MTS) task. An illustration of the matching-to-sample testing procedure. In a) subjects orient to the sample image by contacting it with a joystick-controlled cursor. After this (b), two comparison images appear. The image on the left is the target, as it matches the sample. Selecting it is the correct response and is followed by a food reward. Selecting the image on the right (the foil) is incorrect and is not followed by a food reward.
Creation of the Poser Stimuli
The stimuli used in these experiments were created by our lab using Poser 6.0, a 3D, custom design software package for the creation of digital characters (www.e-frontier.com/go/poser). The same figure was used for all the stimuli in these experiments, so individual identity was controlled. Using Poser's design features, a custom sequence of anatomically correct expression “morphs” was created to model the prototypical facial expressions identified in previous studies using ChimpFACS (Parr et al., 2007). Figure 2 gives a brief overview of these procedures. The highlighted area shown over a wire frame representation of the 3D chimpanzee is the region-of-interest for the morph. This region is analogous to an artificial muscle that can be animated using the custom morphs. The location and action of these “muscles” was modeled as closely as possible to the actual anatomical location of chimpanzee facial muscles (Burrows, Waller, Parr, & Bonar, 2006), and how their action functions to change the appearance of the face (Waller et al., 2006). Figure 2 shows the movements that are created when the “muscle” involved in ChimpFACS AU10, or upper lip raiser (levator labii superioris), is morphed, and the combined action that results from moving both AU10 + AU12 (AU12 = lip corner puller, zygomatic major). Also shown is a list of each AU morph, and the dial that is used to adjust each movement's intensity along a continuum from no movement to extreme movement. Thus, the system allows for the creation of subtle, graded movements as well as grossly exaggerated movements.
Figure 2.
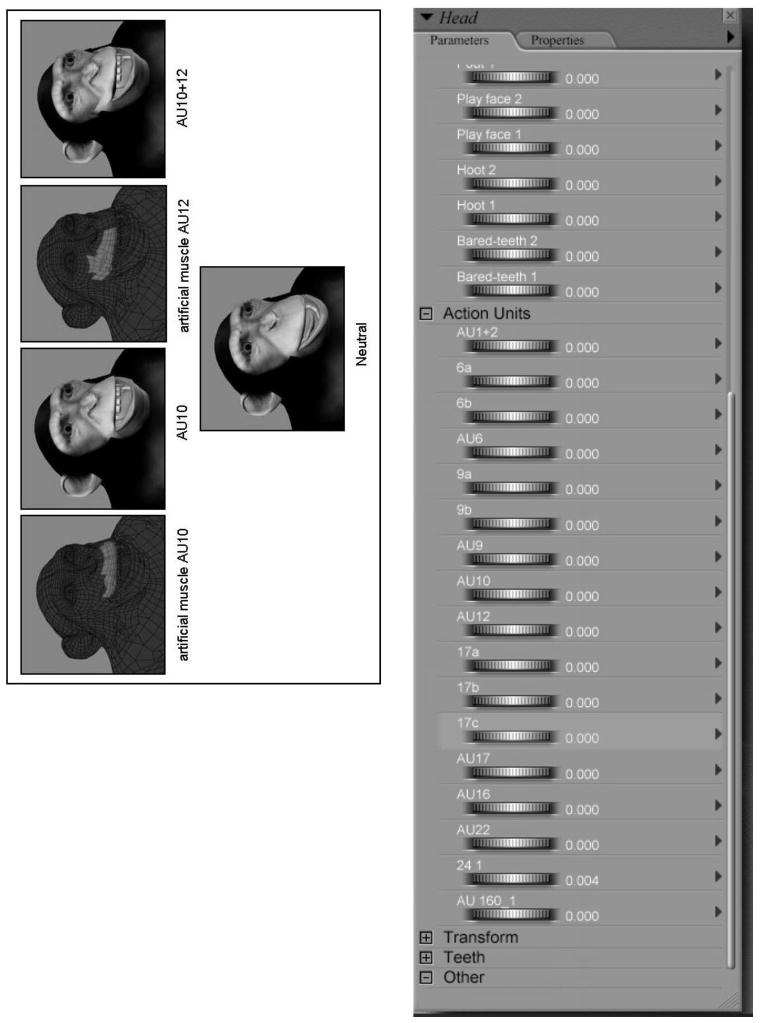
An illustration of how custom facial expression morphs were created using Poser. An illustration of the process used to create custom facial expression morphs using Poser 6.0 and based on ChimpFACS (Vick, Waller, Parr, Pasqualini-Smith, & Bard, 2007).
Prototypical chimpanzee facial expressions were then created by combining individual action units into a prototypical configuration, as identified through previous analyses of naturally occurring chimpanzee facial expressions (Parr et al., 2007). The resulting standardized, prototypical facial expression configurations, and their action unit sequences, can be seen in Figure 3. This figure also provides a photograph of a chimpanzee making the same prototypical expression taken from naturally occurring behavior. These action unit codes will be important in understanding the discussion that follows Experiments 3 and 4.
Figure 3.
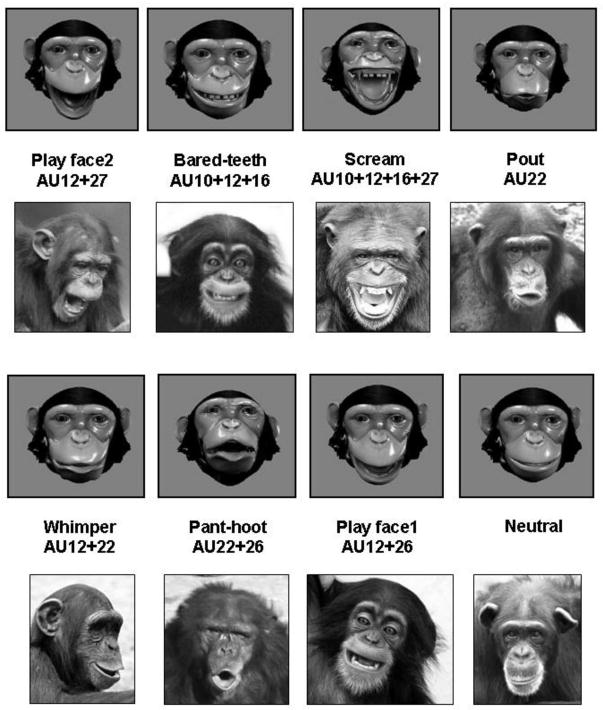
An example of each prototypical facial expression configuration created with Poser software, its ChimpFACS coding, and for comparison a naturalistic example of that same expression category with identical ChimpFACS codings. Some photographs courtesy of the Living Links Center, Emory University. Prototypical chimpanzee facial expressions, and their ChimpFACS action unit codes, animated using Poser 6.0, and photographs from naturally occurring behavior.
Experiment 1: Initial Discrimination of Poser Stimuli
The purpose of this first experiment was to examine how subjects would perform when required to discriminate among these Poser expression stimuli, comparing performance on the very first testing session with a fairly liberal final criterion that avoided ceiling effects. It was anticipated that subjects would perform well on these discriminations, as the Poser stimuli are realistic, prototypical in appearance, anatomically correct in their structure, and posed at peak intensity (Parr & Waller, 2006). However, it was also predicted, based on previous experiments using real photographs (Parr, Hopkins, et al., 1998), that some expression categories would be easier for chimpanzees to discriminate than others, but that overall they would be learned quickly.
Stimuli
The stimuli used in Experiment 1 consisted of the seven prototypical chimpanzee facial expressions created with Poser 6.0, bared-teeth display (BT), scream (SC), whimper (WH), pant-hoot (HO), play face1 (PF1), play face2 (PF2), and pout (PO). Also presented was a neutral portrait (N), which contains no movements (see Figure 3).
Procedure
Expressions were presented in a dyadic matching format, in which each expression is paired with an example from every other expression category as the nonmatching (foil) stimulus. In this way, every dyadic combination of expressions is presented (see Parr, Hopkins, et al., 1998). Thus, there were six possible dyads for each expression categories, that is, for BT this would include BT and HO, BT and PO, BT and SC, BT and WH, BT and PF1, and BT and PF2. One expression category was presented at a time in a single testing session in which each trial was repeated 10 times, totaling 60 trial sessions. In this initial experiment, the PF1 and PF2 expressions were not paired together as a dyad, but instead were presented with a neutral portrait (N).
Before advancing to the next expression category, subject's performance was required to meet one of two criteria, whichever came first. Either the performance exceeded 75% overall, indicating very good discrimination of that expression type from all other categories, or the performance exceeded 70% on at least three different expression pairs within a single testing session. This latter criterion was implemented to avoid ceiling effects from repeated testing, as it was assumed that some expression dyads would be more difficult to discriminate than others. Very poor performance on a single dyad, for example, could bring the overall percentage down, even when performance on several other dyads might be quite good from the beginning. If either of these conditions was met, subjects would proceed to the next expression category, with the category order presented to all subject.
Data Analysis
First, the overall performance (percentage correct) on the very first testing session for each expression category was calculated. Binomial z scores were then used to determine whether subjects performed significantly above chance on this first testing session (60 trial block). Second, performance was compared for each expression category when the final criterion was met, which was, in many cases, also the first testing session. Repeated measures analyses of variances (ANOVAs) then compared performance between these two sessions, in which expression type (n = 7) and session (first vs. final) were the within-subject factors. A second ANOVA examined the final performance for each expression type when it was presented as the sample (matching pair) regardless of foil type, or as the foil (nonmatching stimulus) regardless of sample type. Thus, this analysis examined specifically whether subjects had a particular bias for selecting one expression over another, or would perform differently depending on the dyadic direction of the trial.
Results: Experiment 1
To perform significantly above chance on a single 60-trial testing session, subjects' were required to exceed 62.65% (p < .05, two-tailed). This was achieved by all subjects on the very first session only for the scream. On the final testing session, all subjects performed above criterion on the bared-teeth display, scream, play face1, and play face2 expressions. However, 2 of the 6 subjects, but not consistently the same subjects, still performed below chance on whimper, pant-hoot and pout expressions. Interesting, these were the only expressions to each contain a puckered-lip movement (AU22–lip funneler). Table 1 lists the mean performance by subjects for each expression dyad on the session when they met the final criteria. The mean number of sessions required before subjects reached the final criteria was 1.17—scream; 1.33—bared-teeth; 1.67—whimper; 1.83—play face2; 1.83—pout; 2.00—pant-hoot; 2.67—play face1. Therefore, subjects met this final criterion quickly, fastest for the scream and slowest for the play face1. Figure 4 shows the mean performance by subjects on the first and final testing sessions.
Table 1. Mean Percentage Correct (+sem) by Subjects Matching Each Expression Dyad on the Final Criterion Session of Experiment One.
| Foil Expressions | ||||||||||||||
|---|---|---|---|---|---|---|---|---|---|---|---|---|---|---|
| Sample | Bt | sem | Ho | sem | Po | sem | Pf1 | sem | Pf2 | sem | Sc | sem | Wh | sem |
| Bt | x | x | 65.00 | 9.57 | 73.33 | 6.67 | 73.33 | 5.58 | 65.00 | 5.00 | 81.67 | 3.07 | 68.33 | 3.07 |
| Ho | 71.67 | 3.07 | x | x | 70.00 | 8.16 | 60.00 | 6.83 | 61.67 | 54.77 | 56.67 | 8.82 | 65.00 | 10.57 |
| Po | 76.67 | 4.94 | 76.67 | 8.03 | x | x | 75.00 | 5.00 | 63.33 | 6.15 | 73.33 | 7.15 | 51.67 | 10.46 |
| Pf1 | 68.33 | 6.01 | 86.67 | 2.11 | 75.00 | 3.42 | x | x | 73.33* | 7.60 | 88.33 | 7.49 | 68.33 | 9.46 |
| Pf2 | 66.67 | 8.03 | 65.00 | 9.57 | 75.00 | 8.47 | 81.67* | 7.03 | x | x | 73.33 | 7.15 | 80.00 | 3.65 |
| Sc | 70.00 | 4.47 | 68.33 | 8.72 | 75.00 | 5.62 | 76.67 | 6.67 | 76.67 | 4.94 | x | x | 63.33 | 8.03 |
| Wh | 60.00 | 5.16 | 85.00 | 5.63 | 61.67 | 11.08 | 58.33 | 5.43 | 63.33 | 3.33 | 81.67 | 4.77 | x | x |
Note. The play face expressions (pf1 and pf2*) were not paired with each other, so the percentage listed for pf1-pf2 or pf2-pf1 pairings reflects their discrimination from a neutral portrait.
Figure 4.
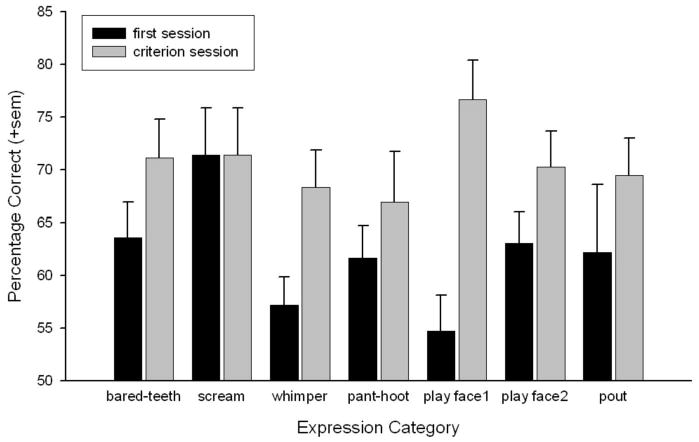
Mean performance (+SEM) categorizing Poser facial expressions on the very first testing session and after reaching the final criteria. Mean performance on each expression category on Session 1 and on the final, criterion session.
Comparing performance for expressions between the first and final testing sessions revealed a significant main effect of session, F(1, 5) = 28.05, p < .003, and a near significant interaction between expression type and session, F(6, 30) = 2.15, p = .076. Sessions were then compared for each expression type using paired t tests. This revealed that the only expression for which performance significantly increased across testing session was the play face1, t(5) = 3.9, p < .02. This was also the expression that required the most training (an average of 2.67 sessions).
Analyzing performance on each expression type regardless of whether it was the sample or foil revealed no significant differences. Therefore, the processing strategy being used by subjects to perform these discriminations remained consistent regardless of the directionality of the task that is, matching an expression as the sample or avoiding that expression as the foil. This suggests the absence of a stimulus bias, or that expressions were equally salient, with no one expression being more interesting or attractive than another.
Discussion: Experiment 1
The main purpose of this initial experiment was to verify that the Poser facial expression stimuli were salient for the subjects, could be discriminated at high levels of proficiency, and that expressions were processed similarly with no apparent stimulus biases. Subjects' performance was, for example, comparable regardless of whether the trial was to discriminate a pair of pouts from a scream, or a pair of screams from a pout. The initial analysis showed that the scream was the most salient expression to discriminate, as all subjects performed above chance for scream discriminations on the first testing session. They also reached the final testing criteria for screams in the shortest time. The play face1 was the only expression that showed significant learning or improvement in performance from the first to the final testing session. This expression was also the most difficult to learn, requiring an average of just under three sessions to achieve the final testing criterion. This suggests that it was one of the least salient facial expression categories. Finally, because this task used a liberal criteria of >75% correct overall, or >70% on at least three foil categories, it was possible to reach this final criterion but still perform below chance overall, that is, indicating very poor performance on some foil categories. This was true for several expressions, whimper, pant hoot, and pout.
Experiment 2: the Inversion Effect for Facial Expressions
Experiment 2 examined whether facial expression processing is sensitive to orientation using the well-known inversion effect. The inversion effect, a general discrimination impairment that results when faces are presented in their inverted compared to upright orientations, is used as a general marker of configural face processing in humans and other species (Parr, Dove, & Hopkins, 1998; Valentine, 1988; Yin, 1969). The inversion effect has also been used recently in combination with other procedures to examine the configural processing of facial expressions in humans (Calder, Young, Keane, & Dean, 2000). Previous studies in chimpanzees have demonstrated a selective inversion effect for faces of expertise, those categories for which subjects have considerable expertise. Chimpanzee subjects showed the inversion effect for chimpanzee and human faces, both species for which subjects were highly familiar, but not for an unfamiliar face category, capuchin monkeys, or for nonface categories, clip art or pictures of automobiles (Parr, Dove, et al., 1998). In this experiment, facial expressions were presented in the dyadic format, as described in Experiment 1, until performance reached a predetermined level. After this, the same trials were added in their inverted orientation and analyses compared performance on a fixed number of upright versus inverted trials. This format has been used previously to examine the inversion effect for face identity processing in chimpanzees (Parr, Dove, et al., 1998; Parr & Heintz, 2006). Significantly worse performance on inverted compared to upright trials is used as evidence for general configural processing (Maurer, Le Grand, & Mondloch, 2002). No attempt is made here to delineate among the different forms of configural processing, first-order relational feature, second-order relational feature, or holistic processing, but rather to compare whether the discrimination of each expression category is equally sensitive to stimulus orientation.
Stimuli
The stimuli used in Experiment 2 consisted of the same seven prototypical Poser facial expressions, bared-teeth display, scream, whimper, pant-hoot, play face1, play face2, and pout (see Figure 3). A neutral was also included in this experiment. The inverted stimuli were identical to those used in upright trials, only they were rotated 180 degrees.
Procedure
Each expression was paired with an example from every other category, in the same dyadic format as described above. This experiment also included a neutral portrait as a foil category only. Therefore, there were seven possible dyadic combinations in this experiment and these were repeated 10 times per daily testing session (n = 70 trials). Play face1 and play face2 were paired in this experiment. Only one expression category was presented at a time. When a subject's performance exceeded 75% for the upright trials in a category, the same trials were added in their inverted orientation and subjects then received a total of 10 repetitions of both the upright and inverted trials (total of 140 trials) in a single session before moving on to the next expression category. The format for the inversion trials was for the sample to remain upright and the two comparison images to be presented upside down. The neutral portrait was never presented as a sample.
Data Analysis
First, analyses compared the number of sessions required for subjects to perform above 75% correct on the upright trials. This represents the stricter of the criteria used during Experiment 1. In this ANOVA, expression type was the within-subjects factor. Then, a series of paired t tests were used to compare subjects' performance on the upright versus inverted trials for each expression category (70 trials in each orientation).
Results: Experiment 2
An initial repeated measures ANOVA compared the number of sessions required to reach the >75% performance on the upright training trials, in which expression type (N = 7) was the within-subject factor. This revealed no significant difference in training performance across expression category, F(6, 30) = 1.79, p = .14. A second ANOVA was then performed in which orientation (up vs. inverted) and expression type (N = 7) were the within-subject factors. This revealed a significant main effect of orientation, F(1, 5) = 92.79, p < .001, in which performance was significantly better for upright trials compared to inverted trials. The interaction between orientation and expression type was near significance, p = .09.
Paired t tests were used to compare performance on the upright and inverted trials for each expression category during the test session. This revealed inversion effects, that is, significantly worse performance on the inverted compared to upright trials, for all expression types except play face1; play face2 = t(5) = 3.40, p < .02; bared-teeth = t(5) = 3.91, p < .02; pout = t(5) = 5.92, p < .002; pant-hoot = t(5) = 9.09, p < .001; scream = t(5) = 3.4, p < .02; and whimper = t(5) = 4.08, p < .01. Figure 5 shows the mean performance on upright compared to inverted trials for each expression category.
Figure 5.
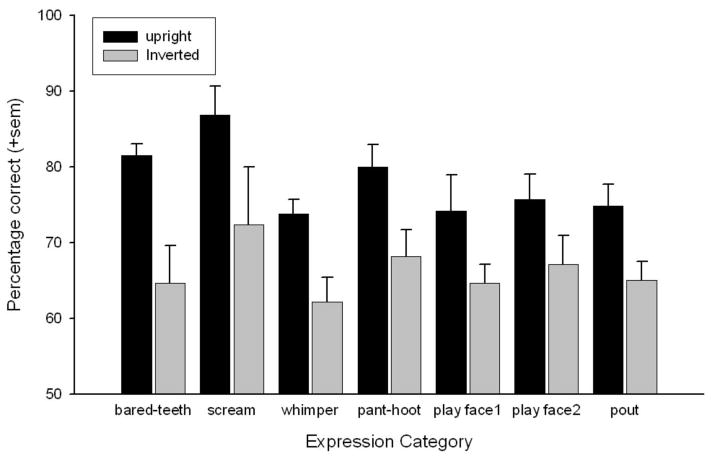
Mean performance (+SEM) discriminating each facial expression category, regardless of foil type, when presented upright or in its inverted orientation. Mean performance on upright versus inverted images of each expression category.
Discussion: Experiment 2
Overall, Experiment 2 revealed a significant inversion effect suggesting a general configural processing strategy for all expression categories except the play face1. This was interesting, as the play face1 was the expression in Experiment 1 that required the greatest amount of training to learn and was the only expression category to show significant improvement with training. Subjects' strategy for learning this expression type may have involved something other than configural processing, such as the detection of specific features, or perhaps even a process of elimination by concentrating on the foil expression type. Although the exact visual processing strategies that are impaired by stimulus inversion are debated (Riesenhuber et al., 2004), the majority of studies consistently show that some aspect of configural processing is impaired (Maurer et al., 2002). This does not imply, however, that specific facial features are unimportant for facial expression categorization. In fact, the presence of specific features might be necessary for expressions to be accurately discriminated. Therefore, to understand which facial features were the most salient for facial expression discrimination, Experiment 3 subjected subjects' performance on the upright training trials in this experiment to a multidimensional scaling analysis.
Experiment 3: Examining Perceived Dissimilarity Using Multidimensional Scaling
Although the results of Experiment 2 suggest an overall configural strategy for facial expression processing, this does not rule out the importance of individual features in discriminating one expression from another. Performance is expected to be more difficult when expressions share many features in common. Results of previous facial expression discrimination studies in chimpanzees have suggested that features may be important for the discrimination of some expression categories more than others (Parr, Hopkins, et al., 1998). Moreover, human studies have shown that two expressions that differ in their configurations by only a single component movement can produce very different emotional impressions. The presence of an AU6, cheek raiser, in the Duchenne smile results in the smile being perceived as more enjoyable, even though this differs from the non-Duchenne smile by only one movement (Wallbott & Ricci-Bitti, 1993). Therefore, unlike general face processing that shows strong configural biases (Diamond & Carey, 1986; Maurer et al., 2002; Valentine, 1988), facial expression categorization appears to be dependent on the ability to extract consistencies in the presence of individual features, and perhaps even shows some individual variability in terms of which features are most important for discriminating each expression category.
This experiment examines the perceived dissimilarity of facial expression dyads using multidimensional scaling. This was done using subjects' performance on the upright training trials obtained during Experiment 2. This analysis produces a spatial plot in which the distance between expressions represents how well they are discriminated from one another, in which greater distances mean greater perceived dissimilarity and better discrimination. It was hypothesized that when the expressions in a dyad share features in common, their minimal component movements as identified through ChimpFACS (Vick et al., 2007), they would be difficult to discriminate and fall closer together in the cluster plot. In contrast, when their features have little overlap, the discriminations would be relatively easy, falling farther apart in the cluster plot. It was further hypothesized that the pattern of expression clustering would reveal something about the specific movement or movements that were most salient for defining a class of expressions, as any cluster of expression should contain at least one similar movement.
Procedure and Data Analysis
First, a confusion matrix was created from the training data obtained in Experiment 2 listing the percentage of errors made to each foil expression based on the total number of errors made for that expression category. Thus, the errors sum to 100% for each expression category. The resulting matrix is asymmetrical, in that performance for dyad A–B is independent of performance for dyad B–A. The distribution of errors for each expression type was then assessed using repeated measures ANOVAs in which foil type was the within-subjects factor. Separate ANOVAs were required as the foil types differ for each expression category.
Second, the data in the confusion matrix was subject to a MDS analysis using SPSS 13.1. This produced a geometrical map, or cluster plot, of expressions in terms of their perceived dissimilarity by the subjects (Everitt & Dunn, 2001). In this case, perceived dissimilarity was inferred from the percentage of correct responses. Therefore, a high percentage of correct responses would indicate that the two expressions are perceived as dissimilar, as the subjects found it easy to discriminate the match from the foil. Data from the neutral portrait pairings were excluded so as to create a square matrix for analysis, and the MDS was run using a Euclidian distance scaling model.
Results: Experiment 3
Table 2 shows the distribution of errors in the confusion matrix. Analyses revealed that this distribution was significantly different across each of the foil categories for all expressions except the scream and the pant-hoot; bared-teeth display, F(6, 30) = 11.31, p < .001; whimper, F(6, 30) = 5.68, p < .001; play face1, F(6, 30) = 5.65, p < .001; play face2, F(6, 30) = 4.76, p < .002; and pout, F(6, 30) = 5.30, p < .001. Thus, errors were not equally distributed across foil categories, but rather were made significantly more to some foil categories than others. This was true for all expressions except scream and pant-hoot.
Table 2. Confusion Matrix of Performance on Facial Expression Dyads.
| Foil expressions | ||||||||
|---|---|---|---|---|---|---|---|---|
| bt2 | ho2 | N | pf1 | pf2 | po | sc2 | wh | |
| Sample expression categories | ||||||||
| bt2 | 80.17 | 13.63 | 4.78 | 17.57 | 14.24 | 11.68 | 0 | 38.1 |
| ho2 | 11.42 | 80.33 | 5.62 | 21.34 | 17.05 | 15.95 | 8.58 | 20.05 |
| pf1 | 11.18 | 15.82 | 1.96 | 77.67 | 32.6 | 11.69 | 10.48 | 16.27 |
| pf2 | 7.4 | 23.69 | 0 | 12.93 | 80 | 9.79 | 21.28 | 24.91 |
| po | 7.77 | 22.11 | 6.4 | 13.41 | 12.88 | 81.33 | 4.43 | 33 |
| sc2 | 4.6 | 15.29 | 4.24 | 28.72 | 28.66 | 8.54 | 86.67 | 9.95 |
| wh | 19.6 | 24.51 | 5.73 | 16.71 | 10.78 | 22.68 | 0 | 80.33 |
Note. Values represent the distribution of errors across foil types for each expression category, based on the total number of errors for that category. The values in the symmetrical cells indicate the percentage correct for that expression type, regardless of foil category.
The MDS model produces a stress value corresponding to how close the model is to the original dissimilarity matrix (Table 2), in which lower values indicate less stress and therefore more stability. Young's S-Stress Formula 1 (Everitt & Dunn, 2001) produced five iterations that corresponded to an S-Stress value of 0.222, which is a good indicator that that model could not be improved further. Similar stress values were reported in previous studies of monkey expression discrimination (Kanazawa, 1996). Overall, the Kruskal's Stress Formula 1 was 0.138, again indicating a fair fit with the original data matrix (as a rule of thumb, 0.2 = poor fit, 0.1 = fair fit, 0.05 = good fit, 0.025 = excellent fit; Everitt & Dunn, 2001). The model also indicated that over 92% of the variance in the matrix was accounted for by the distances shown in the MDS model (R2 = 0.925).
Figure 6 plots the results of the MSD analysis showing the perceived dissimilarity among expressions. ChimpFACS was then used to interpret the nature of each of the plots' dimensional axes according to similarity in component movements for each expression. The expressions along the left side (negative) of the Dimension 1 axis, the SC and the PF2, both contain a wide stretched open mouth (AU27–mouth stretch). Expressions along the right, or positive, side of Dimension 1 all have a closed mouth. Therefore, Dimension 1 appears to reflect the degree of mouth closure in which negative values indicate more extreme mouth opening and positive values indicate closed mouths. The upper right quadrant shows a clustering of HO, PO, and WH, expressions that all contain a puckered-lip movement (AU22–lip funneler). In contrast, the lower right quadrant contains expressions with retracted lips (AU12–lip corner puller). The WH, however, occurs on the center of the Dimension 2 axis, because this expression has both puckered and retracted-lip movements (AU12 + 22, see Figure 3). Therefore, Dimension 2 appears to indicate the degree of lip-puckering/retraction in which the more negative values indicate greater lip retraction, exposing the teeth, and positive values reflect lip-puckering.
Figure 6.
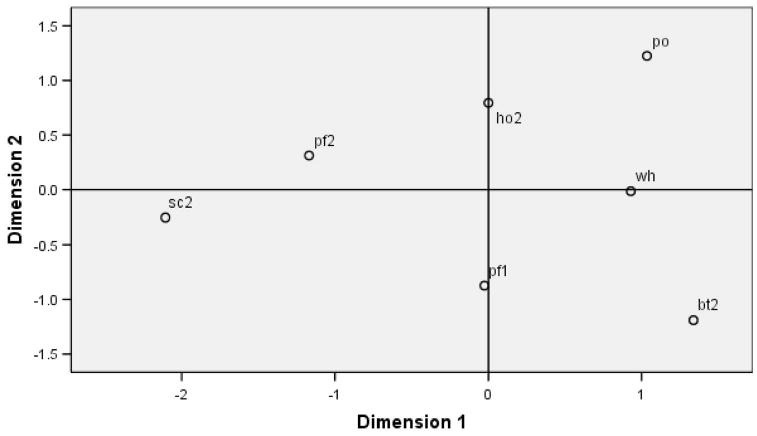
A plot of subjects' perceived dissimilarity among facial expressions created using an ALSCAL multidimensional scaling analysis. The closer the facial expressions are clustered, the greater their perceived similarity and therefore the greater confusion. Dimension 1 is best characterized as the degree of mouth closure, where negative values indicate greater mouth opening, and Dimension 2 is best characterized by the degree of lip puckering/retraction, where negative values indicate greater lip retraction. The abbreviations are sc2 = scream, pf2 = play face2, pf1 = play face1, ho2 = pant-hoot, wh = whimper, po = pout, bt2 = bared-teeth display. The multidimensional scaling model of perceived dissimilarity between facial expressions based on subject's discrimination performance on the upright training for Experiment Two.
Both the pant-hoot and the play face1 have a moderate degree of mouth opening, explaining their position at the midline of Dimension 1. The pant-hoot, however, has a lip-pucker and thus falls on the positive end of Dimension 2, whereas the play face1 has a lip-retraction and falls on the negative end of Dimension 2. Both the PF2 and SC also have lip-retraction, but because the mouth is so stretched open from the AU27, the appearance of the retraction is minimized and thus these two expressions cluster near the mid point of Dimension 2.
Figure 7 illustrates the same MDS plot but now retrofits directional arrows that indicate the greatest errors made consistently during the initial performance in Experiment 1 and the upright training data utilized from Experiment 2. This was done by looking at the performance for each expression category listed in Tables 1 and 2, and searching for the foil expressions that produced the top two greatest percentages of errors. If those foil expressions, or error patterns, were consistent across the two experiments, then a line was plotted showing the direction of the error in Figure 7. Therefore, this figure illustrates the most consistently difficult expression pairs for subjects to discriminate between, both from the onset of testing and after some experience with the Poser figures. Only two expressions pairs showed symmetrical error patterns, PO–WH:WH–PO and PF1–WH:WH–PF1. The figure reveals two main error clusters, one involving AU22 (lip funneler), which is common to HO, WH and PO expressions, and the other involving AU12 (lip corner puller), which is common to PF1, WH, and BT. These are the only possible AU's to produce the confusion as they are the only common movements in these expression clusters.
Figure 7.
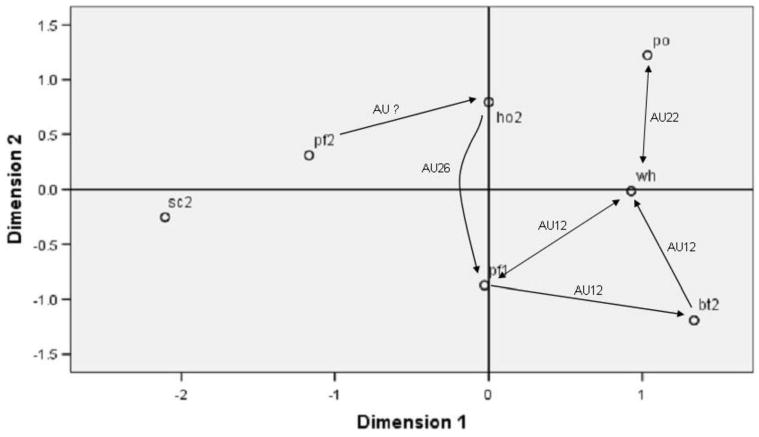
An illustration of the most frequent error patterns for facial expression discriminations performed consistently in Experiments One and Two, overlaid on the perceived dissimilarity model. This plot shows two directional error patterns, one between whimper and pout, and another between whimper and play face1. An illustration of the expression pairs that produced the most frequent errors in both Experiment 1 and 2, and the implicated AU. Only one confusion is unaccounted for in that there is no shared component movement between pf2 and ho2. Scream remains the least confused expression.
Discussion: Experiment 3
Subjects' pattern of error when discriminating all expression categories except screams and pant-hoots showed significant differences depending on the identity of the foil expression. The significance for the distribution of errors for the pant-hoot was p = .06, so this was very close to rejecting the null hypothesis. The salience of the scream, regardless of the expression category it was paired with, was not surprising as the scream was the easiest expression to discriminate based on the results of Experiment 1. If screams are highly salient, then the features of the foil expression would be expected to have little influence on overall performance. Although some expressions are very similar to the scream, in that they share the majority of their individual component movements, such as the bared-teeth display, the presence of these similarities did little to confuse performance.
The MDS analysis provides a statistical interpretation of how expressions were categorized based on their perceived dissimilarity. The ChimpFACS then enabled a qualitative interpretation of the resulting cluster plot. The farther apart the expressions were along the axes in this plot (Figure 6), the greater the dissimilarity and thus the easier they were to discriminate. Although some expressions were more closely grouped than others, like the three puckered-lip expressions in the top right quadrant (pant-hoot, pout, and whimper), on the whole, all of the expressions were treated as clear, independent exemplars. There were no tight clusters, that is, very closely grouped expressions that would indicate strong confusions. This may be suggestive of an overall configural processing strategy, as each of the expressions presented in this experiment contained many repeated features, but unique overall configurations. This cannot, however, be the only explanation as the MDS analysis also revealed a strong effect for specific component movements identified by each axis (Parr et al., 2007). In Experiment 1, for example, pouts and whimpers were difficult to discriminate from each other, but not from pant-hoots. The MDS plot shows that subjects were likely aided by the mouth opening movement (AU26) present in pant-hoots, but absent in whimpers and pouts. Thus, the pout, whimper, and pant-hoot expressions were discriminated along the horizontal axis, degree of jaw closure, even though they all shared the prominent AU22–lip funneler.
Another intuitive cluster is the bared-teeth and scream. These expressions share the most movements in common of all the expression pairs (three of four overall movements, or 75% of their features). However, these appeared on opposite ends of Dimension 1. Using the MDS to interpret this lack of confusion, it again appears that the discriminations were aided by the features defined by Dimension 1, mouth opening, because the only feature not shared between scream and bared-teeth was the mouth stretch, AU27.
Finally, scream, play face1, and bared-teeth were all positioned on the negative side of Dimension 2. These expressions all include a lip-retraction (AU12) movement, but again their exact positioning seems to reflect the extent to which the lip-retraction was moderated by other movements. Although both the scream and play face2 have the mouth stretch AU27 movement, the upper lip is prominently raised in the scream (upper lip retraction, AU10), similar to the bared-teeth display, causing the lip-retraction to be more pronounced than in the play face2. The mouth opening in play face1 is mild (AU26–jaw drop), which also leaves the lip retraction more salient than in play face2. Finally, the bared-teeth display contains no mouth opening, so the lip-retraction is most salient.
Experiment 4: Discriminating Facial Expressions Using Component Movements
Based on the results of the cluster plot produced in Experiment 3, it appears clear that most prototypical facial expression discriminations are aided by the presence of several key features. These features include the degree of mouth opening, either from AU26–jaw drop, or the more extreme AU27–mouth stretch, and from the degree of lip retraction (AU12–lip corner puller) or puckering (AU22–lip funneler). Moreover, the results illustrated in Figure 7 indicate that the MDS has clear predictive power for understanding the previous error patterns made by chimpanzees when discriminating their facial expressions. However, these analyses do not provide any indication of whether each expression is perceived holistically, as the sum of its parts, or whether some movements contained within an expression may be weighted differently than others in terms of their perceptual salience. Therefore, to determine the importance of each individual component movement in the discrimination of a single facial expression, Experiment 4 presented subjects with the task of discriminating each prototypical facial expression using only one of the individual component movements represented in that configuration. If individual component movements are equally important in the discrimination of facial expressions, then subjects should show no bias in selecting some movements over others that is, each movement should be weighted equally, or have equal perceptual salience. However, if some movements are more representative of that expression type, that is, those identified by the MDS analysis and confirmed by subjects' discrimination performance, that is, AU12, AU22, AU26/27, then subjects should show selectivity in the presence of these movements over others in the same configuration.
Stimuli
Stimuli consisted of the same Poser generated chimpanzee character. However, for this experiment, it was animated to show only a single component movement. Each movement contained in the expressions bared-teeth display, pant-hoot, scream, play face2, and whimper were created, resulting in five major action units, AU10, AU12, AU16, AU22, and AU27. The pant-hoot was presented without the AU26 in this experiment, a variation that has been defined previously (Parr et al., 2007). Figure 8 illustrates each of these component movements.
Figure 8.
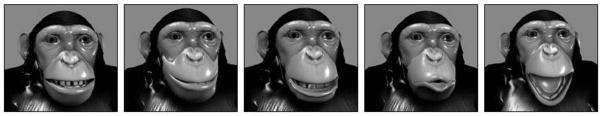
An illustration of five individual component movements, that is, action units, used to describe the prototypical chimpanzee facial expressions. From left to right these include AU10–upper lip retractor, AU12–lip corner puller (bared-teeth, play face2, whimper, scream), AU16- lower lip depressor (bared-teeth, scream), AU22–lip funneler (pant-hoot and whimper) and AU27–mouth stretch (play face2 and scream). An illustration of each individual action unit, from left to right AU10–upper lip raiser, AU12–lip corner puller, AU16–lower lip depressor, AU22–lip funneler, and AU27–mouth stretch. Each chimpanzee facial expression contains a unique combination of some or most of these action units.
Procedure
The task was presented using the same MTS procedure described previously. Subjects were presented with one expression category at a time. The sample always showed the prototypical expression configuration and each of the comparison images showed a single component movement present in the overall configuration. Therefore, subjects were presented with the choice of matching a facial expression configuration to a single AU movement. Every combination of component movements was presented for each expression category. The bared-teeth display, for example, consists of the configuration AU10 + 12 + 16, so three trials were presented for this expression in which the comparison images were AU10 + AU12; AU10 + AU16 and AU12 + AU16. Two combinations only were possible for pant-hoot (AU16 + AU22), play face2 (AU12 + AU27) and whimper (AU12 + AU22), and six different dyads were possible for scream (AU10 + AU12, AU10 + AU16, AU10 + AU27, AU12 + AU16, AU12 + AU27, and AU16 + 27). Because there was no incorrect answer in this task, subjects were rewarded for any choice they made. Similar nondifferential reinforcement procedures have been used successfully in other studies with these same subjects (Parr, 2004).
Six subjects were tested on four repetitions of each unique AU-pair per session. In these tasks, 10 identity matching trials were added as controls, in which each prototypical expression type was presented against a neutral foil. This resulted in a different daily total depending on how many single AU combinations were possible for each expression type. Two overall testing sessions were given, as the task was aimed at generating subjects' first impression of which action units were most salient.
Data Analysis
For the expressions that contained only two action units, or a single AU dyad, a total of eight trials were presented. For the bared-teeth trials, there were three action units but each AU could be presented in only two possible dyads. So, there were 16 trials given for each AU (four repetitions of each trial, in which there were two possible dyadic combinations of each AU, given over two sessions). Finally, for the scream trials, there were six available action unit dyads resulting in 24 total trials for each AU (four repetitions of each trial, in which there were three possible dyadic combinations, give over two sessions). Expressions that had more than two possible action units were analyzed using repeated measures ANOVAs in which AU type was the within-subjects factor. Paired t tests were used to compare responses for the three expressions in which there were only two action units to choose from. Follow-up tests were adjusted for multiple comparisons using Tukey's studentized range statistic (Howell, 2002) where the t value to reject the null hypothesis was adjusted by using t = q/√2. The value q is derived from the studentized range table according to the number of comparisons (k) and the denominator df value.
Results: Experiment 4
Table 3 lists the mean percentage of responses for each action unit involved in the five expression categories. Analyses revealed significant preferences by subjects for selecting the AU27 over AU12 when discriminating play face2, t(5) = 5.39, p < .003, and for selecting AU22 over AU12 when discriminating the whimper expression, t(5) = 4.44, p < .007. There was a strong preference by 5 of the 6 subjects for selecting AU22 to discriminate the pant-hoot, however, 1 subject selected the AU16 in six of the eight trials, t(5) = 2.48, p = .056. Significant biases were also found for the bared-teeth display, F(2, 10) = 4.9, p < .04. The adjusted t value controlling for three multiple comparisons was t > 2.74. These follow-up comparisons showed that overall, the AU10 was preferred over AU16, t(5) = 3.50, p < .02, but no significant differences were found for discriminations between AU12 versus AU16. The preference for AU10 versus AU12, however, neared significance, t(5) = 2.45, p = .058. Finally, significant biases were found for discriminations involving scream AUs, F(3, 15) = 10.26, p < .001. The adjusted t value controlling for six multiple comparisons was t > 3.25. This revealed significant preferences for AU10 over AU12, t(5) = 3.87, p < .02; AU27 over AU12, t(5) = 5.84, p < .002; and AU27 over AU16, t(5) = 5.97, p < .002. No other comparisons were significant.
Table 3. The Mean Percentage Correct (+sem) When Subjects Were Required to Discriminate Each Expression Category According to Its Component Movements (Action Units).
| Component movements | |||||
|---|---|---|---|---|---|
| Expression category | AU10 | AU12 | AU16 | AU22 | AU27 |
| Scream | 61.11 | 27.78 | 42.36 | 68.75 | |
| (sem) | 5.76 | 5.01 | 3.64 | 5.35 | |
| Bared-teeth | 66.67 | 43.75 | 39.58 | ||
| (sem) | 5.27 | 3.23 | 6.97 | ||
| Pant-hoot | 22.92 | 77.08 | |||
| (sem) | 10.91 | 10.91 | |||
| Whimper | 18.75 | 81.25 | |||
| (sem) | 7.03 | 7.03 | |||
| Play face2 | 16.67 | 83.33 | |||
| (sem) | 6.18 | 6.18 | |||
Discussion: Experiment 4
The results of this experiment confirm that for each facial expression, at least one component movement was perceived as having greater salience than the others. The mouth opening movement (AU27) was most salient for the play face2 compared to lip retraction (AU12), consistent with its position at the negative end of Dimension 1—characterized by extreme mouth opening. The lip-funneler (AU22) movement was most salient for discriminations of whimper compared to the lip retraction (AU12). This helps to explain the consistent difficulty subjects had discriminating this expression from the pout in both Experiments 1 and 2, as the pout consists of the single AU22 movement. The additional AU12 movement in the whimper did not appear to help disambiguate these two expressions, probably due to the salience of the AU22 and its function in minimizing the salience of the lip retraction. The most salient feature for the pant-hoot was also the AU22. However, pant-hoot was not confused with the other expressions that also contain an AU22, whimper and pout. The pant-hoot was positioned farther to the left, more negative, side of Dimension 1, because it also contains a jaw-drop, AU26. Subjects appeared able to use the combination of AU22 + 26 in accurately discriminating the pant-hoot. Therefore, individually, the AU22 is a highly salient movement in chimpanzee facial expressions and the presence of some, but not all, other movements can alter the perceived dissimilarity of these expressions.
The AU10 (upper lip raiser) was the most salient movement for discriminations of the bared-teeth display. Despite this movement also being prominent in the scream, the bared-teeth display was most often confusion when paired with other expressions that shared the less salient lip retraction (AU12) movement. Therefore, the overall configuration of movements in the bared-teeth display appeared to weaken the salience of the unique AU10 movement, resulting in confusions between bared-teeth, whimper, and play face1, expressions that all share the AU12.
Finally, the scream contains four AUs, the most of any other expression. Results from this study showed that the most salient features were AU27 and, to a lesser extent, AU10. This can also be confirmed by the presence of the scream on the MDS plot, as it occupied the most negative position along Dimension 1, showing the greatest degree of mouth opening. Moreover, the scream was never confused with the bared-teeth display, indicating that although the AU10 was a salient movement for both expressions, this may be minimized in the presence of the big AU27. Thus, although the presence of an AU12 did little to disambiguate expressions that shared an AU22, a shared AU10 failed to cause any confusion between bared-teeth and screams due to the highly salient AU27.
General Discussion
The results of the four studies presented here provide a detailed understanding of how chimpanzees are able to discriminate among their facial expressions, the general impairment that occur when expressions are inverted, and the importance of component movements in the perceived similarity among different expression categories. Although there appears to be a role for overall configuration in expression discrimination, the general positioning of expressions in the MDS plot in Experiment 3 and the results from the component movement task in Experiment 4, suggest that component movements are critically involved in providing salient information for each expression category, and in helping to disambiguate expressions that overlap in terms of shared critical features. Facial expressions were discriminated using several key features across two main dimensions, one involving the degree of mouth opening and the other involving the lip posture, either puckered or retracted, to expose the teeth. Interesting, both of these dimensions concern the mouth and the shape of the lower face. Compared to humans, chimpanzees have fewer upper face movements and it is possible that the upper face has less salience in facial expression due to the absence of eyebrows on an otherwise hairless face, no white sclera of the eyes, and a thick heavy brow ridge (Vick et al., 2007).
ChimpFACS was then used to identify the movements involved in these key dimensional features, mouth opening or lip pucker/retraction. Through further qualitative analyses, it was revealed that the presence or absence of these movements fully explained the perceived similarity–dissimilarity shown by the chimpanzees when discriminating these major expression categories in the first two experiments. In general, three clusters of expressions were observed that highlighted in which subjects made performance errors, one involving the lip puckering movement from AU22–lip funneler, another involving the degree of lip retraction from AU12–lip corner puller, and a final involving the AU27–mouth stretch.
Although configural information was generally important for chimpanzee facial expression discriminations, the pattern of errors described above suggests that the presence of single movements can have a significant effect on how well expressions are discriminated. These movements can both aid and impede recognition depending on the expressions involved, and they are not always consistent with the individual movements identified by Experiment 4 as being the most salient for that individual category. Therefore, a hierarchy of movement salience can be constructed from the results of these two studies (Experiments 3 and 4). If an expression has a lip retraction or lip pucker, then confusion generally results. In these cases, the degree of mouth opening may help to disambiguate confusion and aid subjects in accurately identifying that expression category. The pant-hoot, for example, can be discriminated from the pout and whimper because of its jaw drop, AU26 (see Figure 7), although pouts and whimpers are consistently and reciprocally confused with one another, due to their shared AU22–lip funneler movement. The whimper, however, contains a lip retraction movement (AU12) but this alone does not appear to aid in disambiguating the AU22 movement that it shares with pout. However, sharing an AU12 movement causes consistent error patterns among a cluster of expression, bared-teeth, whimper, and play face1. In this case, the jaw drop (AU26) in the play face1 is not able to disambiguate the shared AU12. Thus, AU26 disambiguates the AU22 but not the AU12. Moreover, the bared-teeth display contains a variety of other movements including an upper lip raiser (AU10) and a lower lip depressor (AU16), but neither of these appears to have a major impact in helping to disambiguate among the cluster of expressions that share the AU12. The only movement that appears to disambiguate the AU12 is the wide stretched open mouth (AU27), present in both the scream and the play face2, both of which also contain the AU12 but were not confused with any of the other expressions that shared AU12. Therefore, mouth opening only helps to disambiguate expressions that share a lip-pucker movement, although only the wide mouth stretch appears capable of disambiguating the cluster of expressions that share the lip retraction movement.
Among humans, several techniques exist for evaluating the features most important for categorizing prototypical facial expressions. The “bubbles” technique masks visual images so that only randomly placed patches, or bubbles, of information are revealed. These filtered images are then presented to participants over thousands of trials for discrimination (Gosselin & Schyns, 2001). Based on participants' accuracy, the locations of the bubbles in correct trials are summed together and used to create a diagnostic image that reveals the most salient regions of original image. Using this technique, Smith, Cottrell, Gosselin, and Schyns (2005) asked a group of participants, as well as an optimally designed model observer, to discriminate Ekman's six basic facial emotions, fear, anger, happiness, sadness, surprise, and disgust, plus a neutral portrait. Results showed differences in the performance of the human participants and the model observer. The humans did not attend to all the unique features identified by the model as being the best for discriminating among the expressions. Instead, the humans appeared to optimize their viewing so as to best disambiguate redundancy across the expression categories. The authors concluded that participants' decoding processes directed them to attend to the unique characteristics of the images, effectively disambiguating what may be overlapping information. Although this level of detailed computer modeling was not employed in the present studies, and the number of trials necessary for the bubble technique may not make it an effective method for testing in nonhuman primates, the standardized Poser facial expressions enabled the presentation of highly standardized images, precise down to their individual movements. Results showed that even where there were many overlapping features, features that were identical across the images presented, chimpanzees were also able to extract the unique features and overcome many of these redundancies.
Acknowledgments
This investigation was supported by RR–00165 from the NIH/NCRR to the Yerkes National Primate Research Center, and R01–MH068791 to L. A. Parr. The Yerkes National Primate Research Center is fully accredited by the American Association for Accreditation of Laboratory Animal Care. Thanks to Sheila Sterk and Adrienne Tecza for research assistance and the animal care staff at the Yerkes National Primate Research Center. We also thank Darren van Laar for advice on multidimensional scaling.
Contributor Information
Lisa A. Parr, Division of Psychiatry and Behavioral Sciences, Emory University, and Department of Psychology, University of Portsmouth, Portsmouth UK
Bridget M. Waller, Department of Psychology, University of Portsmouth, Portsmouth UK
Matthew Heintz, Yerkes National Primate Research Center.
References
- Burrows AM, Waller BM, Parr LA, Bonar CJ. Muscles of facial expression in the chimpanzee (Pan troglodytes): Descriptive, ecological and phylogenetic contexts. Journal of Anatomy. 2006;208:153–168. doi: 10.1111/j.1469-7580.2006.00523.x. [DOI] [PMC free article] [PubMed] [Google Scholar]
- Calder AJ, Young AW, Keane J, Dean M. Configural information in facial expression perception. Journal of Experimental Psychology: Human Perception and Performance. 2000;26:527–551. doi: 10.1037//0096-1523.26.2.527. [DOI] [PubMed] [Google Scholar]
- Chevalier-Skolnikoff S. Facial expressions of emotion in nonhuman primates. In: Ekman P, editor. Darwin and facial expressions. New York: Academic; 1973. pp. 11–89. [Google Scholar]
- Darwin C. Expression of the emotions in man and animals. New York: Philosophical Library Edition; 1955. Original work published 1872. [Google Scholar]
- Diamond R, Carey S. Why faces are and are not special: An effect of expertise. Journal of Experimental Psychology. 1986;115:107–117. doi: 10.1037//0096-3445.115.2.107. [DOI] [PubMed] [Google Scholar]
- Ekman P. Cross-cultural studies of facial expressions. In: Ekman P, editor. Darwin and facial expressions. New York: Academic; 1973. pp. 169–222. [Google Scholar]
- Ekman P, Friesen WV. Constants across cultures in the face of emotion. Journal of Personality and Social Psychology. 1971;17:124–129. doi: 10.1037/h0030377. [DOI] [PubMed] [Google Scholar]
- Ekman P, Friesen WV. Unmasking the face. Englewood Cliffs, NJ: Prentice Hall; 1975. [Google Scholar]
- Ekman P, Friesen WV. Facial Action Coding System. Palo Alto, CA: Consulting Psychology Press; 1978. [Google Scholar]
- Ekman P, Rosenberg E, editors. What the face reveals. New York: Oxford University Press; 1997. [Google Scholar]
- Everitt BS, Dunn G. Applied multivariate data analysis. London: Arnold; 2001. [Google Scholar]
- Goodall J. The chimpanzees of Gombe: Patterns of behavior. Cambridge, MA: Belknap Press of Harvard University Press; 1986. [Google Scholar]
- Gosselin F, Schyns PG. Bubbles: A new technique to reveal the use of visual information in recognition tasks. Vision Research. 2001;41:2261–2271. doi: 10.1016/s0042-6989(01)00097-9. [DOI] [PubMed] [Google Scholar]
- Gothard KM, Erickson CA, Amaral DG. How do rhesus monkeys (Macaca mulatta) scan faces in a visual paired comparison task? Animal Cognition. 2004;7:25–36. doi: 10.1007/s10071-003-0179-6. [DOI] [PubMed] [Google Scholar]
- Howell DC. Statistical methods for psychology. 5th. Belmont, CA: Duxbury; 2002. [Google Scholar]
- Kanazawa S. Recognition of facial expressions in a Japanese monkey. Primates. 1996;37:25–38. [Google Scholar]
- Marler P. Social organization, communication, and graded signals: The chimpanzee and the gorilla. In: Bateson PPG, Hinde RA, editors. Growing points in ethology. London: Cambridge University Press; 1976. pp. 239–279. [Google Scholar]
- Martinez AM, Benavente R. The AR face database. West Lafayette, IN: Purdue University; 1998. CVC Tech. Rep. No. 24. [Google Scholar]
- Maurer D, Le Grand R, Mondloch CJ. The many faces of configural processing. Trends in Cognitive Science. 2002;6:255–260. doi: 10.1016/s1364-6613(02)01903-4. [DOI] [PubMed] [Google Scholar]
- Nahm FKD, Perret A, Amaral DG, Albright TD. How do monkeys look at face? Journal of Cognitive Neuroscience. 1997;9:611–623. doi: 10.1162/jocn.1997.9.5.611. [DOI] [PubMed] [Google Scholar]
- Parr LA. Perceptual biases for multimodal cues in chimpanzee affect recognition. Animal Cognition. 2004;7:171–178. doi: 10.1007/s10071-004-0207-1. [DOI] [PubMed] [Google Scholar]
- Parr LA, Cohen M, de Waal FBM. The influence of social context on the use of blended and graded facial displays in chimpanzees (Pan troglodytes) International Journal of Primatology. 2005;26:73–103. [Google Scholar]
- Parr LA, Dove T, Hopkins WD. Why faces may be special: Evidence for the inversion effect in chimpanzees (Pan troglodytes) Journal of Cognitive Neuroscience. 1998;10:615–622. doi: 10.1162/089892998563013. [DOI] [PubMed] [Google Scholar]
- Parr LA, Heintz M. The perception of unfamiliar faces and houses by chimpanzees: Influence of rotational angle. Perception. 2006;35:1473–1483. doi: 10.1068/p5455. [DOI] [PubMed] [Google Scholar]
- Parr LA, Hopkins WD, de Waal FBM. The perception of facial expressions in chimpanzees (Pan troglodytes) Evolution of Communication. 1998;2:1–23. [Google Scholar]
- Parr LA, Waller BM. Understanding chimpanzee facial expressions: Insights into the evolution of communication. Social Cognitive and Affective Neuroscience. 2006;1:221–228. doi: 10.1093/scan/nsl031. [DOI] [PMC free article] [PubMed] [Google Scholar]
- Parr LA, Waller BM, Vick SJ, Bard KA. Classifying chimpanzee facial expressions using muscle action. Emotion. 2007;7:172–181. doi: 10.1037/1528-3542.7.1.172. [DOI] [PMC free article] [PubMed] [Google Scholar]
- Parr LA, Winslow JT, Hopkins WD, de Waal FBM. Recognizing facial cues: Individual recognition in chimpanzees (Pan troglodytes) and rhesus monkeys (Macaca mulatta) Journal of Comparative Psychology. 2000;114:47–60. doi: 10.1037/0735-7036.114.1.47. [DOI] [PMC free article] [PubMed] [Google Scholar]
- Preuschoft S, van Hooff JARAM. Homologizing primate facial displays: A critical review of methods. Folia Primatologica. 1995;65:121–137. doi: 10.1159/000156878. [DOI] [PubMed] [Google Scholar]
- Riesenhuber M, Jarudi I, Gilad S, Sinha P. Face processing in humans is compatible with a simple shape-based model of vision. Proceedings of Biological Sciences. 2004;271(suppl 6):S448–450. doi: 10.1098/rsbl.2004.0216. [DOI] [PMC free article] [PubMed] [Google Scholar]
- Slocombe K, Zuberbuhler K. Agonistic screams in wild chimpanzees (Pan troglodytes schweinfurthii) vary as a function of social role. Journal of Comparative Psychology. 2005;119:67–77. doi: 10.1037/0735-7036.119.1.67. [DOI] [PubMed] [Google Scholar]
- Smith ML, Cottrell GW, Gosselin F, Schyns PG. Transmitting and decoding facial expressions. Psychological Science. 2005;16:184–189. doi: 10.1111/j.0956-7976.2005.00801.x. [DOI] [PubMed] [Google Scholar]
- Valentine T. Upside-down faces: A review of the effects of inversion upon face recognition. British Journal of Psychology. 1988;79:471–491. doi: 10.1111/j.2044-8295.1988.tb02747.x. [DOI] [PubMed] [Google Scholar]
- van Hooff JARAM. The facial displays of the Catarrhine monkeys and apes. In: Morris D, editor. Primate ethology. Chicago: Aldine; 1967. pp. 7–68. [Google Scholar]
- van Hooff JARAM. A comparative approach to the phylogeny of laughter and smiling. In: Hinde RA, editor. Nonverbal communication. Cambridge, England: Cambridge University Press; 1972. [Google Scholar]
- Vick SJ, Waller BM, Parr LA, Pasqualini-Smith M, Bard KA. A cross species comparison of facial morphology and movement in humans and chimpanzees using FACS. Journal of Nonverbal Behavior. 2007;31:1–20. doi: 10.1007/s10919-006-0017-z. [DOI] [PMC free article] [PubMed] [Google Scholar]
- Wallbott HG, Ricci-Bitti P. Decoders' processing of emotional facial expression - a top-down or bottom-up mechanism? European Journal of Social Psychology. 1993;23:427–443. [Google Scholar]
- Waller B, Dunbar RIM. Differential behavioural effects of silent bared teeth display and relaxed open mouth display in chimpanzees (Pan troglodytes) Ethology. 2005;111:129–142. [Google Scholar]
- Waller BM, Vick SJ, Parr LA, Bard KA, Pasqualini-Smith M, Gothard KM, et al. Intramuscular electrical stimulation of facial muscles in humans and chimpanzees: Duchenne revisited and extended. Emotion. 2006;6:367–382. doi: 10.1037/1528-3542.6.3.367. [DOI] [PMC free article] [PubMed] [Google Scholar]
- Yin RK. Looking at upside-down faces. Journal of Experimental Psychology. 1969;81:141–145. [Google Scholar]