

Abstract
Expression of the antiapoptotic protein survivin is associated with cancer cell viability and drug resistance. Thus, control of its expression in cancer cells has significant consequences for cancer therapeutics. Here we have shown that hedamycin, a GC-rich DNA binding drug, down-regulated survivin expression. Using a series of survivin promoter-luciferase constructs, we have identified an 86-bp GC-rich DNA element (−124 to −39) that mediates the ability of hedamycin to down-regulate survivin expression. Furthermore, both in vivo foot-printing and in vitro gel mobility shift experiments revealed that hedamycin bound to a 21-bp GC-rich DNA element (−115 to −95) in the survivin promoter. This drug-DNA interaction abrogated the binding of Sp-1 or Sp1-like proteins to the 21-bp cis-acting DNA element, and mutagenesis of this region consistently diminished survivin promoter activity. Finally, down-regulation of survivin transcription by hedamycin modulated the viability of cancer cells. These data suggest that abrogation of Sp-1 or Sp1-like protein binding to the 21-bp DNA element in the survivin promoter contributes at least in part to the inhibitory effect of hedamycin on survivin gene transcription. Drug-induced modulation of survivin gene expression may provide novel approaches for cancer therapeutics.
Survivin is a unique member of the inhibitor of apoptosis family of proteins (1–4). It is highly expressed in various cancers but is undetectable in most normal adult tissues (5). Current studies indicate that the expression of survivin in cancer cells is associated with cancer progression, poor prognosis, drug resistance, and short patient survival (3). Functionally, survivin is involved in the control of apoptosis (6) and the regulation of cell division (7). Consistent with the dual functions of survivin, there are two pools (cytoplasmic and nuclear) of survivin associated with distinct subcellular components (8). Moreover, the expression of survivin is cell cycle-regulated with a robust increase in G2/M (6, 9). It has been demonstrated that inhibition of survivin expression or interference of survivin function, including survivin antisense oligonucleotides (7, 10–15) or survivin antisense expression vectors (16–21), RNA interference (22), ribozymes (23–26), triplex DNA formation (27), survivin dominant-negative mutants (7, 21, 28), and pharmacological inhibitors of Cdc2 (29, 30), induces cancer cell death. Thus, survivin appears to be an important cancer therapeutic target, and modulation of survivin expression and/or function may provide rational approaches for cancer therapeutics.
One of the major strategies for modulating survivin expression is control of its transcription. We and others have previously demonstrated that doxorubicin-induced cancer cell death is at least in part involved in the transcriptional inhibition of survivin through doxorubicin stabilization of p53 proteins (31– 33). However, it is not known whether small sequence-selective DNA binding anticancer agents could modulate survivin expression by binding to the survivin promoter region and regulating promoter activity. Also, it is not known whether the modulation of survivin transcription by certain DNA binding drugs plays a role in drug action mechanism associated with induction of tumor cell death. Answers to these questions could lead to the development of novel approaches to control survivin transcription for new cancer therapeutic strategies.
In this report, we investigated the molecular specificity of a GC-rich sequence-selective DNA binding drug, hedamycin. We found that hedamycin down-regulates survivin transcription by engaging an 86-bp GC-rich element (−124 to −39) in the survivin core promoter region and by preventing accessibility of this sequence to Sp1 or Sp1-like proteins involved in transcription. Functionally, hedamycin-induced down-regulation of survivin resulted in enhanced apoptosis of tumor cells.
EXPERIMENTAL PROCEDURES
Cell Culture and Reagents
Cells from human colon cancer (HCT116) and cervical epithelial carcinoma (HeLa) were maintained in RPMI1640 and DMEM,1 respectively, supplemented with 10% fetal bovine serum (Mediatech Cellgro, Herndon, VA), 100 units/ml of penicillin, and 0.1 μg/ml of streptomycin (Invitrogen) in a humid atmosphere incubator with 5% CO2 at 37 °C. Cells were routinely subcultured twice weekly. The antisurvivin antibody (FL-142), a polyclonal rabbit IgG antibody generated by immunizing rabbits with the full-length survivin protein, was purchased from Santa Cruz Biotechnology (Santa Cruz, CA). Hedamycin was obtained from the NCI, National Institutes of Health. Propidium iodide, dimethyl sulfate (DMS), piperidine, monoclonal antiactin antibody, and goat peroxidase-conjugated antirabbit IgG antibody were purchased from Sigma. The dual-luciferase reporter assay system and T4 DNA ligase were purchased from Promega (Madison, WI). Vent DNA polymerase and restriction enzymes were from New England Biolab (Beverly, MA). Oligotransfectamine™ reagent and Lipofectamine™ 2000 reagents were purchased from Invitrogen.
Western Blot
In all experiments, cells were treated with hedamycin in the presence of complete medium containing 10% serum. Western blot analysis of survivin and actin expression was performed as described previously (34). Signals were detected using a horseradish peroxidase visualization system kit (National Diagnostics/LPS, Rochester, NY) and visualized by autoradiography after various exposure times (20–120 s).
Total RNA Isolation and Northern Blot
Cells both with and without hedamycin treatments were used to isolate total RNAs. The mRNAs for survivin and glyceraldehydes 3-phosphate dehydrogenase were determined by Northern blot analysis as described previously (35).
Vector Transfection and Luciferase Reporter Assay
HeLa cells were seeded in 24-well plates (5 × 10⁴/well) and grown to ~50–60% confluence for transfection. Each of the relevant survivin promoter-luciferase constructs (36) was cotransfected with pRL-TK (TK promoter-Renilla luciferase construct, internal control) into HeLa cells. Briefly, 490 ng of a pLuc-survivin construct and 10 ng of pRL-TK in 50 μl of serum-free DMEM were mixed with 1.5 μl of Lipofectamine™ in 50 μl of serum-free DMEM in a 1.5-ml tube for each well of 24-well plates. After incubation at room temperature for 20–25 min, the DNA/Lipofectamine mixture was added to each well containing 200 μl of serum-free DMEM. Following incubation for 2–3 h, the DNA-Lipofectamine complex was replaced by complete medium containing 10% serum. Cells were treated with hedamycin 24 h after transfection and processed for luciferase assays 8–24 h after drug treatment. For the luciferase assay, a dual-luciferase reporter assay system (Promega) was used. The transfected cells in 24-well plates were washed with PBS and lysed with 1× passive lysis buffer (up to 200 μl/well) on a shaker for up to 1 h at 4°C. Cell lysate (20 μl/well) was used for measurement of luciferase activities in a luminometer by first mixing the cell lysate (20 μl) with 20 μl of luciferase assay reagent for measuring firefly luciferase activity and subsequently adding 20 μl of Stop-Glo reagent for measuring Renilla luciferase activity. Data were normalized to Renilla luciferase activity (internal control) as arbitrary units.
Contiguously Nested Deletion of the Survivin Promoter Luciferase Construct
Contiguous deletion of bases from 230 to 86 in pLuc-230c was carried out using an Erase-a-Base system (Promega). Briefly, pLuc-230c (100–150 μg/ml) was completely digested with SalI, filled in with 50 units of Klenow DNA polymerase/ml (Promega), and blocked with 40 μM α-phosphorothioate dNTP/1 mM dithiothreitol for 10 min at 37 °C. After heat inactivation of the enzyme for 10 min at 70 °C, the end-blocked DNA was phenol-extracted, ethanol-precipitated, and digested with BamHI, followed by a second phenol extraction and quantification. Digested DNA (5 μg) was incubated at 25 °C in 60 μl of Exo III digestion buffer containing 66 mM Tris/HCl (pH 8.0), 0.66 mM MgCl2, and 400 units of exonuclease III. Aliquots (2.5 μl) from the above solution were mixed with the S1 digestion buffer (7.5 μl) containing 40 mM potassium acetate (pH 4.6), 340 mM NaCl, 1.35 mM ZnSO3, 7% glycerol, and S1 nuclease (300 units/ml) every 15–30 s/time point. The aliquot mixtures from each time point were incubated for 30 min at 22 °C, stopped with 1 μl of 0.3 M Tris base and 0.05 M EDTA, and heat-inactivated for 10 min at 70 °C. Contiguously deleted DNA samples at each time point were blunted with 100–150 units of Klenow/ml for 10 min at 37 °C and religated in a buffer containing 50 mM Tris/HCl (pH 7.6), 10 mM MgCl2, 1mM ATP, 5% polyethylene glycol, 1 mM dithiothreitol, and 5 units of T4 ligase/ml at 16 °C overnight. Competent Escherichia coli cells were subsequently transformed with the religated contiguously deleted DNA samples by electroporation. The clones carrying progressive deletions from the 5′-end were identified by PCR amplification of 10–20 colonies from each time point. The exact deletion end in each clone containing the expected size was determined by sequencing.
In Vivo Footprinting by Ligation-mediated Polymerase Chain Reaction (LM-PCR)
The LM-PCR method utilized was largely based on the Mueller and Wold protocol (48) with modifications. Briefly, (i) HeLa cells grown in 15-cm plates with or without hedamycin treatment were permeabilized for 2–4 min with 24 ml of PBS containing 24 μl of DMS, followed by gentle washing of each plate three times for 20–40 s/wash with 20 ml of PBS. Cells were then lysed with 1.5 ml of lysis solution (NaCl 300 mM, Tris 50 mM, pH 8.0, EDTA 25 mM, SDS 0.2%, and proteinase K 0.2 mg/ml). The resultant lysates were incubated at 37 °C for 3–16 h and extracted four times with equal volumes of phenol/chloroform/isoamyl alcohol (25:24:1). The genomic DNA in the super-natant was precipitated with an equal volume of isopropanol, redissolved overnight in 2 ml of TE buffer (Tris 10 mM, pH 8.0, EDEA 1 mM)/plate, and precipitated with 2 volumes of 100% ethanol in the presence of 0.3 M NaAc. The DNA was then redissolved in 200 μl of TE and adjusted to a concentration of 0.5–2 μg. (ii) DNA (125 μg in 175 μl of TE) isolated from cells without drug treatment was mixed with 25 μl of 1% DMS in dH2O for 2–4 min and quenched with 50 μl of cold DMS stop solution (1 M β-mercaptoethanol and 1.5 M NaAc, pH 7.0). Next, DNA (100–200 μg in 200 μl of TE) from cells treated with hedamycin was similarly mixed with 50 μl of cold DMS stop solution. DNA from each reaction was then precipitated by adding 750 μl of cold 100% ethanol and washed with cold 75% ethanol. (iii) The DNA was dissolved in 1 M piperidine for 15 min, incubated at 90 °C for 30 min, frozen on dry ice, and evaporated for 1–2 h in a SpeedVac. DNA was precipitated in 400 μl of TE containing NaAc (0.3 M) by adding 2 volumes of 100% ethanol and then precipitated a second time in 650 μl of TE containing NH4Ac (2.5 M) by adding equal volumes of isopropanol. After washing with 500 μl of 75% ethanol, DNA was resuspended in 50 μl of dH2O, dried in a SpeedVac, and redissolved in TE to a concentration of 0.4–0.6 μg/μl for LM-PCR. (iv) LM-PCR: 20 μM each of the two linker primers, LM25 (5′-GCG GTG ACC CGG GAG ATC TGA ATT C-3′) and LM11 (5′-GAA TTC AGA TC-3′), were annealed. Three μg of DNA template/reaction were used for the first strand synthesis with gcFP1 or hRP1 (refer to Fig. 4 for sequence information) and Vent DNA polymerase, followed by ligation of the annealing linker primer to the first strand DNA at 16 °C overnight using T4 DNA Ligase. The ligated DNA in each reaction was precipitated with ethanol in the presence of 0.3 M NaAc and 10 μg of yeast tRNA and washed with 70% ethanol. This DNA was used as templates for PCR using LM25 and gcFP2 or hRP2 (refer to Fig. 4) with Vent DNA polymerase for 21 PCR cycles, followed by two additional PCR cycles after adding [γ-32P]ATP-labeled gcFP3 or hRP3. The DNA in each reaction was extracted using an equal volume of phenol:chloroform:isoamyl alcohol, and the supernatant was evenly divided into three tubes. The DNA in each tube was precipitated with 2–3 volumes of 100% ethanol, washed with 70% ethanol, and air dried for 10 min. Each of the samples was then resuspended in 4–8 μl of loading buffers and denatured at 90 °C for 3–4 min. We ran 2–3 μl of each sample on a 6% PAGE gel along with 32P-labled ϕX174 DNA/Hinf I markers.
Fig. 4. The in vivo LM-PCR footprinting experiment revealed that a DNA element containing a 21-bp sequence was sensitive to in vivo DMS-mediated piperidine digestion after hedamycin treatment.

A, positions of primers used in the LM-PCR experiment are shown, and the 21-bp DNA sequence is in bold letters and underlined. B, in vivo footprinting by LM-PCR. Lane 1, arrows denote bands sensitized by hedamycin in the range of the 21-bp DNA element in the in vivo footprinting. HeLa cells were treated overnight with (lane 1) or without (lane 2) 0.2 μM hedamycin and processed by in vivo DMS-mediated piperidine digestion as described under “Experimental Procedures.” Lane 3 shows in vitro controls from direct DMS-mediated piperidine digestion of isolated untreated HeLa genomic DNA. Positions of the 21-bp sequence region and the sensitized bands from forward (gcFP3) and reverse (hsRP3) directions in the LM-PCR are indicated.
Isolation of HeLa Cell Nuclear Extracts
HeLa cells at ~90% confluence were scraped into ice-cold PBS and collected into conical tubes. After centrifuging the tube at 1,800–2000 × g at 2 °C for 15 min, the cell pellets were gently resuspended with 3× pellet cell volume of ice-cold buffer A without Triton X-100 (10 mM HEPES, PH 7.9, 1.5 mM MgCl2, 10 mM KCl, 1 mM phenylmethylsulfonyl fluoride, 100 kallikrein-inactivating units/ml aprotinin, and 1 mM dithiothreitol). Cells were then pelleted as above and resuspended in 3× pellet cell volume of ice-cold buffer A with 0.1% Triton X-100 (w/v). The resuspended cells were allowed to swell for 12–15 min on ice. Cell nuclei were then collected by centrifugation (3440 × g) for 15 min at 2 °C and resuspended with 1× packed nuclei volume in ice-cold buffer C (20 mM HEPES, pH 7.9, 25% glycerol, 0.42 M NaCl, 1.5 mM MgCl2, 0.2 mM EDTA, 1 mM phenylmethylsulfonyl fluoride, 100 kallikrein-inactivating units/ml aprotinin, and 1 mM dithiothreitol). The cell nuclei suspension was incubated on ice (~2 °C) for 30 min with continuous mixing. The nuclear extracts (supernatant) were collected by centrifugation at 25,000 × g for 30 min at 2 °C. The nuclear extracts were aliquoted (50–100 μl/each 1.5-ml tube), frozen in liquid nitrogen, and then stored at −80 °C for EMSA experiments.
Electrophoretic Gel Mobility Shift Assay (EMSA)
Oligonucleotides (probes) were labeled at the 5′-end with [γ-32P]ATP using T4 polynucleotide kinase. Nuclear extracts (8–15 μg) were preincubated in the binding buffer (20 mM HEPES, PH 7.9, 25 mM NaCI, 5 mM MgCI2, 0.1 mg/ml bovine serum albumin, 10% glycerol, 0.1 mM EDTA, 2 mM spermidine, 2 mM dithiothreitol, 12.5 μg/ml poly(dI-dC), 12.5 μg/ml thymus DNA) for 20 min at 25 °C in a volume of 19 μl with and without an excess of unlabeled oligonucleotide competitors in the presence or absence of hedamycin. After addition of 1 μl of labeled DNA (1–2 × 10⁵ cpm), the mixture was incubated for an additional 20 min at 25 °C. Each reaction mixture was then loaded into the well of a 4% nondenaturing polyacrylamide gel and electrophoresed at 200 V in 1× TBE buffer (Tris-borate, 90 mM, EDTA 1 mM) at 25 °C for 1–2 h. To determine the direct interaction of the 21-bp DNA element (refer to Fig. 4 for sequence information) with hedamycin, the reaction was run on a 12 instead of a 4% non-denaturing polyacrylamide gel. Gels were dried and visualized by autoradiography. The typical sequence for Sp-1 binding used in this study is 5′-ATT CGA TCG GGG CGG GGC GAG C-3′.
Generation of pLuc-230CDE3m
PLuc-230CDE3m, in which the 21-bp element (CDE3W) contains point mutations (lower case letters in the CDE3m primer), was generated as follows. Using pLuc-230 as templates, the 230CDE3M PCR fragment was amplified using a pair of primers, hscyc-1 (5′-CGC GGATCC GCG TTC TTT GAA AGC AGT C-3′ (BamHI underlined) and CDE3m (5′-CCC AAGCTT AAA TCT GGC GGT TAA TGG CGC GCC GCG GGG CAT GTC GGG AGC GCA CGC CCT CTT AGG CGG TCa cCC CCC ata GGC CTT CTG-3′ (HindIII underlined and the 21-bp element in bold). After being digested with BamHI and HindIII, the PCR fragment was cloned into the pLuc luciferase reporter vector at the BamHI and HindIII sites in the correct orientation upstream of the luciferase reporter gene. The obtained clones were characterized by BamHI and HindIII digestion and then confirmed by sequencing.
Transfection of the Survivin Expression Vector and Cell Death Assay
The expression vector for survivin has been characterized previously (6, 17). HeLa cells were seeded in 12-well plates (1 × 10⁵/well) for fluorescence microscopy studies or in 6-well plates (3 × 10⁵/well) for flow cytometry analysis. Cells at ~40–50% confluence were transfected with pEGFPc1 (control vector, Clontech) or survivin expression vector pEGFPc1-survivin (pG-survivin). Briefly, 1 μg(3 μg for 6-well plates) of vector DNA in 100 μl (300 μl for 6-well plates) of serum-free DMEM was mixed with 3 μl (9 μl for 6-well plates) of Lipofectamine™ 2000 in 100 μl (300 μl for 6-well plates) of serum-free DMEM in a 1.5-ml tube for each well of a 12-well plate. After the mixture was incubated at room temperature for 20–40 min, the DNA-Lipofectamine™ 2000 mixture was added to each well containing 300 μl of the cell culture medium. The DNA-Lipofectamine™ 2000 complex was replaced by complete medium containing 10% serum after incubation for 6 h. Cells were treated with hedamycin overnight 24 h after transfection. Cells were then fixed with 4% paraformaldehyde containing 0.25% Triton X-100 for 10 min, mounted using mounting solution containing 0.05% 4′,6-diamidino-2-phenylindole, and sealed with round cover glasses. For flow cytometry, cells from the 6-well plates were harvested by trypsinization and washed with PBS. Cells were fixed in 5 ml of 70% ethanol for 30 min and resuspended in 0.5 ml of PBS containing 25 μg/ml propidium iodide and 40 μg/ml RNase A for 30–45 min on ice. Cells were then analyzed by flow cytometry (FACScan; BD Biosciences) by counting 10,000 cells/sample with and without gating EGFP fluorescence. Data from flow cytometry were analyzed using WinList software (Verity Software House Inc., Topsham, ME). Parallel triplicate assays were performed.
Statistical Analysis
We performed a pair-wise comparison of each experimental group with a control group after checking to make sure the data were approximately normal. When necessary we applied a square-root transformation to conform the residuals to approximately normal. We employed a two-group t test assuming equal variance. The significance levels quoted are two-tailed, and significance (p value) was set at the nominal level of 0.05.
RESULTS
Hedamycin Down-regulates Survivin Expression and Promoter Activity
We investigated the ability of hedamycin, a GC-rich DNA-selective binding drug to affect expression levels of the mitotic regulator and apoptosis inhibitor, survivin. Treatment of cancer cell lines including HeLa (Fig. 1A) and HCT116 (Fig. 1B) with hedamycin resulted in significant inhibition of survivin expression. Comparable concentrations of hedamycin were associated with dose-dependent loss of cancer cell viability, imaged under a phase-contrast microscope (Fig. 1C). Hedamycin treatment was also associated with down-regulation of survivin mRNA expression (Fig. 2A), suggesting a transcriptional mechanism for the modulation of survivin expression. Accordingly, luciferase reporter assay experiments revealed that hedamycin also decreased survivin promoter activity (Fig. 2B).
Fig. 1. Hedamycin inhibits expression of survivin protein.
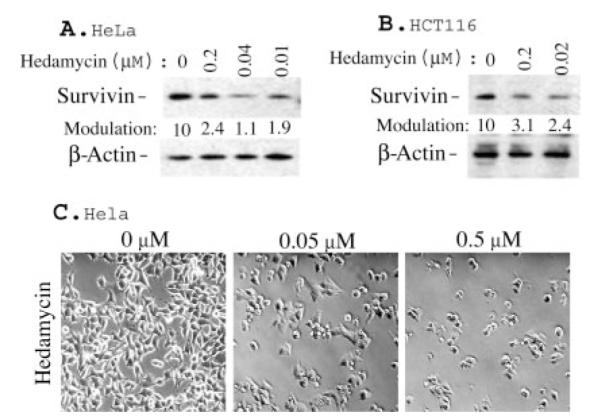
A and B, HeLa and HCT116 cells were treated with hedamycin as indicated for 20 h. Survivin expression was determined by Western blotting. β-Actin expression provided an internal control for the total amount of protein loading. The quantitated data for survivin modulation are shown at the bottom of each lane after normalization to the corresponding β-actin control levels. C, effects of hedamycin on cell growth inhibition and cell death induction. Equal numbers of HeLa cells were seeded in 6-well plates and treated with or without hedamycin for 48 h. Cell densities and morphologies were photographed under a phase-contrast microscope.
Fig. 2. Hedamycin down-regulates survivin mRNA expression and its promoter activity.
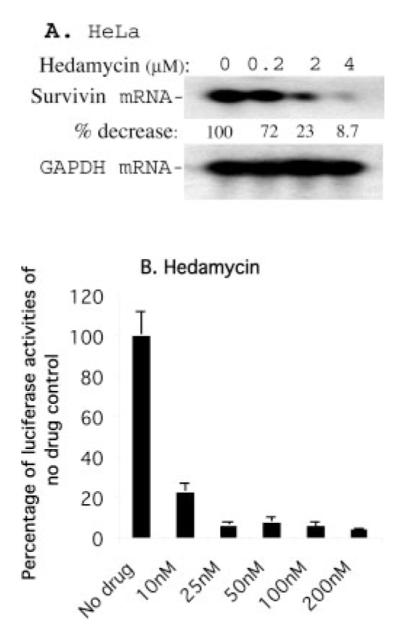
A, HeLa cells were treated as shown. Subsequently, survivin mRNA expression was determined by Northern blotting. Glyceraldehydes 3-phosphate dehydrogenase mRNA expression was an internal control for total RNA loading. B, HeLa cells were transfected with a survivin promoter-luciferase construct, pLuc-6270, and the internal control vector, pRL-TK. Cells were then treated with hedamycin for 16 h as indicated, followed by measurement of luciferase activity using a dual luciferase reporter system as described under “Experimental Procedures.” Data were derived from a representative experiment in triplicate after normalization to Renilla luciferase activity (internal controls) and are shown in a histogram as percentages. Each bar is the mean ± S.D.
An 86-bp Cis-acting DNA Element within the 230-bp Survivin Core Promoter Mediates the Inhibitory Effect of Hedamycin on Survivin Transcription
To characterize the mechanism by which hedamycin down-regulates survivin promoter activity, a series of truncated survivin promoter-luciferase constructs characterized previously (36) were transfected into HeLa cells and analyzed for transcriptional activity after treatment with hedamycin for up to 24 h. As shown in Fig. 3A, a 230-bp survivin core promoter region was sufficient to recapitulate the inhibitory effect of hedamycin on survivin gene expression. Next, we narrowed the minimal responsive region in the survivin promoter using a set of contiguous deletion constructs derived from the 230-bp core promoter region. In these experiments, a cis-acting DNA element involved in hedamycin-mediated transcriptional repression was functionally mapped to an 86-bp GC-rich DNA fragment (from −124 to −39) (Fig. 3B). Further deletion of the 86-bp promoter region revealed a significant loss of promoter activity (not shown), which was not further investigated for hedamycin-dependent modulation.
Fig. 3. A cis-acting DNA element (86 bp) between −124 and −39 plays a major role in hedamycin-mediated inhibition of survivin promoter activities.
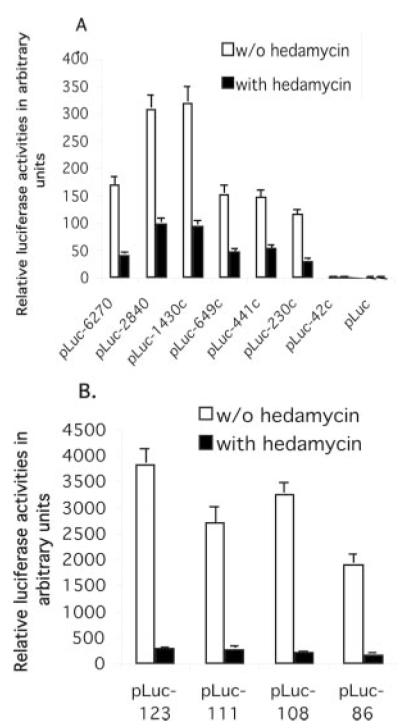
HeLa cells were transfected with various survivin promoter-luciferase constructs as shown and treated with or without hedamycin (20 nM) 24 h after transfection, followed by luciferase activity assays. A, the inhibitory effect of hedamycin on survivin transcription was mapped to the survivin core promoter region (230 bp). B, an 86-bp cis-acting DNA element from −124 to −39 was identified as playing a major role in hedamycin-mediated inhibition of survivin promoter activity. HeLa cells were transfected with a set of newly generated survivin promoter-luciferase constructs and treated with or without hedamycin 24 h after transfection. Cells were lysed and luciferase activity was determined 16 h after drug treatments. Luciferase activity was normalized to Renilla luciferase and shown in arbitrary units in a histogram. Each bar is the mean ± S.D. from a representative experiment in triplicate.
A 21-bp DNA Motif within the Functionally Identified 86-bp DNA Fragment Is at Least in Part Involved in the Inhibitory Effect of Hedamycin on Survivin Expression
To investigate whether a cis-acting DNA element was responsible for hedamycin-mediated down-regulation of survivin gene expression, we employed an in vivo LM-PCR footprinting approach (Fig. 4). In these experiments, a DNA element containing a 21-bp DNA motif (Fig. 4, A and B) exhibited sensitivity to DMS-mediated piperidine digestion, implying that the binding of hedamycin to DNA changed the property of DNA-protein interactions with enhanced access of naked DNA to DMS. Consistent with this hypothesis, EMSA experiments revealed that hedamycin directly bound to the 21-bp DNA probe (Fig. 5, A and B) and that the protein-DNA interaction in the 21-bp DNA element (CDE3W1 from −115 to −95) was decreased in the presence of hedamycin (Fig. 6A). In parallel experiments, the CDE3W1-protein complex was competed out by Sp-1 but not by Gfi-1 DNA oligonucleotides, an AT-rich DNA competitor (Fig. 6B), suggesting that Sp-1 or Sp-1-like proteins were involved in binding to the 21-bp element.2 To further characterize the specificity of the observed DNA binding element, targeted mutagenesis experiments were carried out. As shown in Fig. 7, point mutations within the 21-bp DNA element in the survivin core promoter luciferase construct (pLuc-230) resulted in reduced survivin promoter activity (Fig. 7). In addition, a bioinformatic search of the human genome revealed that the 21-bp GC-rich motif was highly conserved (≥14 bp) in the putative promoter region of seven human genes as well as in the first intron of an additional seven human genes (see “Discussion”), suggesting a potential role of this DNA element in broader mechanisms of transcriptional regulations.
Fig. 5. Based upon EMSA, hedamycin directly binds to the 21-bp DNA probe.

A, the structure of hedamycin. Note: hedamycin has 9 net negative charges, which should enhance DNA-drug complex mobility after binding to DNA. B, lanes 1– 4, the 21-bp DNA probes (CDE3W1) in the absence (lane 1) or presence (lanes 2– 4, 1, 10, 100×) of hedamycin were run on a 12% non-denatured PAGE gel. The significant increases of the negative charges in the CDE3W1-hedamycin complex (enhance mobility) neutralized the mobility retardation resulting from the increased molecular size of the DNA-hedamycin complex (lanes 3 and 4). This is in strikingly contrast to an AT-rich DNA probe that showed marked mobility retardation after binding to a positive charged drug (not shown).
Fig. 6. Characterization of DNA-protein interaction by EMSA experiments.
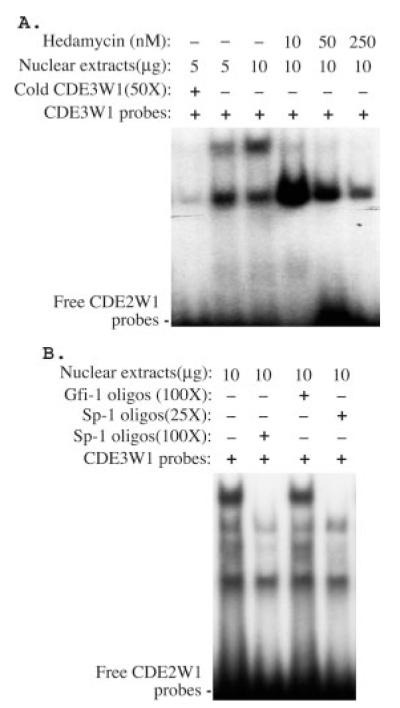
A, the binding of hedamycin to the 21-bp DNA element (CDE3W1) decreased its interaction with nuclear proteins. The combination of CDE3W1 probe with nuclear extracts, hedamycin, and specific DNA competitors (cold CDE3W1) are shown. B, Sp-1 (lanes 2 and 4), but not Gfi-1 (lane 3) DNA oligonucleotides, an AT-rich DNA competitor, competed with the CDE3W1-protein complex.
Fig. 7. Survivin core promoter-driven luciferase activity was decreased by point mutations in the CDE3W1 element.

PLuc-230 and pluc-230CDE3m were transfected into HeLa cells. Luciferase activity was determined 48 h after transfection. Data were processed as described in Fig. 2. Bars are the means ± S.D. from a representative experiment performed in triplicate.
Forced Expression of Survivin Diminishes the Effect of Hedamycin on the Induction of Cell Death
To determine whether hedamycin-mediated down-regulation of survivin expression played a role in drug-induced cell death, we expressed survivin in HeLa cells and analyzed changes in hedamycin-induced cell death. In these experiments, transfection of survivin effectively counteracted hedamycin-induced cell death as compared with pEGFPc1 vector-transfected cells (Fig. 8, A and B). The role of survivin in hedamycin-induced cell death was further confirmed by propidium iodide staining and flow cytometry. Exogenous expression of survivin decreased the fraction of HeLa cells exhibiting hypodiploid, i.e. apoptotic DNA contents in response to hedamycin treatment as compared with pEGFPc1 vector-transfected cells (Fig. 8, C and D).
Fig. 8. Exogenous expression of survivin in cancer cells protects cells from apoptosis induced by hedamycin.

A, HeLa cells were transfected with pEGFPc1 control vector and survivin expression vector. Cells were treated overnight with or without hedamycin (50 nM) 24 h after transfection. Cells were then fixed and stained with 4′,6-diamidino-2-phenylindole. Apoptotic cells were evaluated morphologically under a fluorescence microscope. Examples of dead (upper panel) and live (lower panel) cells are shown with arrows. B, the histogram is the relative percentage of cell death under each condition (the EGFP vector-transfected cells with hedamycin treatment were set at 100) based upon the dead cells versus total green cells in four independent microscopic fields. Each bar is the mean ± S.D. C, HeLa cells were transfected and treated as in panel A in 6-well plates. Cells were then processed for flow cytometry. As shown, exogenous expression of survivin decreased sub-G1 DNA contents (dead cells) and accordingly increased S and G2/M cells. D, the histogram shows the relative cell death after hedamycin treatment derived from two independent flow cytometry experiments in triplicate. Each bar is the mean ± S.D. The p values are indicated (B and D).
DISCUSSION
Although many studies have recently focused on characterizing the role of various sequence-selective DNA binding drugs for their ability to inhibit DNA replication (37–39), little is known about how these drugs regulate gene transcription and whether gene transcription inhibition contributes to cell growth inhibition and/or cell death. Moreover, it is not known whether survivin plays a role in mediating induction of cell death by these types of drugs. In this study, we characterized the effects of hedamycin on the regulation of survivin gene expression. We found that hedamycin exhibits strong inhibitory effects on survivin protein, mRNA, and promoter activity (Figs. 1 and 2) and that this pathway contributes, at least in part, to hedamycin-mediated cancer cell death and antitumor activity.
We and others have previously demonstrated that the cancer therapeutic drug doxorubicin down-regulates survivin expression by a transcriptional mechanism (31–33). However, the transcriptional repression of survivin by doxorubicin occurs via an indirect mechanism that involves stabilization of p53. Enhanced p53 protein, in turn, binds to the p53-binding site within the survivin core promoter region to suppress its transcription via a trans-acting mechanism for drug action. However, whether DNA binding agents can directly modulate survivin transcription through a cis-acting mechanism had not been previously demonstrated. In this study, we utilized the sequence-selective DNA binding drug hedamycin, which preferentially interacts with GC-rich DNA sequences, to investigate its potential direct modulation of survivin gene transcription. Consistent with the DNA binding preferences of hedamycin, we have identified a highly GC-rich cis-acting DNA element within the GC-rich core promoter region of survivin (230 bp) that is responsible for the inhibitory effect of hedamycin on survivin promoter activity (Fig. 3). In vivo footprinting and in vitro EMSA experiments have further identified a DNA element (21 bp from −115 to −95) to which hedamycin directly binds (Fig. 5). Hedamycin binding to the 21-bp DNA element abrogated the DNA-protein interaction (Figs. 4 and 6A). Moreover, the DNA-protein complex was competed by Sp-1, but not by Gfi-1 DNA oligonucleotides (an AT-rich competitor) (Fig. 6B), suggesting that the proteins in the complex are likely Sp-1 or Sp1-like proteins. Consistently, mutations in the 21-bp DNA element decreased survivin promoter activity in the luciferase assay experiment (Fig. 7). Taken together, these results suggest that the 21-bp DNA motif is at least partially involved in the effect of hedamycin on inhibition of survivin promoter activity. These results may not be exclusively restricted to modulation of the survivin promoter and may anticipate a more global mechanism of transcriptional control. Accordingly, sequence analyses of the human genome indicated that the 21-bp DNA element used in the EMSA is highly conserved (≥14 bp) in the putative promoter region of seven human genes, including the transcription enhancer factor-1 (40), sequence-specific single-stranded DNA-binding protein 4 (41), and estrogen receptor 2 (ESR2/ERβ) (42). Additionally, the 21-bp element identified here is also highly conserved (≥14 bp) in the first intron of seven additional human genes, including the SMARC (SWI/SNF-related, matrix-associated, actin-dependent regulator of chromatin) gene, which is involved in transcriptional control of gene expression, and the human cyclin C gene, which was shown to be deleted in some types of tumors (43).
To our knowledge, this is the first report to characterize at the molecular level a direct transcriptional control of survivin expression by a sequence-selective DNA binding drug. This may have tangible implications for novel anticancer approaches, as lowering survivin levels by transcriptional or post-transcriptional mechanisms has been consistently associated with suppression of cell proliferation and onset of spontaneous apoptosis in a variety of tumor cell types.
It should be noted that previous studies of DNA binding drugs focused on well defined DNA motifs and their functional modulation by the DNA binding drugs as assessed in cell-free (such as EMSA) and/or cell culture (such as reporter gene assay) conditions. For example, the serum response element motif from the c-fos gene promoter (44, 45) or other DNA motifs/transcription factors (46, 47) were previously used as targets. A limitation of this approach is that the selected DNA motif may not be the most relevant motif for a particular sequence-selective DNA binding drug. Conversely, we have used here a largely unbiased strategy, relying on direct reporter analysis to functionally identify relevant cis-acting DNA elements involved in drug action (Fig. 3) and validating the implicated sites and their functional modulation of drug action using both in vivo and in vitro approaches (Figs. 4–7). The functional relevance of these observations was further underscored by the ability of survivin to reverse hedamycin-induced cell death, thus further implicating abrupt down-regulation of survivin levels as one of the critical mechanistic mediators of the antitumor activity of hedamycin (Fig. 8).
In summary, we have uncovered a novel mechanistic pathway down-regulating survivin gene expression in response to the DNA binding drug hedamycin. The findings described here may have broader implications for general mechanisms of transcriptional control by DNA sequence-specific binding drugs and may pave the way for transcription-based therapeutic strategies aimed at silencing survivin gene expression in tumor cells, in vivo.
Acknowledgment
We thank Dr. Brian Bundy from the Roswell Park Biostatistics Facility for help with the statistical analyses of the relevant data in this study.
Footnotes
This study was sponsored in part by grants from Concern Foundation (Beverly Hills, CA) and Elsa U. Pardee Foundation (Midland, MI) (to F. L.) and National Institutes of Health Grants CA101515 (to P. L.), CA78810 and CA90917 (to D. C. A.), CA080939 (to T. B.), and CA109481 to (F. L.).
- DMEM
- Dulbecco’s modified Eagle’s medium
- LM-PCR
- ligation-mediated PCR
- EMSA
- electrophoretic gel mobility shift assay
- PBS
- phosphate-buffered saline
- EGFP
- enhanced green fluorescent protein
- DMS
- dimethyl sulfate.
Searching (transcription factor) SP-1 binding sites using the TF search program failed to identify Sp-1 sites in the 21-bp element.
REFERENCES
- 1.Salvesen GS, Duckett CS. Nat. Rev. Mol. Cell. Biol. 2002;3:401–410. doi: 10.1038/nrm830. [DOI] [PubMed] [Google Scholar]
- 2.Liston P, Fong WG, Korneluk RG. Oncogene. 2003;22:8568–8580. doi: 10.1038/sj.onc.1207101. [DOI] [PubMed] [Google Scholar]
- 3.Li F. J. Cell. Physiol. 2003;197:8–29. doi: 10.1002/jcp.10327. [DOI] [PubMed] [Google Scholar]
- 4.Altieri DC. Oncogene. 2003;22:8581–8589. doi: 10.1038/sj.onc.1207113. [DOI] [PubMed] [Google Scholar]
- 5.Ambrosini G, Adida C, Altieri DC. Nat. Med. 1997;3:917–921. doi: 10.1038/nm0897-917. [DOI] [PubMed] [Google Scholar]
- 6.Li F, Ambrosini G, Chu EY, Plescia J, Tognin S, Marchisio PC, Altieri DC. Nature. 1998;396:580–584. doi: 10.1038/25141. [DOI] [PubMed] [Google Scholar]
- 7.Li F, Ackermann EJ, Bennett CF, Rothermel AL, Plescia J, Tognin S, Villa A, Marchisio PC, Altieri DC. Nat. Cell Biol. 1999;1:461–466. doi: 10.1038/70242. [DOI] [PubMed] [Google Scholar]
- 8.Fortugno P, Wall NR, Giodini A, O’Connor DS, Plescia J, Padgett KM, Tognin S, Marchisio PC, Altieri DC. J. Cell Sci. 2002;115:575–585. doi: 10.1242/jcs.115.3.575. [DOI] [PubMed] [Google Scholar]
- 9.Li F, Altieri DC. Cancer Res. 1999;59:3143–3151. [PubMed] [Google Scholar]
- 10.Olie RA, Simoes-Wust AP, Baumann B, Leech SH, Fabbro D, Stahel RA, Zangemeister-Wittke U. Cancer Res. 2000;60:2805–2809. [PubMed] [Google Scholar]
- 11.Chen J, Wu W, Tahir SK, Kroeger PE, Rosenberg SH, Cowsert LM, Bennett F, Krajewski S, Krajewska M, Welsh K, Reed JC, Ng SC. Neoplasia. 2000;2:235–241. doi: 10.1038/sj.neo.7900091. [DOI] [PMC free article] [PubMed] [Google Scholar]
- 12.Jiang X, Wilford C, Duensing S, Munger K, Jones G, Jones D. J. Cell. Biochem. 2001;83:342–354. doi: 10.1002/jcb.1228. [DOI] [PubMed] [Google Scholar]
- 13.Xia C, Xu Z, Yuan X, Uematsu K, You L, Li K, Li L, McCormick F, Jablons DM. Mol. Cancer Ther. 2002;1:687–694. [PubMed] [Google Scholar]
- 14.Ansell SM, Arendt BK, Grote DM, Jelinek DF, Novak AJ, Wellik LE, Remstein ED, Bennett CF, Fielding A. Leukemia. 2004;18:616–623. doi: 10.1038/sj.leu.2403281. [DOI] [PubMed] [Google Scholar]
- 15.Younis T, Ramnath N, Ling X, Bernacki RJ, Li F. The Proceedings of the Association for Cancer Research 95th Annual Meeting; Orlando, FL. March 27–31, 2004; Orlando, Florida: AACR; 2004. pp. 697–698. [Google Scholar]
- 16.Ambrosini G, Adida C, Sirugo G, Altieri DC. J. Biol. Chem. 1998;273:11177–11182. doi: 10.1074/jbc.273.18.11177. [DOI] [PubMed] [Google Scholar]
- 17.Grossman D, McNiff JM, Li F, Altieri DC. J. Investig. Dermatol. 1999;113:1076–1081. doi: 10.1046/j.1523-1747.1999.00776.x. [DOI] [PubMed] [Google Scholar]
- 18.Grossman D, McNiff JM, Li F, Altieri DC. Lab. Investig. 1999;79:1121–1126. [PubMed] [Google Scholar]
- 19.Kanwar JR, Shen WP, Kanwar RK, Berg RW, Krissansen GW. J. Natl. Cancer Inst. 2001;93:1541–1552. doi: 10.1093/jnci/93.20.1541. [DOI] [PubMed] [Google Scholar]
- 20.Yamamoto T, Manome Y, Nakamura M, Tanigawa N. Eur. J. Cancer. 2002;38:2316–2324. doi: 10.1016/s0959-8049(02)00247-2. [DOI] [PubMed] [Google Scholar]
- 21.Tu SP, Jiang XH, Lin MC, Cui JT, Yang Y, Lum CT, Zou B, Zhu YB, Jiang SH, Wong WM, Chan AO, Yuen MF, Lam SK, Kung HF, Wong BC. Cancer Res. 2003;63:7724–7732. [PubMed] [Google Scholar]
- 22.Ling X, Li F. BioTechniques. 2004;36:450–454. 456–460. doi: 10.2144/04363RR01. [DOI] [PubMed] [Google Scholar]
- 23.Pennati M, Colella G, Folini M, Citti L, Daidone MG, Zaffaroni N. J. Clin. Investig. 2002;109:285–286. doi: 10.1172/JCI14891. [DOI] [PMC free article] [PubMed] [Google Scholar]
- 24.Pennati M, Binda M, Colella G, Folini M, Citti L, Villa R, Daidone MG, Zaffaroni N. J Investig. Dermatol. 2003;120:648–654. doi: 10.1046/j.1523-1747.2003.12082.x. [DOI] [PubMed] [Google Scholar]
- 25.Choi KS, Lee TH, Jung MH. Cancer Gene Ther. 2003;10:87–95. doi: 10.1038/sj.cgt.7700531. [DOI] [PubMed] [Google Scholar]
- 26.Pennati M, Binda M, Colella G, Zoppe M, Folini M, Vignati S, Valentini A, Citti L, De Cesare M, Pratesi G, Giacca M, Daidone MG, Zaffaroni N. Oncogene. 2004;23:386–394. doi: 10.1038/sj.onc.1207071. [DOI] [PubMed] [Google Scholar]
- 27.Shen C, Buck A, Polat B, Schmid-Kotsas A, Matuschek C, Gross HJ, Bachem M, Reske SN. Cancer Gene Ther. 2003;10:403–410. doi: 10.1038/sj.cgt.7700581. [DOI] [PubMed] [Google Scholar]
- 28.O’Connor DS, Grossman D, Plescia J, Li F, Zhang H, Villa A, Tognin S, Marchisio PC, Altieri DC. Proc. Natl. Acad. Sci. U. S. A. 2000;97:13103–13107. doi: 10.1073/pnas.240390697. [DOI] [PMC free article] [PubMed] [Google Scholar]
- 29.O’Connor DS, Wall NR, Porter AC, Altieri DC. Cancer Cells. 2002;2:43–54. doi: 10.1016/s1535-6108(02)00084-3. [DOI] [PubMed] [Google Scholar]
- 30.Wall NR, O’Connor DS, Plescia J, Pommier Y, Altieri DC. Cancer Res. 2003;63:230–235. [PubMed] [Google Scholar]
- 31.Zhou M, Gu L, Li F, Zhu Y, Woods WG, Findley HW. J. Pharmacol. Exp. Ther. 2002;303:124–131. doi: 10.1124/jpet.102.037192. [DOI] [PubMed] [Google Scholar]
- 32.Mirza A, McGuirk M, Hockenberry TN, Wu Q, Ashar H, Black S, Wen SF, Wang L, Kirschmeier P, Bishop WR, Nielsen LL, Pickett CB, Liu S. Oncogene. 2002;21:2613–2622. doi: 10.1038/sj.onc.1205353. [DOI] [PubMed] [Google Scholar]
- 33.Hoffman WH, Biade S, Zilfou JT, Chen J, Murphy M. J. Biol. Chem. 2002;277:3247–3257. doi: 10.1074/jbc.M106643200. [DOI] [PubMed] [Google Scholar]
- 34.Ling X, Bernacki RJ, Brattain MG, Li F. J. Biol. Chem. 2004;279:15196–15203. doi: 10.1074/jbc.M310947200. [DOI] [PubMed] [Google Scholar]
- 35.Li F, Ling X, Huang H, Brattain L, Apontes P, Wu J, Binderup L, Brattain MG. Oncogene. 2004 doi: 10.1038/sj.onc.1208330. in press. [DOI] [PMC free article] [PubMed] [Google Scholar]
- 36.Li F, Altieri DC. Biochem. J. 1999;344(Pt 2):305–311. doi: 10.1042/0264-6021:3440305. [DOI] [PMC free article] [PubMed] [Google Scholar]
- 37.Turner PR, Denny WA. Curr. Drug Targets. 2000;1:1–14. doi: 10.2174/1389450003349407. [DOI] [PubMed] [Google Scholar]
- 38.Tu LC, Melendy T, Beerman TA. Mol. Cancer Ther. 2004;3:577–585. [PubMed] [Google Scholar]
- 39.Hurley LH. Nat. Rev. Cancer. 2002;2:188–200. doi: 10.1038/nrc749. [DOI] [PubMed] [Google Scholar]
- 40.Boam DS, Davidson I, Chambon P. J. Biol. Chem. 1995;270:19487–19494. doi: 10.1074/jbc.270.33.19487. [DOI] [PubMed] [Google Scholar]
- 41.Castro P, Liang H, Liang JC, Nagarajan L. Genomics. 2002;80:78–85. doi: 10.1006/geno.2002.6805. [DOI] [PubMed] [Google Scholar]
- 42.Zhao C, Lam EW, Sunters A, Enmark E, De Bella MT, Coombes RC, Gustafsson JA, Dahlman-Wright K. Oncogene. 2003;22:7600–7606. doi: 10.1038/sj.onc.1207100. [DOI] [PubMed] [Google Scholar]
- 43.Li H, Lahti JM, Valentine M, Saito M, Reed SI, Look AT, Kidd VJ. Genomics. 1996;32:253–259. doi: 10.1006/geno.1996.0112. [DOI] [PubMed] [Google Scholar]
- 44.White CM, Heidenreich O, Nordheim A, Beerman TA. Biochemistry. 2000;39:12262–12273. doi: 10.1021/bi001427l. [DOI] [PubMed] [Google Scholar]
- 45.White CM, Satz AL, Gawron LS, Bruice TC, Beerman TA. Biochim. Biophys. Acta. 2002;1574:100–108. doi: 10.1016/s0167-4781(01)00351-7. [DOI] [PubMed] [Google Scholar]
- 46.Welch JJ, Rauscher FJ, III, Beerman TA. J. Biol. Chem. 1994;269:31051–31058. [PubMed] [Google Scholar]
- 47.Chiang SY, Welch JJ, Rauscher FJ, III, Beerman TA. J. Biol. Chem. 1996;271:23999–24004. doi: 10.1074/jbc.271.39.23999. [DOI] [PubMed] [Google Scholar]
- 48.Mueller PR, Wold B, Garrity PA. In: Current Protocols in Molecular Biology. Ausubel FM, Brent R, Kingston RE, Moore DD, Seidman JG, Smith JA, Struhl K, editors. Vol. 3. John Wiley & Sons, Inc.; New York: 2001. pp. 15.13.11–15.13.26. [Google Scholar]