

Abstract
The recent progress in crystallography of G-protein coupled receptors opens an unprecedented venue for structure-based GPCR drug discovery. To test efficiency of the structure-based approach, we performed molecular docking and virtual ligand screening (VLS) of more than 4 million commercially available “drug-like” and ‘‘lead-like’’ compounds against the A2AAR 2.6 Å resolution crystal structure. Out of 56 high ranking compounds tested in A2AAR binding assays, 23 showed affinities under 10 µM, eleven of those had sub-µM affinities, and two compounds had affinities under 60 nM. The identified hits represent at least 9 different chemical scaffolds and are characterized by very high ligand efficiency (0.3–0.5 kcal/mol per heavy atom). Significant A2AAR antagonist activities were confirmed for 10 out of 13 ligands tested in functional assays. High success rate, novelty and diversity of the chemical scaffolds and strong ligand efficiency of the A2AAR antagonists identified in this study suggest practical applicability of receptor-based VLS in GPCR drug discovery.
Introduction
G-protein Coupled Receptor (GPCR) signaling is a key to molecular pathways involved in the normal function and pathologies of nervous, cardiovascular, immune and other major systems in human body. Among about 400 non-olfactory receptors of the GPCR superfamily, more than 50 represent molecular targets for prescription drugs1–2, and the range of clinically validated GPCRs and investigational drugs is rapidly expanding. One of the major spotlights is on the adenosine receptor (AR) subfamily3, all four subtypes of which (A1, A2A, A2B and A3) have been considered as potential therapies for neurodegenerative4–5, cardiac6–7, immune and inflammatory disorders8–9 and cancer10. Despite some obstacles in clinical development of early drug candidates for ARs11–12, the year 2008 has been marked by successful FDA approval of the new generation A2AAR selective agonist regadenoson as a coronary vasodilator for use in myocardial perfusion imaging13. This breakthrough, along with other advances in pre-clinical and clinical studies3 boosts interest to development of a new generation of bioavailable and safe agonists and antagonists for adenosine receptors.
Historically, GPCR drug discovery relied on known natural ligands or screening assay hits as starting points for optimization of affinity, subtype selectivity and pharmacokinetic properties14–16. The most useful scaffolds for design of AR ligands have been provided by adenosine17–18 and xanthine19–20 chemotypes. Thus, adenosine derivatives with various substitutions in position 2 or N6 of the adenine ring and 3’,4’, or 5’ position of the ribose ring12 have been developed as selective agonists for all four AR subtypes; only a few other chemotypes21 have been found with agonist activity. Since the early discovery of caffeine and theophylline as non-selective AR antagonists19–20,22 derivatization of the xanthine scaffold yielded a number of high affinity subtype selective antagonists12. Several other chemotypes for AR antagonists have been discovered over the last decade23–30 using a combination of experimental screening and ligand-based methods. The ligand-based approaches, however, require preexisting knowledge of ligand structure activity relationships (SAR), and are largely limited to relatively close analogues of known ligands (Chart 1).
Chart 1.

Chemical structures of representative antagonists (1 and 2) and agonists (3 and 3a) of A2A adenosine receptor.
The breakthroughs in GPCR crystallography, including determination of high resolution structures of β-adrenergic receptors (human β2AR31–33 and turkey β1AR34), and most recently of human A2A adenosine receptor35 (A2AAR) in complex with antagonist 1 (ZM24138536), open an opportunity for alternative, receptor-based approaches to finding new GPCR ligand chemotypes37. Indeed, the β2AR crystal structure-based models have already proved to be efficient in virtual screening for antagonists/inverse agonists, and, with some modifications38, also for full and partial agonists of the receptor39–40. Recently, virtual ligand screening for the β2AR allowed identification of new nanomolar and submicromolar inverse agonists for this receptor41.
In this study we assessed performance of the human A2AAR structure35 (PDB code: 3EML) in virtual screening, which resulted in identification of several novel ligand chemotypes for ARs. The initial benchmarking with known antagonists showed enrichment factors for the A2AAR on par with previously published assessments for the β2AR39–40. Performance of the screening model was further improved by retaining several highly structured water molecules in the binding site and refining side chains in the binding pocket. The optimized model was used for virtual screening of more than 4 million commercially available lead-like and drug-like compounds. Out of 56 high scoring compounds, which were subsequently tested in radioligand binding assays, 23 compounds were identified as A2AAR ligands with affinity Ki <10 µM (41% hit rate), of which 11 had sub-µM affinity, and two compounds showed Ki under 0.06 µM. Functional assays confirmed significant A2AAR antagonist activities for 10 out of 13 newly identified ligands. The novel ligands represent at least nine novel chemotypes, and include low molecular weight compounds with high ligand binding efficiency (LE>0.3 kcal/mol per heavy atom), potentially suitable as leads for drug discovery. Overall, a very good success rate of VLS, high ligand efficiency of the hits, as well as diversity and novelty of the identified chemical scaffolds suggest applicability of the receptor-based screening to discovery of new candidate drugs to adenosine receptors and potentially other GPCRs.
Results
High-performance A2AAR screening model based on the crystal structure
The A2AAR crystal structure35 (PDB code :3EML) and ligand-refined models of the A2AAR were evaluated for their ability to select known A2AAR specific antagonists from random decoy compounds in a docking and virtual ligand screening (VLS) benchmark test. As illustrated in Figure 1 examples, the predicted binding poses for majority of the known A2AAR antagonists in the diverse benchmark set display key similarities with the binding mode of antagonist 1 in the crystal structure. This common binding motif involves stacking between aromatic moieties of the ligands and the conserved Phe168(5.29) side chain of the receptor, as well as polar interactions with conserved Asn253(6.55) side chain (Residue numbers in parentheses are based on Ballesteros-Weinstein nomenclature42). Compounds shown in Figure 1 also form a hydrogen bond between the unsubstituted exocyclic amine group and the Glu169(5.30) side chain. In addition to these core interactions, most high affinity A2AAR antagonists have an aromatic group extending deeper into the binding pocket and/or flexible extensions towards the extracellular opening of the pocket.
Figure 1.

Binding of known antagonists into human adenosine A2A receptor models. (A) Co-crystal structure with compounds 1 as in PDB entry 3EML35, ligand carbons are shown in magenta color. (B–D) Optimized model 3EMLW3_opt with 3 top scoring compounds from the benchmark set (B) mantri(n)27, (C) mantri(f) 27 (D) mantri(k)27. For all ligands, the A2A binding pocket is shown as transparent skin colored by properties (green: hydrophobic, red: acceptor, blue: donor of H-bond). Water molecules are shown by thin red lines and with labels for the three structured waters with lowest B-factors. Hydrogen bonds are shown by cyan spheres.
The results in Figure 2 assess overall performance of several screening models, which were generated from the crystal structure (3EML) by optimizing polar hydrogens and structured water configuration. The Receiver Operating Characteristic (ROC) curves, in semi-logarithmic scale to emphasize initial enrichment, suggest very good overall screening performance for all six models, with the area under curve (AUC) values within 89–91% range. However, the model with three structured water molecules in the binding pocket, 3EMLW3 achieved a significantly higher initial enrichment factor, EF(1%) = 70%, as compared to the 3EMLW0 model without water, EF(1%)=43 %, or any of the other 13 water configurations tested . Analysis of the crystal structure shows that the three waters selected for the 3EMLW3 model (wa, wa14 and wa5 in the 3EML PDB entry) have the lowest B-factor values and form an extended hydrogen bonding network with the binding pocket residues, suggesting their highly structured nature. While the presence of water in the models does not contribute significantly to the predicted binding scores of the known ligands, the selected structured water molecules occupy highly polar sub-pockets in the A2AAR and apparently prevent adverse binding of some decoy compounds into these sub-pockets.
Figure 2.

Performance of A2AAR screening models with different number of structured water molecules (W0 to W4) and with conformational optimization (W3_opt). Receiver Operating Characteristic (ROC) curves are shown in semi-logarithmic scale.
Further modest improvement of initial recognition performance (EF(1%)=78) was achieved for 3EMLW3_opt model by ligand-guided optimization of side chains in the binding site of the A2AAR structure, as described in Methods . More than 200 candidate models were obtained by docking representative antagonists into the all-atom model of the A2AAR with fully flexible side chains of the binding pocket. The best performing model was selected based on the same VLS benchmark test as described above, using a normalized square root AUC (NSQ_AUC) as a metric for model selection (see Methods for NSQ_AUC definition). Note that the conformational changes between the crystal structure and the 3EMLW3_opt model are minor, with RMSD about 0.27 Å for the 12 side chains of the binding pocket.
Identification of candidate A2AAR antagonists by virtual compound screening
The optimized model of the A2AAR, 3EMLW3_opt, was then used to screen for candidate binders from about 4.3 million commercially available drug- and lead-like compounds collected in the Molsoft ScreenPub non-redundant screening database. About 1800 of the library compounds docked into the A2AAR model with the ICM binding score better than the standard threshold (−32 kJ/mol). These candidate hits were clustered into 340 groups for chemical similarity (Tanimoto distance cutoff >0.3); the cluster size ranged from 1 to 277 compounds. In each cluster we selected from 1 to 10 different compounds according to their predicted binding score and predicted ligand efficiency, LEpred. The LEpred, which is defined as binding score per heavy atom of the compound, may correlate with compound suitability as a lead for chemical optimization. Other criteria for the compound selection included their predicted logP (octanol/water partition) and logS (aqueous solubility) values, as well as immediate availability of compounds from major chemical vendors. Compounds with less than 0.3 Tanimoto distance to known AR ligands in GLIDA database43 were removed to maintain novelty of the compounds in the testing library. This resulted in a final set of 56 diverse drug-like or lead-like compounds that were ordered and screened in experimental assays (see Supporting InformationTable SI1 for the full list of tested compounds).
Figure 3 illustrates predicted A2AAR binding poses of selected candidate compounds representing 16 different chemical scaffolds. All candidate chemotypes except the L cluster were predicted to share some key features with antagonist (1) binding in the A2AARcrystal structure, including stacking interaction with Phe168(5.29) and hydrogen bonds between exocyclic amine donor and acceptors in Asn253(6.55) and Glu169(5.30) side chains. Most compounds have an additional acceptor, which forms a hydrogen bond to Asn253(6.55) donor in our models.
Figure 3.

Examples of binding poses in the 3EMLW3_opt receptor model for predicted A2AAR candidate ligands representing 16 different chemical clusters. The letters (A to P) show cluster names, the numbers in brackets indicate compound IDs. Labels for the (i) contact side chains, (ii) TM domains and (iii) structured waters of the receptor model are shown in panels A to C. Side chains of the receptor are shown by sticks with white carbon atoms, in ligands the carbon atoms are colored yellow. Structured water molecules in the model are shown by purple sticks. Hydrogen bonds are colored according to their predicted strength, from blue (strongest) to red (weakest). The binding pocket surface is shown by purple skin, which is clipped in foreground for better view.
Apart from these core interactions, many predicted compounds in Figure 3 (clusters A, D, F, G,H,I,K,P) have moieties extending deep in the binding pocket towards Trp246(6.48) and His250(6.52) and making additional, mostly hydrophobic contacts. Many compounds also have extensions towards the extracellular opening of the pocket (clusters A,B,D,E,F,G,J,K,M,N,O) and/or towards helix TM1 (clusters B,E,H,N,O) which may play a role in their subtype selectivity.
Results of AA2AR Binding Assay in insect cell membranes
Experimental testing of the 56 selected compounds resulted in identification of 23 new AA2AR ligand with Ki better than 10 µM (41% hit rate), and 11 ligands with Ki better than 1 µM. The most efficient A2AAR binders are presented in Table 1; this includes compounds 9 (Ki =0.032 µM) and 15 (Ki =0.06 µM) and other compounds with sub-µM affinity or exceptional ligand efficiency. For the results of the binding test for all 56 compounds see Supporting Information, Table SI1.
Table1.
Representative hits clustered by different chemotypes, with their A2AAR binding characteristics and predicted ICM Scores. Clusters are named as in Figure 3. The last column shows compounds in GLIDA database of ~30,000 GPCR ligands43 with highest chemical similarity to the identified hits.
| ID | Cluster | Chemical Structure | Ki µM | 95% confidence interval |
Maxa Inhibition % |
LEb | ICM Scorec |
Closest Analog in GLIDA (Tanimoto Distance) |
|---|---|---|---|---|---|---|---|---|
| 9 | A | 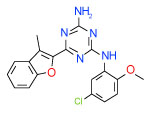 |
0.032 | (0.023–0.043) | 80 | 0.38 | −36.3 | 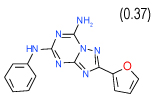 |
| 8 | B | 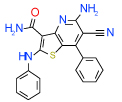 |
0.63 | (0.12–3.3) | 54 | 0.3 | −34.3 | 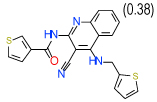 |
| 15 | B | 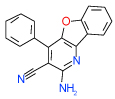 |
0.06 | 0.0082–0.45) | 91 | 0.45 | −32.4 | 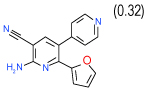 |
| 49 | C | 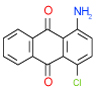 |
0.25 | (0.21–0.3) | 100 | 0.5 | −36.4 | 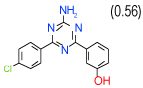 |
| 35 | C | 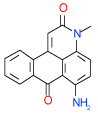 |
0.64 | (0.43–0.94) | 96 | 0.4 | −39.1 | 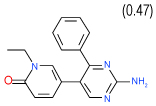 |
| 29 | C | 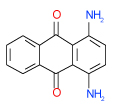 |
0.32 | (0.25–0.4) | 88 | 0.49 | −37.5 |  |
| 26 | C | 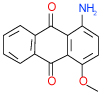 |
0.53 | (0.29–0.98) | 90 | 0.45 | −37.8 | 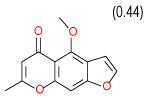 |
| 6 | D | 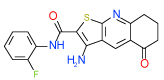 |
0.3 | (0.15–0.62) | 70 | 0.35 | −35 | 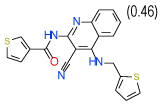 |
| 14 | D |  |
1 | (0.73–1.4) | 78 | 0.35 | −34.8 | 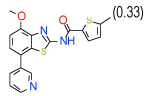 |
| 10 | D | 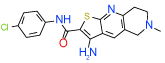 |
2.7 | (1.4–5.3) | 92 | 0.3 | −35.6 | 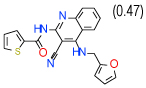 |
| 50 | E | 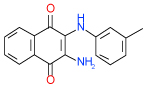 |
0.8 | (0.44–1.5) | 78 | 0.39 | −37.8 | 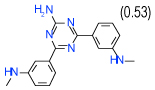 |
| 17 | E |  |
0.56 | (0.19–1.6) | 80 | 0.35 | −38.4 |  |
| 21 | I |  |
2.9 | (1.7–5.1) | 66 | 0.4 | −38.5 |  |
Maximum Inhibition was achieved at 10 µM concentration for compound 9 and at 32 µM for compound 15. All other compounds showed maximum inhibition at 1 mM.
Experimental ligand efficiency, kcal/mol , calculated as ligand binding energy per heavy atom.
Predicted ICM binding score, kJ/mol
Diversity of the identified A2AAR ligands is supported by the fact that compounds in Table 1 belong to six different clusters (A,B,C,D,E,I in Figure 3), and an additional three clusters (F,G,H) contain other binders with Ki better than 10 µM. The novelty of the ligands was also assessed by searches in GLIDA database that comprises 795 specific binders of ARs used in clinical studies and research. We confirmed that all compounds in Table 1 have Tanimoto distances exceeding 0.3 to their closest analogues in the GLIDA database43.
Figure 4 illustrates the binding curves for the compounds in Table 1. Antagonists 1 and 2 (theophylline), as well as agonist NECA44 (3) were used as the reference compounds, and their observed Ki values (0.0006, 0.140 and 4.4 µM respectively) correlated well with the Ki values published previously12. The Ki value and the binding curve for compound 9 are shown for concentrations below 2 µM; at this concentration the compound displaces up to 80% of the hot ligand. In contrast, at higher concentrations of this compound (10 to 1000 µM) displacement of the hot ligand drops to lower levels (see Figure SI1). This unusual behavior of compound 9, confirmed in 6 runs of the binding assay, can be attributed to cooperative aggregation, as also suggested by visible sedimentation of the compound at concentrations above 10 µM.
Figure 4.

Examples of competition binding curves for the identified A2AAR ligands, as compared for known A2AAR antagonists 1, 2, and agonist 3. Tritiated compound 1 was used as the radioligand.
Note that all A2AAR binders shown in Table 1 have ligand efficiency better tahn 0.3 kcal/mol per heavy atom, which is considered to be optimal for lead-like compounds45. The highest value LE=0.5 kcal/mol per heavy atom was detected for compound 49 , (18 heavy atoms and MW=257) and two of its analogues in cluster C. Smaller compounds, like compound 21 in cluster I with LE=0.4 kcal/mol per heavy atom, may be especially valuable as lead scaffolds for drug discovery, since they provide more room for chemical optimization45. Each of the chemical clusters and some of the binding features of the ligands are discussed in more details in the Discussion section.
Ligand binding and AR subtype selectivity in mammalian cell membranes
In addition to Sf9 insect cells, binding of some A2AAR ligands was also assessed for A1 and A3 AR subtypes expressed in mammalian cells (A2B subtype selectivity was not measured here). The left columns in Table 2 show the results of this assay for the A2AAR in HEK293 cell membranes. These results confirm the Ki values under 1 µM in mammalian based assays for all submicromolar binders shown in Table 1. The observed variations in affinities are expected between Sf9 and HEK based assay systems, as these assays involve a different pattern of posttranslational modifications, lipid composition and a different set of experimental conditions.. The most significant deviation was found for compound 10, which did not show any substantial binding to the HEK293 expressed A2AAR protein. Results of binding to the A1AR subtype in the right columns of Table 2 suggest only a modest decrease in binding affinities for majority of the tested compounds, as compared to A2AAR binding. Substantial (more than 10 fold) selectivity for the A2AAR over the A1AR was observed for two compounds, 17 and 50, which both belong to the same chemotype (cluster E). One compound, 8, had a pronounced selectivity to the A1AR subtype (20 fold). Full affinity measurements for A3AR subtype were not attempted, because single point assays suggested that none of the compounds had apparent selectivity to the A3 subtype, while a majority was characterized by the impaired A3AR binding (see Figure SI2).
Table 2.
Competition binding of the hit compounds to mammalian expressed adenosine receptor subtypes A2A and A1.
| Displacement of radioligand at A2AAR-HEK membranes |
Displacement of radioligand A1AR-CHO membranes |
A2A / A1 selectivity |
|||||
|---|---|---|---|---|---|---|---|
| ID |
Ki, µM |
(95% Confidence Interval), µM |
Max Displacementa, % |
Ki, µM |
(95% Confidence Interval), µM |
Max Displacementa, % |
fold |
| 6 | 0.06 | (0.03–0.12) | 48 | 0.09 | (0.04–0.19) | 32 | 1.42 |
| 8 | 1.14 | (0.67–1.94) | 53 | 0.06 | (0.05–0.08) | 100 | 0.05 |
| 9 | 0.49 | (0.20–1.17) | 41 | 1.44 | (0.56–3.70) | 41 | 2.94 |
| 10 | >10 | ND | ND | 1.12 | (0.44–2.88) | 28 | ND |
| 14 | 0.06 | (0.05–0.09) | 54 | 0.14 | (0.04–0.52) | 25 | 2.24 |
| 15 | 0.56 | (0.31–0.99) | 73 | 0.48 | (0.12–1.96) | 27 | 0.87 |
| 17 | 0.72 | (0.55–0.95) | 73 | >10 | ND | ND | >10. |
| 21 | 3.01 | (0.69–13.1) | 57 | 0.39 | (0.31–0.50) | 86 | 0.13 |
| 26 | 0.10 | (0.08–0.11) | 100 | 0.26 | (0.21–0.33) | 100 | 2.74 |
| 29 | 0.11 | (0.09–0.14) | 100 | 0.28 | (0.23–0.33) | 100 | 2.51 |
| 35 | 0.20 | (0.15–0.25) | 100 | 0.15 | (0.13–0.17) | 100 | 0.75 |
| 49 | 0.94 | (0.78–1.13) | 100 | 0.19 | (0.16–0.22) | 100 | 2.01 |
| 50 | 0.15 | (0.11–0.21) | 50 | 1.75 | (0.45–6.81) | 27 | 11.42 |
Max displacement refers to the maximal displacement of bound radioligand observed using 10 µM of test compound.
The identified compounds inhibit A2AAR-mediated cAMP production in functional assays
We performed cell-based functional assays to evaluate activity of the newly identified adenosine A2A receptor binders as receptor antagonists. HEK293T cells stably expressing the A2AAR were stimulated with either 10 nM or 10 µM of the A2AAR agonist CGS21680 (Ki=27 nM)12, and intracellular cAMP levels were determined using the LANCE cAMP TrFRET kit (Perkin Elmer), as described in Methods. The ability of the various compounds to block A2A receptor mediated cAMP generation was assessed at a 10 µM concentration of the compounds. The results in Figure 5 show that 11 out of the 14 tested A2AAR binders were able to effectively block more than 75% of cAMP generation at 10 nM concentration of agonist 3a (CGS21680), which strongly supports their A2AAR antagonist activity. Most effective antagonists (compounds 29, 35, 49) inhibited more than 90% of cAMP production for cells stimulated with 10 nM of 3a. Due to the comparatively low affinity of the tested compounds as compared to the agonist 3a the majority of compounds were unable to block the effect of this agonist used at a saturating concentration of 10 µM. No A2AAR specific activity was observed for compound 8. Compounds 6 and 10 blocked cAMP production at both 10 nM and 10 µM concentrations of 3a to the same extent, suggesting their ability to inhibit cAMP production was not A2AAR -specific. Subsequent experiments revealed that compound 6 inhibited forskolin stimulated cAMP generation, clearly indicating an effect independent of the A2AAR (data not shown).
Figure 5.

Inhibition of agonist-induced cAMP production by the A2AAR hit compounds. Activity is measured at 10 µM concentration of the compounds, as compared to no compound in the control. Data is normalized where 0 % represents the unstimulated condition (black bars) and 100 % represents the accumulation of intracellular cAMP observed for stimulation with compound 3a at 10 nM or 10 µM concentrations (shaded and open bars respectively).
Discussion
Our results suggest that receptor-based virtual ligand screening is an efficient tool for discovery of novel chemically diverse antagonists of adenosine A2A receptor. A number of A2AAR ligands selected here by VLS not only display submicromolar affinity and significant functional activity in mammalian cells, but also have small molecular weight and high ligand efficiency (LE> 0.3 kcal/mol per heavy atom) suitable for lead optimization. Below we discuss each of the diverse chemical scaffolds identified and their A2AAR interaction modes as predicted by VLS docking (see Figure 3 and Table 1 above).
Cluster A is represented by only one compound 9 based on 1,3,5-triazine-2,4-diamine scaffold, which has the best AA2AR affinity in the set (Ki = 0.03 µM in Sf9 based assay). The functional activity of compound 9 in HEK293 cells is also one of the highest among the tested ligands (see Figure 4). As seen in Figure 3A, compound 9 is predicted to form a hydrogen bond network with Asn253(6.55) and Glu169(5.30). The compound’s 3-methyl-benzofuran moiety is extended downward and reaches deeper into the binding pocket than the furan moiety of the antagonist 1 in the crystal structure35, suggesting that this part of the pocket can be exploited in ligand design. The 5-chloro-2-methoxyphenyl moiety stretches towards TM2 helix and forms predominantly hydrophobic contacts with Ile66(2.64), Ala63(2.61) and Ile274(7.39), although an alternative extended orientation of this ring has also been observed with only slightly inferior binding scores.
Cluster B includes compounds 15 and 8 (Ki = 0.06 µM and 0.63 µM respectively in Sf9 assays), which have a common 2-amino-3-cyano-4-phenylpyridine motif, though in a different context of bi- and tricyclic aromatic ring systems. For both compounds the amine and cyano moieties were predicted to form a strong hydrogen bonding network with Asn253(6.55) and Glu169(5.30). Interestingly, while compound 1 and most other known antagonists have nearly flat configurations deep in the binding pocket, the phenyl ring of both compounds 15 and 8 is intrinsically out of plane with the core pyridine ring. The non-planar configuration is apparently accommodated by the pocket as it is in the crystal structure, but this feature may result in different conformational preferences for the A2AAR receptor, potentially leading to unusual binding and /or functional properties of these ligands. Indeed, we found that compound 8 does not have any functional activity in A2AAR cells (see Figure 4); at the same time it is the only compound in our set with significant binding selectivity to A1AR subtype.
Cluster C is the most populous one and represents as many as nine 1-amino-anthraquinone compounds in our test list. Of those, four (26, 29, 35, 49 in Table 1) have sub-µM affinity for the A2AAR and another three (38, 20, 28 in Table SI1) have low-µM affinity. Quite remarkably, all four sub-µM ligands in this cluster have significant functional activity as antagonists in mammalian cells. Some of the smaller compounds in this group are characterized by an exceptionally high ligand efficiency (LE) that exceeds 0.45 kcal/mol per heavy atom (compounds 49,29,26). These compounds have different small groups in anthraquinone position 4, which seems to be rather permissive to substitutions. This site may be useful for optimization of the scaffold affinity and chemical properties, though a few bulky substituents tested in this initial screening (38, 20, 18, 23) were apparently suboptimal. Compound 35 (Ki =0.64 µM in Sf9) has a modified scaffold with an additional conjugated ring, which extends towards TM2 and makes contacts with the binding pocket side chains. Interestingly, anthraquinone-based analogues of Reactive Blue 2 dye have been found that inhibit distantly related purinergic P2Y receptors46, but no AR activity for this chemotype had previously been reported to the best of our knowledge.
Cluster D comprises a relatively diverse set of compounds with a common thieno[2,3-b]pyridin-3-amine core motif and a variety of amide or ketone substituents in position 2; some of the highest affinity compounds in this cluster (6 (Ki=0.3 µM in Sf9 ) ,14,51,10) are presented in Table 1. In addition to the common set of core interactions, cluster D compounds have aromatic groups predicted to extend deep into the binding pocket, though too bulky or highly polar extensions apparently compromise binding (e.g. compound 13 in Table SI1). Functional assays for compound 6, however, suggest that while this compound blocks cAMP signaling, the effect does not depend on agonist concentration. Additional experiments (results not shown) confirm that compound 6 might inhibit cAMP production through an A2AAR–independent mechanism.
Cluster E includes 2,3-diaminonaphthalene-1,4-dione compounds 50 and 17 with Ki < 1 µM. Both compounds have an aryl substitution at one of the amines, which is predicted to extend towards extracellular loops. An interesting feature suggested by docking for both compounds is a polar interaction of both unsubstituted and substituted amine groups with the Glu169(5.30) side chain, as shown in Figure 3E. Both compounds show significant activity in functional assays. Interestingly, compounds 50 and 17 are the only compounds in the set with a pronounced A2A subtype selectivity (>10 fold). Given their small size and very good ligand efficiency LE~0.4 kcal/mol per heavy atom, they could provide reasonable leads for optimization of A2A selectivity.
Cluster F is represented in our set by only one compound 7 with Ki =1.9 µM (Table SI1). It has a pattern of interaction somewhat similar to cluster D, though its tricyclic system has a different orientation and extends more towards TM2 helix.
Cluster G, which has a 1,3,5-triazine-2,4-diamine moiety similar to cluster A, lacks the methyl-benzofuran extension and is likely to have a different binding mode with the phenylamine ring oriented deep into the binding pocket. Seven out of the 9 tested compounds of this cluster showed some A2AAR affinity, though only two had Ki under 10 µM (compounds 36 and 31 in Table SI1).
Cluster H includes two compounds (16 and 46 in Table SI1) based on different chemical scaffolds sharing a similar core polar interaction motif, i.e. amine donor and carboxyl acceptor connected to a 5-membered ring. Though the compounds have only modest affinity, their small size leaves room for optimization (ligand efficiency LE=0.38 and 0.32 kcal/mol per heavy atom respectively).
Cluster I has only one representative compound 21, based on 4-amino-2-isoindole-1,3-dione scaffold, shown in Table 1 . Though affinity of this small compound is modest, it has a very high ligand efficiency (LE=0.38 kcal/mol per heavy atom) and may represent an attractive lead for optimization.
Other clusters (J to X) of the set do not have compounds with affinities under 10 µM, though some of them, e.g. compound 57 in cluster P with LE = 0.32 kcal/mol per heavy atom, may still present interesting leads. No active compounds were identified in clusters Q, R, T, U, V, W and X.
Although highly diverse, all high scoring VLS compounds used in experimental testing contained an exocyclic amine group. The preference for compounds with exocyclic amines is also noticeable in the evaluation benchmark with the crystal structure (3EMLW0) or optimized models (3EMLW3_opt) where other A2AAR ligand types all scored below the default binding score threshold of −32 kJ/mol, with only a few xanthine analogues approaching this threshold. The docking preference for exocyclic amine compounds apparently reflects their exclusively high affinity to the A2AAR (the best compounds have Ki < 0.1 nM)12. At the same time, it may be at least partially attributed to some bias in the crystal structure of the A2AAR complex with ligand 1. For example, the flexible side chain of Glu169(5.30) in the EL2 is perfectly positioned to form a strong polar interaction with the unsubstituted exocyclic amine of compound 1. As we have shown previously, binding of other ligand classes, e.g. xanthine analogues lacking an exocyclic amine may be somewhat suboptimal in this conformation on the A2AAR47 and thus may require a modified model or multiple models to capture the associated pocket plasticity 48.
Most of the novel A2AAR antagonists tested for subtype selectivity are characterized by reduced binding to A3AR subtype (see Figure SI2). Such A2A/A3 selectivity is expected for chemotypes with unsubstituted exocyclic amine forming a hydrogen bond interaction network with Asn253(6.55) and Glu169(5.30) side chains in the A2AAR, because A3 has a hydrophobic valine in the 5.30 position. No substantial A2A/A1 selectivity was observed for most compounds in the set, with only two compounds 17 and 50 having 10-fold selectivity to the A2AAR, and only one compound 8 with about 20-fold selectivity to A1 subtype. . At the same time, most of the newly discovered scaffolds boast compounds with very high ligand efficiency LE > 0.30 kcal/mol per heavy atom. Predicted models of ligand receptor interactions can suggest specific functional groups exposed to the extracellular opening of the binding pocket, and provide an accurate structural template for rational optimization of selectivity and chemical properties for these ligands.
Conclusions
Our results present one of the first examples of virtual ligand screening, which employs a high resolution crystal structure of a GPCR target. We show that for adenosine A2A receptor structure, which has a deep and well-defined binding pocket, virtual ligand screening can predict small molecule binders with success rates of as high as 41%. The 23 ligands selected by VLS from a 4 million compound library and confirmed active by A2AAR binding assays represent at least nine novel chemotypes, supporting high diversity of the hits generated through structure-based virtual screening. Two of the identified compounds had Ki values of 0.06 µM and below, and 11 had submicromolar binding affinity. As expected in screening with antagonist-bound model of the receptor, most ligands (10 out of 13 tested) were proved A2AAR antagonists in functional assays, while none showed agonistic activity. The virtual screening in this study did not explicitly target subtype selectivity, yielding hits that bind equally well to both A2A and A1 adenosine receptor subtypes. Most hit compounds, however are relatively small (<400 Da) and have high ligand binding efficiency (LE>0.3 kcal/mol per heavy atom), suitable for optimization of their subtype selectivity, affinity and chemical properties. Overall, the results demonstrate that high resolution structures of GPCR, combined with accurate docking and virtual ligand screening methods provide a highly efficient tool for identification of new GPCR antagonist chemotypes as lead candidates for drug discovery.
Experimental Section
Computational Methods
Generation of all-atom A2AAR models
The initial all-atom model of the adenosine A2A receptor was prepared from the PDB coordinates (PDB ID: 3EML)35 using molecular conversion procedure49, implemented in ICM molecular modeling software (Molsoft, LLC). The procedure includes the addition of hydrogen atoms to the PDB receptor structure, selection of the energetically favorable conformations of His, Asn and Gln side chains, and local minimization of polar hydrogens in the internal coordinates space.
For each of the 13 water configuration models tested, hydrogen atoms of the structured water molecules were co-optimized together with A2AAR hydrogens, while coordinates of water oxygen atoms were retained as in the crystal structure. The 3EMLW1 model included only one water molecule, wa, with the lowest B-factor = 39 (as in the PDB entry), the 3EMLW2 model comprised wa and wa14 (B-factor = 46), the 3EMLW3 model had wa, wa14 and wa5 (B-factor=62). Other water configurations were obtained by adding water molecules in the binding pocket in the order of their increasing B-factor.
Virtual ligand libraries for optimization and validation of A2AAR models
A diverse set of 23 known high affinity A2AAR antagonists was compiled from 8 A2AAR clinical candidates listed in Table 1 of ref.12, and additional 15 compounds in Figure 2 of ref.28. The all-atom molecular models of antagonists were built from their published 2-D structures. A library of 2000 decoy compounds was randomly selected from Chemdiv discovery collection of drug-like compounds (www.chemdiv.com).
Ligand docking and small scale VLS benchmark
To use ICM fast docking and VLS procedures, the receptor all-atom models were converted into energy potential maps calculated on a fine 3D grid (0.5 Å cell)49. The grid potential maps account for van der Waals, hydrogen-bonding, hydrophobic and electrostatic interactions between ligand and receptor50–51. The ligand was represented by an all-atom model and considered fully flexible in the potential field of the receptor. The ligand and decoy compounds were automatically docked into the AA2AR models using the Biased Probability Monte Carlo (BPMC) global energy minimization procedure52 and sorted according to their ICM binding scores. To ensure convergence of the Monte Carlo optimization, three independent runs of the docking procedure were performed, and the best scoring pose per compound was kept. No distance restraints or any other experimentally derived information was used in the ligand docking procedure. The docking procedure takes about 30 seconds of Intel Xeon 2.8 Ghz CPU time per compound, and was performed using a 100 processor Linux cluster.
Metrics for VLS benchmark performance
Based on the values of ICM binding scores for the docked compounds, we used several complementary metrics to assess VLS performance53. The Initial Enrichment Factor at 1% cutoff was calculated as:
where Lt and Dt are the total number of known ligands and decoy compounds in the dataset respectively, while Lf and Df are the number of known ligands and decoys respectively in the top 1% scoring fraction the database. Receiver Operator Characteristic (ROC) curves were plotted with True Positive rate (TP = Lf/Lt) on the Y axis vs. False Positive rate (FP = Df/Dt) on the X axis for different fractions f of the dataset.
Area under ROC curve (AUC) was calculated along with Normalized Square root AUC (NSQ_AUC) 47. For NSQ_AUC the area AUC* is calculated for the ROC curve plotted with X coordinate . The NSQ_AUC value is then calculated as:
The value of NSQ_AUC is more sensitive to initial enrichment than the commonly used linearAUC. The NSQ_AUC measure returns the value of 100 for any perfect separation of signal from noise and values close to 0 for a random subset of noise.
Additional ligand guided receptor optimization
A set of more than 200 conformational models with 3EMLW3 water configuration was generated by co-optimization of representative AA2AR antagonists in the binding pocket of the receptor model. The optimization was performed using BPMC method50,52, which allows extensive sampling of the flexible ligand and flexible receptor side chain conformations. The protein backbone and water oxygen atom coordinates were fixed to that of the crystal structure (PBD:3EML). For each of the 200 resulting conformational models, a small-scale VLS benchmarking was performed as described above and the model with the best NSQ_AUC value, 3EMLW3_opt was selected as an optimal model for VLS screening.
VLS of available compound libraries and selection of candidate A2AAR ligands
Virtual screening of a large library of available compounds was performed using the same ICM VLS procedure as in the small-scale benchmark above. The screening library was prepared from the Molsoft ScreenPub database of 4.3 million unique drug-like compounds available from more than 40 vendors by automatically removing compounds with reactive groups and molecular weight exceeding 500 Da. Based on docking results, compounds with an ICM binding score better than −32 kJ/mol were selected and clustered by chemical similarity with 0.3 Tanimoto distance cutoff. Predicted values of Ligand Efficiency were calculated as a ratio of ICM binding score to the number of heavy atoms (LEpred = −Score/NHA). Values of logP (octanol/water partition) and logS (solubility) were also predicted using algorithms implemented in the ICM software. In each chemical cluster, from 1 to 10 compounds were selected for experimental assays according to their binding score, LEpred values, chemical properties and on-shelf availability from vendors, resulting in 56 compounds purchased for the binding assays.
In Vitro and In Vivo Assays
The compounds selected by virtual screening were purchased from available screening collections of four vendors, Chembridge (www.Hit2Lead.com), Chemdiv (www.chemdiv.com), Enamine (www.enamine.com) and Sigma-Aldrich (www.Sigmaaldrich.com). Purity of compounds was equal to or greater than 96% as verified by liquid chromatography (HPLC) experiments performed by the vendors.
Binding assays in Sf9 membranes
Membranes highly expressing human A2AAR receptor were produced from the Sf9-baculoviral expression system as previously described. Frozen aliquots of cells were thawed and then resuspended in homogenization buffer (50 mM Hepes, pH 7.4). The cells were subjected to homogenization using a Nitrogen Cavitation Pump (30 min, 800 psi) following 30 strokes with a Dounce homogenizer. The cell debris and nucleolus were removed by centrifugation at 900 × g for 10 min, followed by centrifugation at 100,000 × g for 45 min to isolate the raw membrane fraction. The resulting membrane pellet was resuspended in the buffer containing 50 mM Hepes, pH 7.4, 800 mM NaCl, and the protein concentration was assayed using the BCA protein assay kit from Pierce (Rockford, IL, USA) using Bovine serum albumin (BSA) as a standard for the protein assay. The centrifugation-resuspension cycle was repeated until supernatant fraction did not contain any trance of soluble protein based on the BCA protein assay (typically six cycles). Prior to the ligand binding assays, the membrane pellets were resuspended in ligand binding buffer (TME: 50 mM Tris–HCl, 10 mM MgCl2, 0.5 mM EDTA, pH 7.4). The samples were tested for binding with tritiated compound 1 ([3H]ZM241385) (27.4 Ci/mmol) obtained from ARC Inc., St. Louis, USA. Crude plasma membranes (0.2–1 µg of total protein per reaction) were incubated for 30 min at room temperature with serial dilutions of the radioligand (0.05 – 10 nM). Incubations were rapidly terminated by filtration using a Tomtec Mach III cell harvester (Tomtec) through a 96-well GF/B filter plate (MultiScreen Harvest plate, Millipore Corp.), and rinsed five times with 500 µl of ice-cold buffer (50 mM Tris–HCl, pH 7.4). The harvest plates were dried and 30 µl of OptiPhase - HiSafe III scintillation liquid (Perkin-Elmer Life Sciences) was added. The bound radioactivity was measured using a Perkin Elmer Wallac Jet 1450 Microbeta scintillation counter. Nonspecific binding was determined in parallel reactions in the presence of an excess of compound 2 (100 µM, Sigma–Aldrich, USA), and specific binding was defined as the difference between total and nonspecific binding. All incubations were performed in triplicate, and independent experiments were repeated at least twice. Equilibrium dissociation constants (Ki) and maximal receptor levels (Bmax) were calculated from the results of saturation experiments using GraphPad Prism version 5 Software. For competition binding studies, the crude membranes were resuspended in ice-cold binding buffer (TME: 50 mM Tris-HCl, 10 mM MgCl2, 1 mM EDTA, pH 7.4), containing protease inhibitors (Complete protease inhibitor cocktail tablet, Roche Applied Science) and homogenized for 30 strokes with a Dounce homogenizer. Test ligand stock solutions were prepared in DMSO at a final concentration of 10 mM. Some of the test ligands have strong dye property that might cause problem in the assays at the high concentration of the compound, and therefore we tested ligands using full completion range. Identical aliquots of crude plasma membranes (0.2–5 µg of total protein per reaction) containing 10–14 different concentrations of the competing unlabelled ligands with 20 nM of tritiated compound 1 in 0.1 mL total volume. The reaction components were added in order of crude membrane, test ligand and radioligand. The final DMSO concentration was 10%. Reference compounds 1, 2 and 3 were tested with and without 10% DMSO in the reactions. After 60 min at room temperature with shaking, reactions were rapidly terminated by filtration and counted as mentioned above. Initial testing was preformed with in triplicate, and was verified with six replicates. Individual assay results are represented.
Experimental ligand efficiency45 (LE) was defined as LE = ΔG/NHA , where ΔG was the free energy of ligand binding (ΔG = −RT ln Ki), and NHA is the number of heavy atoms in the compound.
Binding and selectivity assays in mammalian membranes
[3H]DPCPX and [125I]AB-MECA were purchased from Amersham Biosciences (NL), tritiated compound 1 was obtained from Tocris Cookson, Ltd. (UK). CHO cells expressing the human adenosine A1 receptor were provided by Dr. Andrea Townsend-Nicholson, University College London. HEK293 cells stably expressing the human adenosine A2A receptor and CHO cells expressing the human adenosine A3 receptor were kind gifts from Dr. J. Wang (Biogen/IDEC, Cambridge, MA) Dr. K. N. Klotz (University of Wurzburg, Germany), respectively.
All compounds were tested in radioligand binding assays to determine their affinities at human adenosine A1 ([3H]DPCPX), A2A (tritiated compound 1), and A3 ([125I]AB-MECA) receptors as described previously in literature54 with the exception that nonspecific binding to the A2A receptor was determined in the presence of 10 µM concentration of 3a instead of 100 µM CPA and non-specific binding to the A3 receptor was determined by the addition of 100 µM compound 3. The incubation was terminated by filtration over Whatman GF/C filters under reduced pressure with a Brandel harvester (Gaithersburg, MD). Filters were washed three times with ice cold 50 mM Tris/HCl pH 7.4, placed in vials and counted.
Functional cAMP Accumulation Assays
HEK293 cells expressing the human adenosine A2A receptor were grown as a monolayer on 10 cm culture plates. For cAMP production and determination, 7500 cells/well were used on 384-well plates. The cells were incubated for 45 min at room temperature with or without test compounds at a 10 nM concentration of the agonist 3a (approximately an EC20 concentration), and with or without test compounds with a saturating concentration of 3a (10 µM). The assay medium contained cilostamide (50 µM), rolipram (50 µM), and adenosine deaminase (0.8 IU/mL). Incubation was stopped with detection mix and antibody solution was added, these two steps according to the instructions of the supplier. The assay was performed with the Lance cAMP 384 kit from Perkin-Elmer based on the competition of the sample’s cAMP with a europium-labeled cAMP tracer complex for binding sites on cAMP-specific antibodies labeled with Alexa Fluor dye.
Supplementary Material
Acknowledgments
We gratefully acknowledge support from the National Institutes of Health (GM071872 and GM074832) to R.A., I.K. and V.K. and the NIH Protein Structure Initiative grant (GM074961) to R.C.S. V.P.J was partly supported by Oulu Biocenter, Sigrid Joselius foundation and FP7 Marie Curie European Reintegration grant. JRL and APIJ are grateful for funding from the Dutch Top Institute Pharma (TIPharma), project number D1–105.
Abbreviations
- GPCR
G protein-coupled receptor
- AR
adenosine receptor
- A2AAR
subtype A2A
- β2AR
β2 adrenergic receptor
- TM
transmembrane
- EL2
extracellular loop 2
- VLS
virtual ligands screening
- PDB
protein databank
- RMSD
root mean square deviation
- LE
ligand efficiency
- ROC
receiver operating characteristic
- AUC
area under ROC curve
- NSQ_AUC
normalized square root AUC
- BPMC
biased probability Monte Carlo method
Footnotes
Supporting Information Available: Chemical structures, binding assay results and 3D binding models for all 56 experimentally tested compounds are presented in supplementary materials. This material is available free of charge via the Internet at http://pubs.acs.org.
References
- 1.Tyndall JD, Sandilya R. GPCR agonists and antagonists in the clinic. Med Chem. 2005;1:405–421. doi: 10.2174/1573406054368675. [DOI] [PubMed] [Google Scholar]
- 2.Lagerstrom MC, Schioth HB. Structural diversity of G protein-coupled receptors and significance for drug discovery. Nat Rev Drug Discov. 2008;7:339–357. doi: 10.1038/nrd2518. [DOI] [PubMed] [Google Scholar]
- 3.Jacobson KA. Introduction to adenosine receptors as therapeutic targets. Handb Exp Pharmacol. 2009:1–24. doi: 10.1007/978-3-540-89615-9_1. [DOI] [PMC free article] [PubMed] [Google Scholar]
- 4.Morelli M, Carta AR, Jenner P. Adenosine A(2A) Receptors and Parkinson's Disease. Handb Exp Pharmacol. 2009:589–615. doi: 10.1007/978-3-540-89615-9_18. [DOI] [PubMed] [Google Scholar]
- 5.Sebastiao AM, Ribeiro JA. Adenosine receptors and the central nervous system. Handb Exp Pharmacol. 2009:471–534. doi: 10.1007/978-3-540-89615-9_16. [DOI] [PubMed] [Google Scholar]
- 6.Mustafa SJ, Morrison RR, Teng B, Pelleg A. Adenosine receptors and the heart: role in regulation of coronary blood flow and cardiac electrophysiology. Handb Exp Pharmacol. 2009:161–188. doi: 10.1007/978-3-540-89615-9_6. [DOI] [PMC free article] [PubMed] [Google Scholar]
- 7.Headrick JP, Lasley RD. Adenosine receptors and reperfusion injury of the heart. Handb Exp Pharmacol. 2009:189–214. doi: 10.1007/978-3-540-89615-9_7. [DOI] [PMC free article] [PubMed] [Google Scholar]
- 8.Wilson CN, Nadeem A, Spina D, Brown R, Page CP, Mustafa SJ. Adenosine receptors and asthma. Handb Exp Pharmacol. 2009:329–362. doi: 10.1007/978-3-540-89615-9_11. [DOI] [PMC free article] [PubMed] [Google Scholar]
- 9.Blackburn MR, Vance CO, Morschl E, Wilson CN. Adenosine receptors and inflammation. Handb Exp Pharmacol. 2009:215–269. doi: 10.1007/978-3-540-89615-9_8. [DOI] [PubMed] [Google Scholar]
- 10.Fishman P, Bar-Yehuda S, Synowitz M, Powell JD, Klotz KN, Gessi S, Borea PA. Adenosine receptors and cancer. Handb Exp Pharmacol. 2009:399–441. doi: 10.1007/978-3-540-89615-9_14. [DOI] [PMC free article] [PubMed] [Google Scholar]
- 11.Yan L, Burbiel JC, Maass A, Muller CE. Adenosine receptor agonists: from basic medicinal chemistry to clinical development. Expert Opin Emerg Drugs. 2003;8:537–576. doi: 10.1517/14728214.8.2.537. [DOI] [PubMed] [Google Scholar]
- 12.Jacobson KA, Gao ZG. Adenosine receptors as therapeutic targets. Nat Rev Drug Discov. 2006;5:247–264. doi: 10.1038/nrd1983. [DOI] [PMC free article] [PubMed] [Google Scholar]
- 13.Thomas GS, Thompson RC, Miyamoto MI, Ip TK, Rice DL, Milikien D, Lieu HD, Mathur VS. The RegEx trial: a randomized, double-blind, placebo- and active-controlled pilot study combining regadenoson, a selective A(2A) adenosine agonist, with low-level exercise, in patients undergoing myocardial perfusion imaging. J Nucl Cardiol. 2009;16:63–72. doi: 10.1007/s12350-008-9001-9. [DOI] [PubMed] [Google Scholar]
- 14.Klabunde T, Hessler G. Drug design strategies for targeting G-protein-coupled receptors. Chembiochem. 2002;3:928–944. doi: 10.1002/1439-7633(20021004)3:10<928::AID-CBIC928>3.0.CO;2-5. [DOI] [PubMed] [Google Scholar]
- 15.Schnur D, Beno BR, Good A, Tebben A. Approaches to target class combinatorial library design. Methods Mol Biol. 2004;275:355–378. doi: 10.1385/1-59259-802-1:355. [DOI] [PubMed] [Google Scholar]
- 16.Heilker R, Wolff M, Tautermann CS, Bieler M. G-protein-coupled receptor-focused drug discovery using a target class platform approach. Drug Discov Today. 2009;14:231–240. doi: 10.1016/j.drudis.2008.11.011. [DOI] [PubMed] [Google Scholar]
- 17.Marone G, Plaut M, Lichtenstein LM. Characterization of a specific adenosine receptor on human lymphocytes. J Immunol. 1978;121:2153–2159. [PubMed] [Google Scholar]
- 18.Daly JW. Adenosine receptors: targets for future drugs. J Med Chem. 1982;25:197–207. doi: 10.1021/jm00345a001. [DOI] [PubMed] [Google Scholar]
- 19.Snyder SH, Katims JJ, Annau Z, Bruns RF, Daly JW. Adenosine receptors and behavioral actions of methylxanthines. Proc Natl Acad Sci U S A. 1981;78:3260–3264. doi: 10.1073/pnas.78.5.3260. [DOI] [PMC free article] [PubMed] [Google Scholar]
- 20.Daly JW, Bruns RF, Snyder SH. Adenosine receptors in the central nervous system: relationship to the central actions of methylxanthines. Life Sci. 1981;28:2083–2097. doi: 10.1016/0024-3205(81)90614-7. [DOI] [PubMed] [Google Scholar]
- 21.Beukers MW, Chang LC, von Frijtag Drabbe Kunzel JK, Mulder-Krieger T, Spanjersberg RF, Brussee J, AP IJ. New, non-adenosine, high-potency agonists for the human adenosine A2B receptor with an improved selectivity profile compared to the reference agonist N-ethylcarboxamidoadenosine. J Med Chem. 2004;47:3707–3709. doi: 10.1021/jm049947s. [DOI] [PubMed] [Google Scholar]
- 22.Sattin A, Rall TW. The effect of adenosine and adenine nucleotides on the cyclic adenosine 3', 5'-phosphate content of guinea pig cerebral cortex slices. Mol Pharmacol. 1970;6:13–23. [PubMed] [Google Scholar]
- 23.Perreira M, Jiang JK, Klutz AM, Gao ZG, Shainberg A, Lu C, Thomas CJ, Jacobson KA. "Reversine" and its 2-substituted adenine derivatives as potent and selective A3 adenosine receptor antagonists. J Med Chem. 2005;48:4910–4918. doi: 10.1021/jm050221l. [DOI] [PMC free article] [PubMed] [Google Scholar]
- 24.Cacciari B, Bolcato C, Spalluto G, Klotz KN, Bacilieri M, Deflorian F, Moro S. Pyrazolo-triazolo-pyrimidines as adenosine receptor antagonists: A complete structure-activity profile. Purinergic Signal. 2007;3:183–193. doi: 10.1007/s11302-006-9027-x. [DOI] [PMC free article] [PubMed] [Google Scholar]
- 25.Colotta V, Lenzi O, Catarzi D, Varano F, Filacchioni G, Martini C, Trincavelli L, Ciampi O, Pugliese AM, Traini C, Pedata F, Morizzo E, Moro S. Pyrido[2,3-e]-1,2,4-triazolo[4,3-a]pyrazin-1-one as a new scaffold to develop potent and selective human A3 adenosine receptor antagonists. Synthesis, pharmacological evaluation, and ligand-receptor modeling studies. J Med Chem. 2009;52:2407–2419. doi: 10.1021/jm8014876. [DOI] [PubMed] [Google Scholar]
- 26.Cristalli G, Cacciari B, Dal Ben D, Lambertucci C, Moro S, Spalluto G, Volpini R. Highlights on the development of A(2A) adenosine receptor agonists and antagonists. ChemMedChem. 2007;2:260–281. doi: 10.1002/cmdc.200600193. [DOI] [PubMed] [Google Scholar]
- 27.Cristalli G, Lambertucci C, Marucci G, Volpini R, Dal Ben D. A2A adenosine receptor and its modulators: overview on a druggable GPCR and on structure-activity relationship analysis and binding requirements of agonists and antagonists. Curr Pharm Des. 2008;14:1525–1552. doi: 10.2174/138161208784480081. [DOI] [PubMed] [Google Scholar]
- 28.Mantri M, de Graaf O, van Veldhoven J, Goblyos A, von Frijtag Drabbe Kunzel JK, Mulder-Krieger T, Link R, de Vries H, Beukers MW, Brussee J, Ijzerman AP. 2-Amino-6-furan-2-yl-4-substituted nicotinonitriles as A2A adenosine receptor antagonists. J Med Chem. 2008;51:4449–4455. doi: 10.1021/jm701594y. [DOI] [PubMed] [Google Scholar]
- 29.Michielan L, Bacilieri M, Schiesaro A, Bolcato C, Pastorin G, Spalluto G, Cacciari B, Klotz KN, Kaseda C, Moro S. Linear and nonlinear 3D-QSAR approaches in tandem with ligand-based homology modeling as a computational strategy to depict the pyrazolo-triazolo-pyrimidine antagonists binding site of the human adenosine A2A receptor. J Chem Inf Model. 2008;48:350–363. doi: 10.1021/ci700300w. [DOI] [PubMed] [Google Scholar]
- 30.van Veldhoven JP, Chang LC, von Frijtag Drabbe Kunzel JK, Mulder-Krieger T, Struensee-Link R, Beukers MW, Brussee J, AP IJ. A new generation of adenosine receptor antagonists: from di- to trisubstituted aminopyrimidines. Bioorg Med Chem. 2008;16:2741–2752. doi: 10.1016/j.bmc.2008.01.013. [DOI] [PubMed] [Google Scholar]
- 31.Cherezov V, Rosenbaum DM, Hanson MA, Rasmussen SG, Thian FS, Kobilka TS, Choi HJ, Kuhn P, Weis WI, Kobilka BK, Stevens RC. High-resolution crystal structure of an engineered human beta2-adrenergic G protein-coupled receptor. Science. 2007;318:1258–1265. doi: 10.1126/science.1150577. [DOI] [PMC free article] [PubMed] [Google Scholar]
- 32.Rosenbaum DM, Cherezov V, Hanson MA, Rasmussen SG, Thian FS, Kobilka TS, Choi HJ, Yao XJ, Weis WI, Stevens RC, Kobilka BK. GPCR engineering yields high-resolution structural insights into beta2-adrenergic receptor function. Science. 2007;318:1266–1273. doi: 10.1126/science.1150609. [DOI] [PubMed] [Google Scholar]
- 33.Hanson MA, Cherezov V, Griffith MT, Roth CB, Jaakola VP, Chien EY, Velasquez J, Kuhn P, Stevens RC. A specific cholesterol binding site is established by the 2.8 A structure of the human beta2-adrenergic receptor. Structure. 2008;16:897–905. doi: 10.1016/j.str.2008.05.001. [DOI] [PMC free article] [PubMed] [Google Scholar]
- 34.Warne T, Serrano-Vega MJ, Baker JG, Moukhametzianov R, Edwards PC, Henderson R, Leslie AG, Tate CG, Schertler GF. Structure of a beta(1)-adrenergic G-protein-coupled receptor. Nature. 2008;454:486–491. doi: 10.1038/nature07101. [DOI] [PMC free article] [PubMed] [Google Scholar]
- 35.Jaakola VP, Griffith MT, Hanson MA, Cherezov V, Chien EY, Lane JR, Ijzerman AP, Stevens RC. The 2.6 angstrom crystal structure of a human A2A adenosine receptor bound to an antagonist. Science. 2008;322:1211–1217. doi: 10.1126/science.1164772. [DOI] [PMC free article] [PubMed] [Google Scholar]
- 36.Poucher SM, Keddie JR, Singh P, Stoggall SM, Caulkett PW, Jones G, Coll MG. The in vitro pharmacology of ZM 241385, a potent, non-xanthine A2a selective adenosine receptor antagonist. Br J Pharmacol. 1995;115:1096–1102. doi: 10.1111/j.1476-5381.1995.tb15923.x. [DOI] [PMC free article] [PubMed] [Google Scholar]
- 37.Cavasotto CN, Orry AJ. Ligand docking and structure-based virtual screening in drug discovery. Curr Top Med Chem. 2007;7:1006–1014. doi: 10.2174/156802607780906753. [DOI] [PubMed] [Google Scholar]
- 38.Katritch V, Reynolds KA, Cherezov V, Hanson MA, Roth CB, Yeager M, Abagyan R. Analysis of full and partial agonists binding to beta2-adrenergic receptor suggests a role of transmembrane helix V in agonist-specific conformational changes. J Mol Recognit. 2009;22:307–318. doi: 10.1002/jmr.949. [DOI] [PMC free article] [PubMed] [Google Scholar]
- 39.Reynolds KA, Katritch V, Abagyan R. Identifying conformational changes of the beta(2) adrenoceptor that enable accurate prediction of ligand/receptor interactions and screening for GPCR modulators. J Comput Aided Mol Des. 2009;23:273–288. doi: 10.1007/s10822-008-9257-9. [DOI] [PMC free article] [PubMed] [Google Scholar]
- 40.de Graaf C, Rognan D. Selective structure-based virtual screening for full and partial agonists of the beta2 adrenergic receptor. J Med Chem. 2008;51:4978–4985. doi: 10.1021/jm800710x. [DOI] [PubMed] [Google Scholar]
- 41.Kolb P, Rosenbaum DM, Irwin JJ, Fung JJ, Kobilka BK, Shoichet BK. Structure-based discovery of {beta}2-adrenergic receptor ligands. Proc Natl Acad Sci U S A. 2009 doi: 10.1073/pnas.0812657106. [DOI] [PMC free article] [PubMed] [Google Scholar]
- 42.Ballesteros JA, Weinstein H. Integrated methods for the construction of three dimensional models and computational probing of structure–function relations in G-protein coupled receptors. Methods Neurosci. 1995;25:366–428. [Google Scholar]
- 43.Okuno Y, Tamon A, Yabuuchi H, Niijima S, Minowa Y, Tonomura K, Kunimoto R, Feng C. GLIDA: GPCR--ligand database for chemical genomics drug discovery--database and tools update. Nucleic Acids Res. 2008;36:D907–D912. doi: 10.1093/nar/gkm948. [DOI] [PMC free article] [PubMed] [Google Scholar]
- 44.Cusack NJ, Hourani SM. 5'-N-ethylcarboxamidoadenosine: a potent inhibitor of human platelet aggregation. Br J Pharmacol. 1981;72:443–447. doi: 10.1111/j.1476-5381.1981.tb10995.x. [DOI] [PMC free article] [PubMed] [Google Scholar]
- 45.Hopkins AL, Groom CR, Alex A. Ligand efficiency: a useful metric for lead selection. Drug Discov Today. 2004;9:430–431. doi: 10.1016/S1359-6446(04)03069-7. [DOI] [PubMed] [Google Scholar]
- 46.Brown J, Brown CA. Evaluation of reactive blue 2 derivatives as selective antagonists for P2Y receptors. Vascul Pharmacol. 2002;39:309–315. doi: 10.1016/s1537-1891(03)00030-2. [DOI] [PubMed] [Google Scholar]
- 47.Katritch V, Rueda M, Lam PC, Yeager M, Abagyan R. GPCR 3D Homology Models for Ligand Screening: Lessons Learned from Blind Predictions of Adenosine A2a Receptor complex. Proteins. 2009 doi: 10.1002/prot.22507. in press. [DOI] [PMC free article] [PubMed] [Google Scholar]
- 48.Bottegoni G, Kufareva I, Totrov M, Abagyan R. Four-dimensional docking: a fast and accurate account of discrete receptor flexibility in ligand docking. J Med Chem. 2009;52:397–406. doi: 10.1021/jm8009958. [DOI] [PMC free article] [PubMed] [Google Scholar]
- 49.Abagyan RA, Orry A, Raush E, Budagyan L, Totrov M. ICM Manual, 3.0. La Jolla, CA: MolSoft LLC; 2009. [Google Scholar]
- 50.Totrov M, Abagyan R. Flexible protein-ligand docking by global energy optimization in internal coordinates. Proteins. 1997 Suppl 1:215–220. doi: 10.1002/(sici)1097-0134(1997)1+<215::aid-prot29>3.3.co;2-i. [DOI] [PubMed] [Google Scholar]
- 51.Totrov M. Accurate and efficient generalized born model based on solvent accessibility: derivation and application for LogP octanol/water prediction and flexible peptide docking. J Comput Chem. 2004;25:609–619. doi: 10.1002/jcc.10392. [DOI] [PubMed] [Google Scholar]
- 52.Abagyan R, Totrov M. Biased probability Monte Carlo conformational searches and electrostatic calculations for peptides and proteins. J Mol Biol. 1994;235:983–1002. doi: 10.1006/jmbi.1994.1052. [DOI] [PubMed] [Google Scholar]
- 53.Truchon JF, Bayly CI. Evaluating virtual screening methods: good and bad metrics for the "early recognition" problem. J Chem Inf Model. 2007;47:488–508. doi: 10.1021/ci600426e. [DOI] [PubMed] [Google Scholar]
- 54.Chang LC, Spanjersberg RF, von Frijtag Drabbe Kunzel JK, Mulder-Krieger T, Brussee J, Ijzerman AP. 2,6-disubstituted and 2,6,8-trisubstituted purines as adenosine receptor antagonists. J Med Chem. 2006;49:2861–2867. doi: 10.1021/jm050640i. [DOI] [PubMed] [Google Scholar]
Associated Data
This section collects any data citations, data availability statements, or supplementary materials included in this article.