Abstract
Neuronal apoptosis following ischemia can be mediated by a caspase-dependent pathway, which involves the mitochondrial release of cytochrome c that initiates a cascade of caspase activation. In addition, there is a caspase-independent pathway, which is mediated by the release of apoptosis-inducing factor (AIF). Using caspase-inhibitor gene therapy, we investigated the roles of caspases on the mitochondrial release of cyt c and the release of AIF. Specifically, we used herpes simplex virus-1 amplicon vectors to ectopically express a viral caspase inhibitor (crmA or p35) in mixed cortical cultures exposed to oxygen/glucose deprivation. Overexpression of either crmA or p35 (but not the caspase-3 inhibitor DEVD) inhibited the release of AIF; this suggests that there can be cross-talk between the caspase-dependent and the ostensibly caspase-independent pathway. In addition, both crmA overexpression and DEVD inhibited cyt c release, suggesting a positive feedback loop involving activated caspases stimulating cyt c release.
Keywords: Cytochrome c, Apoptosis-Inducing Factor, Oxygen Glucose Deprivation
Introduction
Neuronal ischemia begets an energy crisis that is exacerbated by a buildup of synaptic excitatory amino acid (EAA) neurotransmitters. This buildup of EAAs (predominantly glutamate) leads to excessive calcium influx which can initiate a cascade resulting in necrotic death or induction of apoptotic pathways through disruption of mitochondrial function [14]. Though necrosis characterizes most neuron death post-ischemia, death in the penumbra region has been shown to be mostly apoptotic [29] and possibly to have the greatest potential for effective treatment [5, 23, 24].
The induction of apoptosis by EAAs is inextricably linked to mitochondrial disruption [25] and the release of two crucial proapoptotic proteins - cytochrome c (cyt c) and the more recently characterized flavoprotein, apoptosis-inducing factor (AIF) [26]. The two operate, mostly, along separate pathways. Cyt c induces apoptosis through a caspase protein cascade [4] a caspase-dependent pathway. Whereas, after mitochondrial release, AIF translocates to the nucleus where it binds with DNA, inducing chromatin condensation and DNA fragmentation [6, 8, 9, 26]. Along with other proteins, it may also act as a potent DNAase. Both functions can lead to DNA degradation and apoptosis [4] in a caspase-independent manner.
Despite the apparent separation of the caspase-dependent and independent pathways, there is evidence of crosstalk between the two [8]. Caspases and the caspase activated proteins t-Bid and Eg1-1 can trigger the release of AIF from the mitochondria [12, 17], while the release of AIF is suppressed by caspase inhibitors such as zVAD-fmk [1, 8, 12, 17, 28]. These latter data support the occurrence of both crosstalk and feedback as complications in the understanding of caspase-dependent and independent pathways.
In this study, we inhibit caspase activity through a gene therapy or a pharmacological route, in order to investigate the effects of such inhibition on the release of cyt c and AIF. This inhibition allows for further investigation of crosstalk between the caspase dependent and independent pathways and whether feedback by caspases is a factor in the release of cyt c.
Materials and Methods
Culture preparation
Cortical cultures were prepared from day 18 fetal Sprague-Dawley rats by standard techniques [2]. Tissue was treated with papain (Worthington, Lakewood, NJ) and dissociated through an 80μm cell strainer and resuspended in modified MEM media (Tissue Culture Facility UCSF, CA) supplemented with 10% horse serum (HyClone, Logan, Utah). Cells were plated at 1.2 × 10⁵ cells/cm2 on coverslips coated with poly-D-lysine (Sigma, St. Louis, MO). Under these conditions, cultures are 20–30% neuronal. Experiments were conducted on days 10–12 of culturing.
Vector and Viral Preparations
Herpes simplex virus-1 amplicon vectors containing β-gal as a reporter gene and the gene for one of the viral caspase inhibitors, crmA (from cowpox virus) or p35 (from baculovirus), were constructed as previously reported [18]. Control vectors expressed β-gal alone. Plasmids were inserted into HSV-1 amplicon containing crmA and P35 were generated using standard methods [10]. The Viral titers were ~0.8–2 × 10⁷ particles/mL.
Translocation of cytochrome c and AIF release post-OGD with viral vectors and DEVD
Cells on coverslips were infected with 10,000 viral particles/cover slip (constant MOI of 0.03) with indicated vector preparations and incubated for 18–24 hours as described [27]. Under these conditions, 45% of neurons and 5% of glia were infected [18]. Cells were exposed to oxygen/glucose deprivation (OGD-treated cultures) by replacing cell media with 0mM glucose MEM (made in-house) and incubating in an anaerobic environment of 90% nitrogen, 5% CO2 and 5% hydrogen for 3 hours followed by 3 hours of normoxic/normoglycemic conditions before fixation in cold methanol. In control cultures, media was changed to MEM containing 5mM glucose and left in normoxic conditions. Numbers of cells between the control and experimental wells did not differ (data not shown) with this insult protocol. In addition, cells were exposed to caspase-3 inhibitor I (DEVD) (Calbiochem, EMD Biosciences, San Diego, CA) at 1nM (this dose most robustly inhibited cyt c release) in DMSO in lieu of viral infection following the procedure described above. The higher concentration of DEVD (1uM) was neurotoxic for the cell culture. Experiments were repeated at least three times.
Cytochrome c staining
Cold methanol-fixed cultures were treated with Triton X (0.2% in PBS) for 30 minutes and blocked with 3% bovine albumin serum in Triton X (0.2% in PBS) for 30 minutes before addition of primary anti-cytochrome c antibody (1/200 dilution) (BD Pharmingen, San Jose, CA) in 0.1% Triton X 1% BSA in PBS for 24 hours. Secondary biotinylated antigoat antibody was conjugated to FITC (1/200 dilution) (Vector, Burlingame, CA) and added in 0.1% Triton X 1% BSA in PBS for 18 hours. Nuclei were visualized with DAPI staining.
AIF Staining
Cold methanol-fixed cultures were blocked in 5% milk and 5% rabbit serum in PBS (blocking solution) for 1 hour and then treated with Triton X (0.2% in PBS) for 10 minutes before addition of the primary antibody anti-AIF (1/200 dilution) (Santa Cruz Biotechnology, Santa Cruz, CA) in blocking solution for 24 hours. Secondary antibody biotinylated antigoat conjugated to FITC (1/200 dilution) (Vector, Burlingame, CA) in blocking solution was then added for 18 hours. Nuclei were visualized with DAPI staining.
Assays and Data Analysis
Using a representative sample of 30 images per coverslip, the amount of cytochrome c or AIF was detected using an Olympus IX70 Fluorescent Light Microscope and Metamorph Imaging Software (Molecular Devices, Sunnyvale, CA). Data were collected in the form of total antibody (anti-cytochrome c or anti-AIF)/FITC fluorescence (490 nm). As a control for background fluorescence, fluorescence intensities of cultures lacking primary antibody but stained with FITC secondary antibody were subtracted from intensity images of cultures stained with anti-cytochrome c or anti-AIF. From subtracted images, the amount of cytochrome c or AIF release was determined using in-house journals (automated computer analysis) within Metamorph. Intensity values were corrected for number of cells/field. The intensity value obtained for the OGD-treated cells was expressed as a percentage of the value obtained for control-treated cells (normoxia/normoglycemia). Fig. 1 is a representative sample of staining and demonstrates the differences in total fluorescence obtained with different treatments, that could be used to calculate the release of cyt c and AIF into the cytoplasm.
Fig 1.
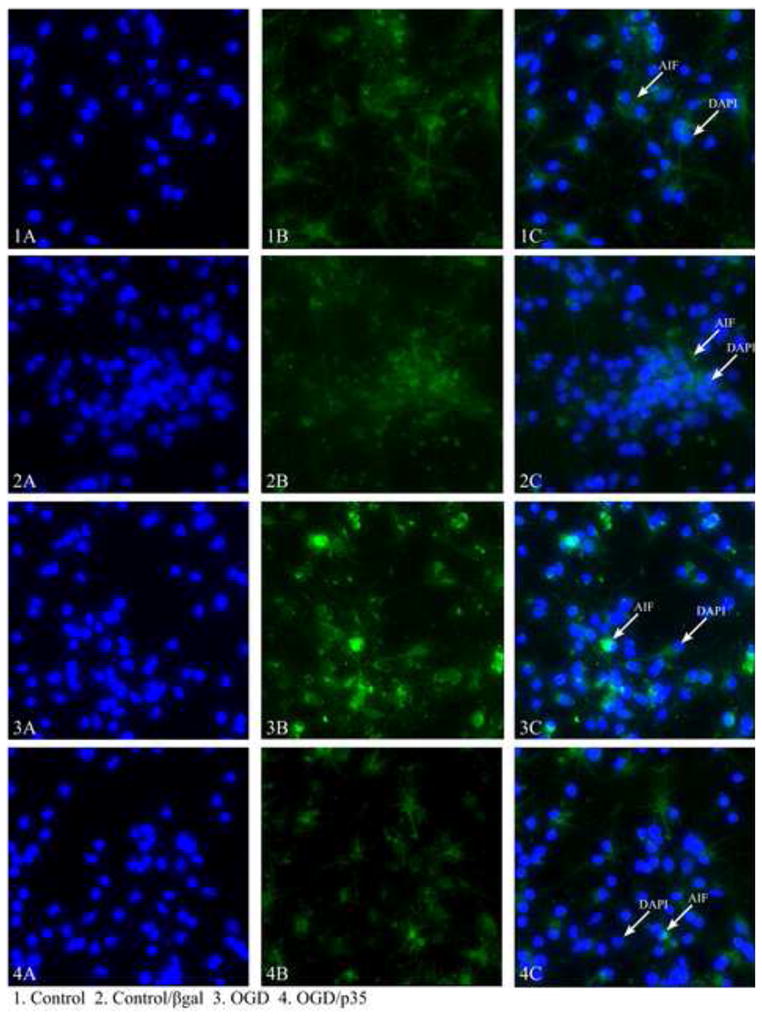
Representative images of AIF staining in cortical cultures showing the differences in the amount of fluorescence between control and experimental cells. 1A) DAPi staining of the nuclei of control cells 1B) AIF staining of control cells, not treated with OGD 1C) overlaid staining of AIF and DAPi, 2A) DAPi staining of the nuclei of cells treated with βgal without OGD 2B) AIF staining of βgal treated cells 2C) Overlaid staining of AIF and DAPi 3A) DAPi staining of the nuclei of OGD treated cells 3B) AIF staining of OGD treated cells 3C) overlaid staining of AIF and DAPi, 4A) DAPi staining of OGD and p35 treated cells 4B) AIF staining of OGD and p35 treated cell 4C) Overlaid staining of AIF and DAPi.
Statistics
Statistical analysis was done using one-way ANOVA on SigmaStat program (Jandel, San Rafael, Ca), following by Tukey post-hoc test.
Results
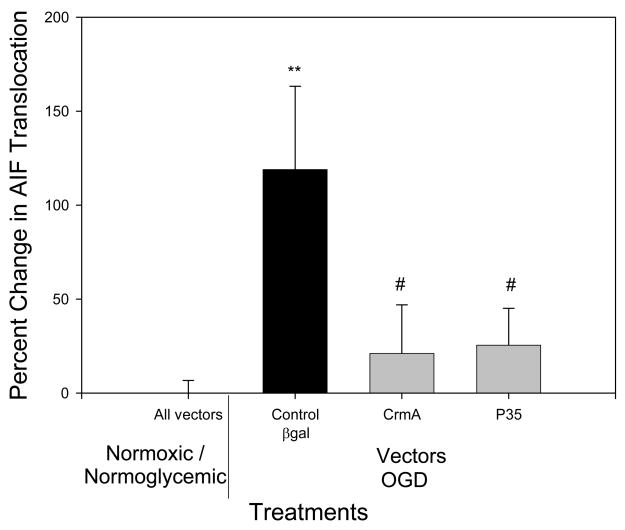
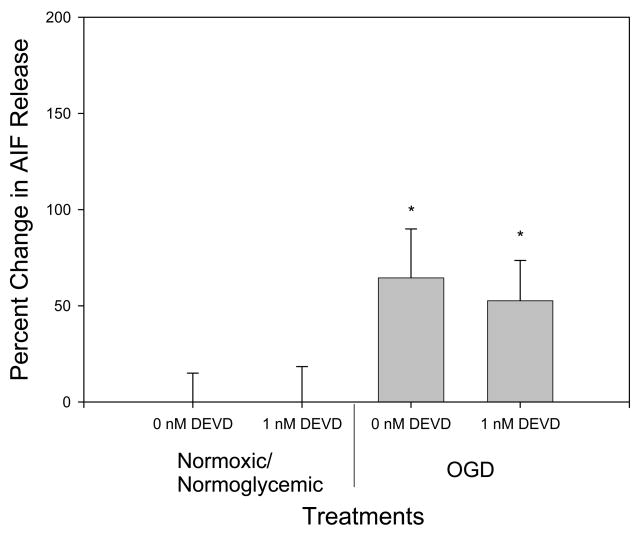
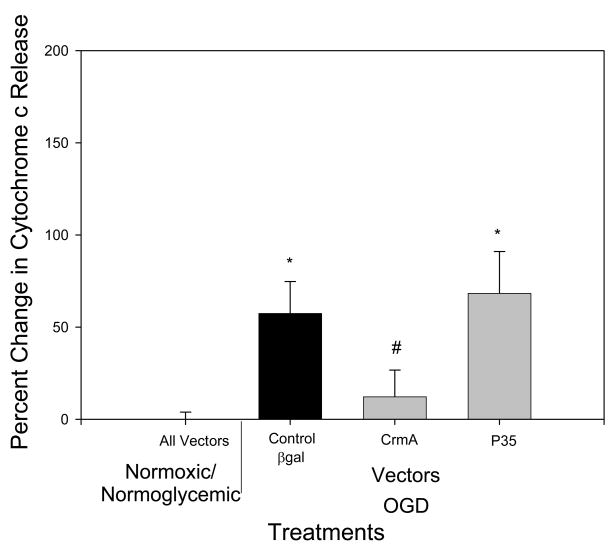
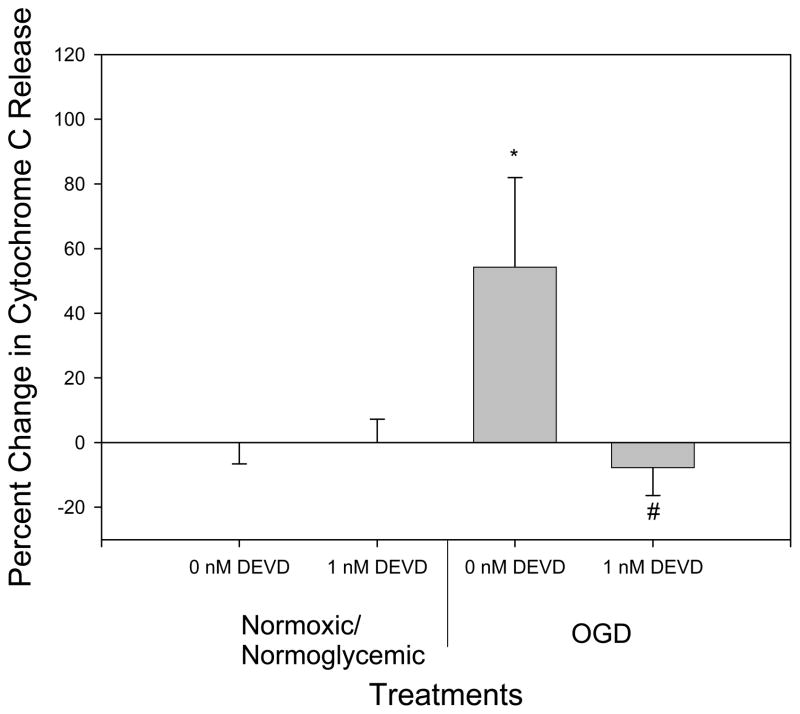
OGD treatment alone resulted in an increased translocation of AIF, but overexpression of the caspase inhibitor crmA or p35 completely inhibited OGD-induced AIF release (p<.05 versus B-gal controls; n.s. versus normoxia/normoglycemia) (Fig 2), even though they are thought to be relevant only to the caspase-dependent pathway. Differences in amount of staining of control, Bgal, OGD/Bgal and OGD/p35 are shown in Fig 1. Previously, we showed transfection efficiency with plasmid expressing Bgal alone − 50% of neurons and 5% of glia were infected [27]. Given this result, we treated cultures with the caspase-3 inhibitor DEVD. Both control and DEVD-treated cultures exposed to OGD showed an increase in AIF release (p <.05) as compared to normoxic/normoglycemic cultures. There was no significant difference in AIF release between the control and DEVD cultures. Therefore, DEVD failed to reproduce the inhibition of AIF release by crmA or p35 (Fig 3). In both cases there was no significant difference in the number of cells at the end of the treatment between control and experimental (data not shown). Cyt c release was triggered by OGD, and this was completely blocked by overexpression of crmA (p < .05 versus B-gal control; n.s. versus normoxia/normoglycemic); in contrast, p35 offered no protection (Fig 4). However, DEVD completely blocked OGD-induced, cyt c release (Fig 5).
Fig 2.
Effect of overexpression of crmA and p35 on AIF translocation. In control cultures, OGD increased AIF translocation 100% (relative to normoxic/normoglycemic cultures expressing reporter gene), whereas overexpression of crmA or p35 entirely blocked AIF translocation (relative to normoxic/normoglycemic cultures expressing either crmA or p35). n=16 to 20
** p<0.01 as compared to normoxic/normoglycemic cells treated with βgal.
# p<0.05 as compared to βgal/OGD.
Fig 3.
Effect of DEVD on AIF release. OGD treatment caused a significant increase in AIF translocation. 1nM DEVD provided no protection against OGD-induced AIF release. * Significantly different from control (p<0.05). n=16 to 20.
Fig 4.
Effect of overexpression of crmA or p35 on cytochrome c release. There was no significant difference between normoxic/normoglycemic wells treated with the different vectors, so they are represented as one point on the graph and all set to zero (All vectors). In control cultures, OGD increased cyt c release 50% (relative to normoxic/normoglycemic cultures expressing reporter gene); crmA, but not p35, blocked such cyt c release (relative to normoxic/normoglycemic cultures overexpressing crmA or p35). n=16–20
* p=0.05 as compared to normoxic/normoglycemic cells treated with βgal
# p<0.05 as compared to βgal/OGD.
Fig 5.
Effect of DEVD on cytochrome c translocation. Under OGD conditions with 0nM DEVD, there was a significant increase in cytochrome c translocation as compared with control conditions (normoxic/normoglycemic 0nM DEVD). 1 nM DEVD blocked OGD-induced cyt c release, relative to normoxic/normoglycemic controls. n=16 to 20.
* Significantly different from control (p<0.05).
# Significantly different from 0nM DEVD (p<0.05).
Discussion
Two separate apoptotic pathways, caspase-dependent and caspase-independent that are mediated by the release of cyt c and AIF respectively are involved in ischemic injury. Using gene therapy approaches, we determined the effects of expression of the viral caspase inhibitors crmA and p35 on the release of these apoptotic initiators. CrmA is a cytokine response modifier in cowpox virus which inhibits caspases 1 and 8 [15, 16], while p35, found in baculovirus, inhibits caspases 1, 3, 6, 7, 8, and 10 [3, 30]. The expression of apoptosis-inhibitors by viruses has been interpreted as a defense mechanism against host organism to engulf and kill infected cell. We have shown previously that crmA and p35 can protect against heat shock and domoic acid, but not against kainic acid or aglycemia [18].
In the present study, expression of crmA or p35 inhibited AIF release in OGD-treated cortical cultures, suggesting that activated caspases triggered AIF release. There is precedent for such cross-talk between the caspase-independent and dependent pathways [8]. As reviewed in the Introduction, activated caspases can trigger, and caspase inhibitors can suppress mitochondrial release of AIF in cell lines. AIF might also be more efficient in the presence of an apoptotic inducer [13, 27]. In contrast, we observed that DEVD failed to inhibit AIF release. Thus, if crosstalk is occurring in the present case, it perhaps is through caspases inhibited by crmA and p35, but not by DEVD. AIF can be released by activated caspase 8 [26], and both crmA and p35 inhibit caspase 8. In contrast, DEVD used in this study is primarily a caspase 3 inhibitor and only weakly inhibits caspase-8 (see manufacturer information).
There may be another interpretation of these data. The inability of DEVD to mimic the effects of crmA and p35 presents the possibility that crmA and p35 are protecting upstream of AIF release. Formation of the permeability transition (PT) pore in mitochondria resulting in the release of AIF and cyt c [26] is crucial to initiating apoptosis. CrmA and p35, but not DEVD maintain mitochondrial potential and ATP availability, [20] thus inhibiting PT formation [26] and preventing AIF leakage from the mitochondria.
The generation of reactive oxygen species (ROS) following an excitotoxic insult is a critical step in the subsequent apoptosis, and p35’s inhibition of AIF release may reflect its ability to inhibit ROS generation (which is hypothesized to be due to its protein structure of aminothiols and its ability to bind metals) [21]. Whether crmA or DEVD have similar anti-oxidant activities is unknown; if crmA did not and/or DEVD did, it would eliminate the inhibition of ROS generation as an explanation for the differential effects of crmA and p35 versus DEVD.
As a second finding, crmA expression or DEVD administration but not p35, blocked OGD-induced cyt c release. This suggests that the seemingly unidirectional cascade leading from cyt c release to caspase activation contains, instead, a positive feedback loop, whereby activated caspases trigger further release of cyt c. As discussed above, there is evidence that caspase 2, the tumor suppressor protein P53 cleaved by caspases and caspase 3 and 7 are all involved in a feedback loop resulting in release of cyt c [11, 17, 22]. Such a loop could theoretically involve activated caspase acting directly upon mitochondria, or through indirect means.
Of note, while crmA inhibited cyt c release, p35 failed to do so. Of relevance, the actions of the two are not identical; for example, overexpression of p35, but not crmA decreases hippocampal excitotoxicity [19], and in apoptin-induced apoptosis in virally-exposed tumor cells, p35 decreases apoptosis without decreasing cyt c release, whereas crmA did the opposite [7]. Thus, while crmA- and p35-targeted some of the same caspases, they may do so to different degrees. Treatment of DEVD decreased cyt c release, implicating caspase-3 in the process. Of note, higher concentrations of DEVD were neurotoxic, suggesting that excessive inhibition of apoptosis might increase necrotic death, highlighting the protective effect of apoptosis in minimizing injury to neighboring cells [18].
Apoptotic pathways are complex networks of feedback loops, activators and inhibitors. The current data expand information concerning apoptosis so that eventually there will be sufficient knowledge to afford opportunities for therapeutic intervention in the crucial hours post-stroke.
Fig 6.
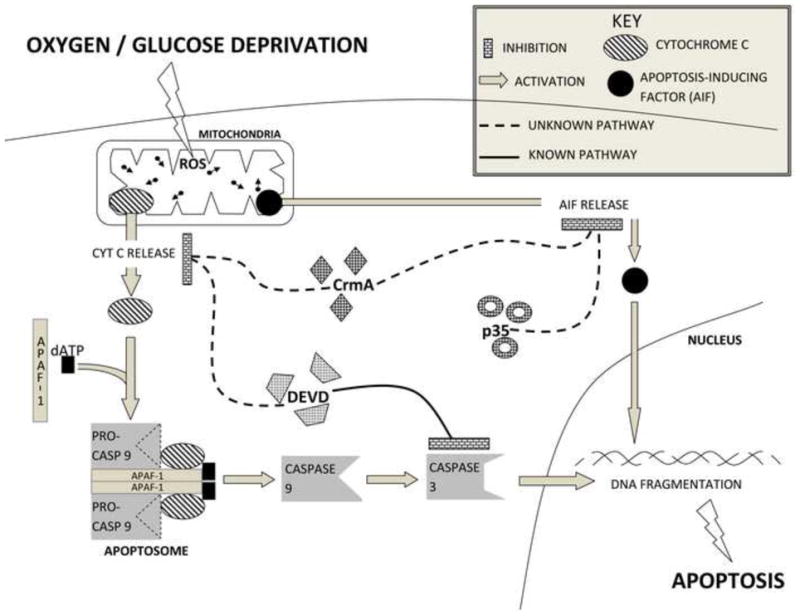
Summary graph demonstrating inhibition of cyt c release by crmA and DEVD. AIF release was blocked by crmA and p35 but not by DEVD. There is the cross-talk between caspase-dependent and caspase-independent pathways.
Acknowledgments
This work was supported by the NIH grant 2P01 NS37520 to RMS.
Footnotes
Publisher's Disclaimer: This is a PDF file of an unedited manuscript that has been accepted for publication. As a service to our customers we are providing this early version of the manuscript. The manuscript will undergo copyediting, typesetting, and review of the resulting proof before it is published in its final citable form. Please note that during the production process errors may be discovered which could affect the content, and all legal disclaimers that apply to the journal pertain.
References
- 1.Arnoult D, Karbowski M, Youle RJ. Caspase inhibition prevents the mitochondrial release of apoptosis-inducing factor. Cell Death Differ. 2003;10:845–849. doi: 10.1038/sj.cdd.4401240. [DOI] [PubMed] [Google Scholar]
- 2.Brooke S, Chan R, Howard S, Sapolsky R. Endocrine modulation of the neurotoxicity of gp120: implications for AIDS-related dementia complex. Proc Natl Acad Sci U S A. 1997;94:9457–9462. doi: 10.1073/pnas.94.17.9457. [DOI] [PMC free article] [PubMed] [Google Scholar]
- 3.Bump NJ, Hackett M, Hugunin M, Seshagiri S, Brady K, Chen P, Ferenz C, Franklin S, Ghayur T, Li P, et al. Inhibition of ICE family proteases by baculovirus antiapoptotic protein p35. Science. 1995;269:1885–1888. doi: 10.1126/science.7569933. [DOI] [PubMed] [Google Scholar]
- 4.Cande C, Cecconi F, Dessen P, Kroemer G. Apoptosis-inducing factor (AIF): key to the conserved caspase-independent pathways of cell death? J Cell Sci. 2002;115:4727–4734. doi: 10.1242/jcs.00210. [DOI] [PubMed] [Google Scholar]
- 5.Choi DW. Ischemia-induced neuronal apoptosis. Curr Opin Neurobiol. 1996;6:667–672. doi: 10.1016/s0959-4388(96)80101-2. [DOI] [PubMed] [Google Scholar]
- 6.Cregan SP, Fortin A, MacLaurin JG, Callaghan SM, Cecconi F, Yu SW, Dawson TM, Dawson VL, Park DS, Kroemer G, Slack RS. Apoptosis-inducing factor is involved in the regulation of caspase-independent neuronal cell death. J Cell Biol. 2002;158:507–517. doi: 10.1083/jcb.200202130. [DOI] [PMC free article] [PubMed] [Google Scholar]
- 7.Danen-van Oorschot AA, van Der Eb AJ, Noteborn MH. The chicken anemia virus-derived protein apoptin requires activation of caspases for induction of apoptosis in human tumor cells. J Virol. 2000;74:7072–7078. doi: 10.1128/jvi.74.15.7072-7078.2000. [DOI] [PMC free article] [PubMed] [Google Scholar]
- 8.Dawson VL, Dawson TM. Deadly conversations: nuclear-mitochondrial cross-talk. J Bioenerg Biomembr. 2004;36:287–294. doi: 10.1023/B:JOBB.0000041755.22613.8d. [DOI] [PubMed] [Google Scholar]
- 9.Ferri KF, Jacotot E, Blanco J, Este JA, Zamzami N, Susin SA, Xie Z, Brothers G, Reed JC, Penninger JM, Kroemer G. Apoptosis control in syncytia induced by the HIV type 1-envelope glycoprotein complex: role of mitochondria and caspases. J Exp Med. 2000;192:1081–1092. doi: 10.1084/jem.192.8.1081. [DOI] [PMC free article] [PubMed] [Google Scholar]
- 10.Ho DY. Amplicon-based herpes simplex virus vectors. Methods Cell Biol. 1994;43(Pt A):191–210. doi: 10.1016/s0091-679x(08)60604-4. [DOI] [PubMed] [Google Scholar]
- 11.Lakhani SA, Masud A, Kuida K, Porter GA, Jr, Booth CJ, Mehal WZ, Inayat I, Flavell RA. Caspases 3 and 7: key mediators of mitochondrial events of apoptosis. Science. 2006;311:847–851. doi: 10.1126/science.1115035. [DOI] [PMC free article] [PubMed] [Google Scholar]
- 12.Lassus P, Opitz-Araya X, Lazebnik Y. Requirement for caspase-2 in stress-induced apoptosis before mitochondrial permeabilization. Science. 2002;297:1352–1354. doi: 10.1126/science.1074721. [DOI] [PubMed] [Google Scholar]
- 13.Lu CX, Fan TJ, Hu GB, Cong RS. Apoptosis-inducing factor and apoptosis. Sheng Wu Hua Xue Yu Sheng Wu Wu Li Xue Bao (Shanghai) 2003;35:881–885. [PubMed] [Google Scholar]
- 14.Orrenius S, McConkey DJ, Bellomo G, Nicotera P. Role of Ca2+ in toxic cell killing. Trends Pharmacol Sci. 1989;10:281–285. doi: 10.1016/0165-6147(89)90029-1. [DOI] [PubMed] [Google Scholar]
- 15.Palumbo GJ, Pickup DJ, Fredrickson TN, McIntyre LJ, Buller RM. Inhibition of an inflammatory response is mediated by a 38-kDa protein of cowpox virus. Virology. 1989;172:262–273. doi: 10.1016/0042-6822(89)90128-1. [DOI] [PubMed] [Google Scholar]
- 16.Pickup DJ, Ink BS, Hu W, Ray CA, Joklik WK. Hemorrhage in lesions caused by cowpox virus is induced by a viral protein that is related to plasma protein inhibitors of serine proteases. Proc Natl Acad Sci U S A. 1986;83:7698–7702. doi: 10.1073/pnas.83.20.7698. [DOI] [PMC free article] [PubMed] [Google Scholar]
- 17.Robertson JD, Enoksson M, Suomela M, Zhivotovsky B, Orrenius S. Caspase-2 acts upstream of mitochondria to promote cytochrome c release during etoposide-induced apoptosis. J Biol Chem. 2002;277:29803–29809. doi: 10.1074/jbc.M204185200. [DOI] [PubMed] [Google Scholar]
- 18.Roy M, Hom J, Sapolsky RM. Neuroprotection with herpes simplex vectors expressing virally derived anti-apoptotic agents. Brain Res. 2001;901:12–22. doi: 10.1016/s0006-8993(01)02034-0. [DOI] [PubMed] [Google Scholar]
- 19.Roy M, Hom JJ, Sapolsky RM. HSV-mediated delivery of virally derived anti-apoptotic genes protects the rat hippocampus from damage following excitotoxicity, but not metabolic disruption. Gene Ther. 2002;9:214–219. doi: 10.1038/sj.gt.3301642. [DOI] [PubMed] [Google Scholar]
- 20.Roy M, Sapolsky RM. The neuroprotective effects of virally-derived caspase inhibitors p35 and crmA following a necrotic insult. Neurobiol Dis. 2003;14:1–9. doi: 10.1016/s0969-9961(03)00083-4. [DOI] [PubMed] [Google Scholar]
- 21.Sah NK, Taneja TK, Pathak N, Begum R, Athar M, Hasnain SE. The baculovirus antiapoptotic p35 gene also functions via an oxidant-dependent pathway. Proc Natl Acad Sci U S A. 1999;96:4838–4843. doi: 10.1073/pnas.96.9.4838. [DOI] [PMC free article] [PubMed] [Google Scholar]
- 22.Sayan BS, Sayan AE, Knight RA, Melino G, Cohen GM. p53 is cleaved by caspases generating fragments localizing to mitochondria. J Biol Chem. 2006;281:13566–13573. doi: 10.1074/jbc.M512467200. [DOI] [PubMed] [Google Scholar]
- 23.Schlaug G, Benfield A, Baird AE, Siewert B, Lovblad KO, Parker RA, Edelman RR, Warach S. The ischemic penumbra: operationally defined by diffusion and perfusion MRI. Neurology. 1999;53:1528–1537. doi: 10.1212/wnl.53.7.1528. [DOI] [PubMed] [Google Scholar]
- 24.Sharp FR, Lu A, Tang Y, Millhorn DE. Multiple molecular penumbras after focal cerebral ischemia. J Cereb Blood Flow Metab. 2000;20:1011–1032. doi: 10.1097/00004647-200007000-00001. [DOI] [PubMed] [Google Scholar]
- 25.Simon HU, Haj-Yehia A, Levi-Schaffer F. Role of reactive oxygen species (ROS) in apoptosis induction. Apoptosis. 2000;5:415–418. doi: 10.1023/a:1009616228304. [DOI] [PubMed] [Google Scholar]
- 26.Susin SA, Lorenzo HK, Zamzami N, Marzo I, Snow BE, Brothers GM, Mangion J, Jacotot E, Costantini P, Loeffler M, Larochette N, Goodlett DR, Aebersold R, Siderovski DP, Penninger JM, Kroemer G. Molecular characterization of mitochondrial apoptosis-inducing factor. Nature. 1999;397:441–446. doi: 10.1038/17135. [DOI] [PubMed] [Google Scholar]
- 27.Wang H, Cheng E, Brooke S, Chang P, Sapolsky R. Over-expression of antioxidant enzymes protects cultured hippocampal and cortical neurons from necrotic insults. J Neurochem. 2003;87:1527–1534. doi: 10.1046/j.1471-4159.2003.02123.x. [DOI] [PubMed] [Google Scholar]
- 28.Zamzami N, El Hamel C, Maisse C, Brenner C, Munoz-Pinedo C, Belzacq AS, Costantini P, Vieira H, Loeffler M, Molle G, Kroemer G. Bid acts on the permeability transition pore complex to induce apoptosis. Oncogene. 2000;19:6342–6350. doi: 10.1038/sj.onc.1204030. [DOI] [PubMed] [Google Scholar]
- 29.Zhao H, Yenari MA, Cheng D, Sapolsky RM, Steinberg GK. Bcl-2 overexpression protects against neuron loss within the ischemic margin following experimental stroke and inhibits cytochrome c translocation and caspase-3 activity. J Neurochem. 2003;85:1026–1036. doi: 10.1046/j.1471-4159.2003.01756.x. [DOI] [PubMed] [Google Scholar]
- 30.Zhou Q, Krebs JF, Snipas SJ, Price A, Alnemri ES, Tomaselli KJ, Salvesen GS. Interaction of the baculovirus anti-apoptotic protein p35 with caspases. Specificity, kinetics, and characterization of the caspase/p35 complex. Biochemistry. 1998;37:10757–10765. doi: 10.1021/bi980893w. [DOI] [PubMed] [Google Scholar]


