

Abstract
Objective
Orthopedic injury and intracranial hemorrhage are commonly encountered in emergency radiology, and accurate and timely diagnosis is important. The purpose of this study was to determine whether the diagnostic accuracy of handheld computing devices is comparable to that of monitors that might be used in emergency teleconsultation.
Materials and Methods
Two handheld devices, a Dell Axim personal digital assistant (PDA) and an Apple iPod Touch device, were studied. The diagnostic efficacy of each device was tested against that of secondary-class monitors (primary class being clinical workstation display) for each of two image types—posteroanterior wrist radiographs and slices from CT of the brain—yielding four separate observer performance studies. Participants read a bank of 30 wrist or brain images searching for a specific abnormality (distal radial fracture, fresh intracranial bleed) and rated their confidence in their decisions. A total of 168 readings by examining radiologists of the American Board of Radiology were gathered, and the results were subjected to receiver operating characteristics analysis.
Results
In the PDA - CT brain study, the scores from PDA readings were significantly higher than those from the monitor readings for all observers (p≤0.01) and for radiologists who were not neuroradiology specialists (p≤0.05). No statistically significant differences were noted for the wrist images or in the iPod Touch studies, although some comparisons approached significance.
Conclusion
Handheld devices show promise in the field of emergency teleconsultation for detection of basic orthopaedic injuries and intracranial haemorrhage, although further investigation is warranted.
INTRODUCTION
Hand-held devices such as smartphones, MP3 players and personal digital assistants (PDAs) are increasingly prevalent in modern society. The usefulness of these hand-held devices in the medical setting is evident, with 46% of attendings and trainees (1) and 45% of radiologists using a PDA (2). Internet and e-mail access, provision of database and spreadsheet software, word processing facilities, storage of medical textbooks, collation of research data and scheduling of daily activities all contribute to the value of this device to the modern-day clinician (1,2).
Whilst the ability of hand-held devices to offer significant benefit to the daily routine of any modern-day clinician refs (3-5) is not under debate, their ability to accurately display medical images is currently disputed and has not been extensively researched. Although text and low-resolution graphics are easily displayed with current hand-held technologies, it is unclear whether they can provide sufficient image quality to allow primary diagnoses or secondary consultation. Small screen size, low inherent display resolution, low contrast ratio, poor connectivity, slow data transfer rates, security issues and minimal inherent memory provision have been cited as limitations for display of radiological images on a PDA and concern has been expressed over radiologist acceptance (3). Nonetheless, technological developments are being introduced to improve their clinical potential: latest software allows DICOM and JPEG images to be retrieved (6,7); efficient wireless transmission protocols eases the transmission and retrieval of medical data on display devices, using Bluetooth (8) for local transmission or high-bandwidth networks such as code division multiple access (CDMA) for longer distances (9); latest hardware has improved spatial and contrast resolution, processing speeds and memory size (10). Several authors have outlined the potential usefulness of handheld devices for emergency computerised tomography (CT) images (11-13), renal colic (14) intracranial haemorrhages (15), appendicular skeletal trauma (Chew NS et al., presented at the 2008 annual meeting of the Radiological Society of North America) and dental images (16). However these studies have rarely been supported with diagnostic assessments using large groups of expert radiologists.
In this work investigating the clinical efficacy of handheld devices for radiological image display, two different display varieties were tested. The first of these was a Dell Axim PDA and the other an Apple iPod Touch. Dell is an established provider of hand-held technologies. The iPod Touch and iPhone are two of the newest hand held technologies and were launched by Apple (Cupertino, California) in September 2007. These Apple devices provide very similar functions, the greatest difference being that the iPhone has cellular telephone capabilities. They feature identical displays and so conclusions about the display of medical images on the iPod Touch should equally apply to the iPhone. Interestingly, despite the paucity of research into its clinical value, two sessions at the recent annual meeting of the Radiological Society of North America were dedicated to medical imaging and the iPhone entitled “Teleradiology on iPhone: a Survey of Imaging Viewers. Radiological Society of North America web site” and “The Mobile Radiologist: Using iPhone to Connect, Collaborate, and Work” (annual meeting of the Radiological Society of North America, 2008). As handheld technologies evolve and they are increasingly adopted into the clinical arena, it is important that clinicians are aware of their capabilities and limitations and manufacturers are informed of the potential need for further development. Therefore, this study sought to determine whether handheld computing devices could provide diagnostic accuracy comparable to that of secondary display monitors which might be used in the emergency teleconsultation setting for some common radiological tasks.
MATERIALS AND METHODS
Overview
The goal of this work was to establish whether two hand-held devices, a Dell Axim PDA and an iPod Touch, could offer diagnostic efficacy comparable with secondary class liquid crystal display (LCD) monitors. These monitors were investigated as they represent the type of display which might be available remote from a primary clinical site and so might be used in similar clinical circumstances as a hand-held viewer. The experimental studies were carried out at the American Board of Radiology examinations in Louisville, Kentucky where examining clinicians volunteered their time to the studies. Each of the two devices was tested for both digitised plain film wrist images and CT brain images. For each image type, 30 images, of which 15 displayed a specific abnormality (fresh intracranial bleed and distal radial fracture in the CT brain and wrist studies respectively) and 15 did not, were presented to each observer. Observers searched the images for these lesions and rated each image using a 6 point scale, with a higher score representing a greater confidence that a lesion was present. Receiver operating characteristic (ROC) analysis was used to test for statistical differences. Institutional approval was provided for the use of all images.
Equipment
PDAs
Two Dell PDAs, a Dell Axim 50v and Dell Axim x51V with equal display specifications and outward appearance, were used in the study. Maximum, minimum, and 50% grey level luminances were measured and values for the two PDAs were within 10% of each other. Specifications are shown in Table 1. ClearVue software supplied with the PDAs was used to view the images, however zooming, panning and windowing were not possible.
Table 1.
Comparison of PDA, iPod Touch and monitor display specifications
| PDA | iPod Touch | Monitor | |
|---|---|---|---|
| Maximum Luminance* | 100 cdm-2 | 420 cdm-2 | 300 cdm-2 |
| Minimum Luminance* | 4 cdm-2 | 2 cdm-2 | 1 cdm-2 |
| Contrast Ratio* | 25:1 | 210:1 | 300:1 |
| Display Resolution | 480 × 640 pixels | 480 × 320 pixels | 1024 × 1280 pixels |
| Screen Type | Transflective TFT with LED Backlight | LCD | LCD |
| Interaction Method | Stylus | Touch | Mouse |
| Screen Size | 3.7” | 3.5” | 18.1” |
At settings used in this study
iPod Touch
Two identical Apple iPod Touch hand-held display devices were used (Cupertino, Ca). Maximum and minimum luminances for both iPod Touches were within 5% of each other and all specifications are shown in Table 1. Images were viewed on the iPod Touch using the Apple Photo Album software and whilst zooming and panning were allowed it was not possible to window the images.
There was no provision to calibrate the handheld devices to the Digital Imaging and Communication in Medicine Greyscale Standard Display Function (DICOM GSDF) (17), however as shown above these were shown to be working in a standardised and consistent way, adhering to the specifications shown in Table 1.
Monitors
The hand-held devices in each study were compared to 1024 × 1280 standard LCD monitors (VG810B, Viewsonic, Walnut, CA) which complied with the AAPM TG18 recommendations for secondary reporting monitors (18) and provided spatial and contrast specifications that exceeded the brain and wrist native image spatial resolution. These were calibrated to the DICOM GSDF (17) using Verilum software and luminance pod (IMAGE Smiths Inc., Germantown, MD) and a calibrated photometer (Model No. 07-621, Nuclear Associates, Hicksville, NY). The specifications are summarised in Table 1.
Images
A bank of axial CT scans of the brain was collected and thirty single slices were selected for the study. Single slices were utilised due to the absence of appropriate viewing software for the PDA to facilitate comfortable scrolling through the images. Of the 30 slices chosen, 15 showed evidence of a fresh intracranial haemorrhage and the rest did not. For each slice the original matrix size was cropped to 640 × 480 pixels to allow cranial anatomy to be displayed at full resolution on the PDA. For each slice the original matrix size was cropped to 640 × 480 pixels to allow cranial anatomy to be displayed at full resolution on the PDA. The resolution of the iPod Touch did not allow the images to be displayed in their entirety at any one time, however zooming and panning were permitted and so the images could be viewed at full resolution.
For the wrist image assessments, an existing bank of 30 postero-anterior images, of which 15 demonstrated distal radial fractures and 15 were normal, were digitised using a charged coupled device monochrome camera (Hitachi Denshi; Jugesheim) with a 18-108/2.5 zoom lens (Sony; NY). The camera was connected to a Sprynt imaging framestore (Synoptics; Cambridge, UK) operating within the program, PC-Image 2.1 running on a Pentium 4 processor (Intel, Swindon, UK). Each image was digitised at 16 bits per pixel and was cropped to include only the relevant anatomy. This resulted in images having varying spatial resolutions, so to standardise resolution, all wrist images were placed on a black background of 480 × 640 pixels -equal to the display resolution of the PDAs. This ensured that they would display at full resolution and without magnification on the PDAs. As with the CT brain images, zooming and panning were allowed with the iPod Touch thus permitting the images to be viewed at full resolution. Ground truth gold standard for the images were established by specialists in CT (n=3) and musculo-skeletal (n=2) imaging (none of whom participated in the study proper) using the original modality images, radiological reports and other clinical data not available to the assessors of the images.
The CT and wrist images were provided with permission by two hospital sites. For both sets of images, approximately one third of abnormal images contained subtle lesions, a third contained obvious lesions, and the rest were intermediate in difficulty level. Truth was established by radiological report and opinion of an expert lecturer.
Software
Images displayed on the monitor were viewed using custom designed viewing software, Lesionnaire (John Ryan, University College Dublin; http://www.ucd.ie/diagnosticimaging/html/johnryan) which allowed the radiologist to rate the images using a confidence scale of 1-6, where 1 indicates certainty that the image contains no abnormality and 6 indicates certainty that an abnormality is present (Figure 1). The trapezoidal area under the ROC curve (AUC), number of true positives, true negatives, false positives and false negatives for each observer are calculated and displayed immediately after the observer completes his or her readings. Output files containing the observer’s responses and timing data are also automatically generated, including a file compatible with ROCKIT analysis software (Charles Metz, University of Chicago; http://xray.bsd.uchicago.edu/krl/index.htm).
Fig 1.
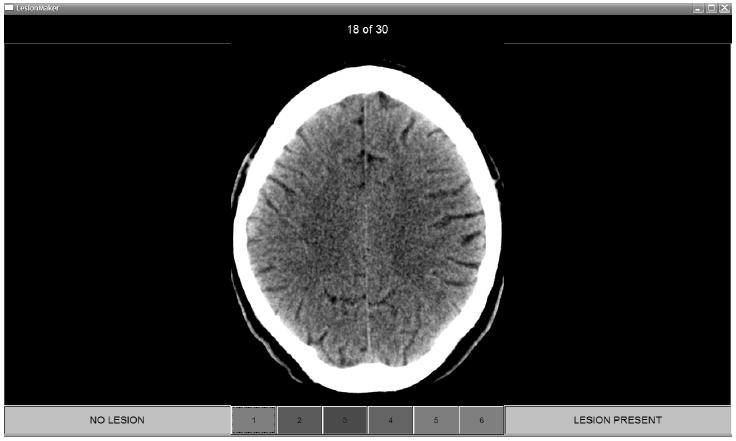
CT brain image and decision confidence scale displayed in Lesionnaire viewing software
As it is not presently possible to run Lesionnaire on a PDA or an iPod Touch, observers could not record their responses on this device, therefore the hand-held images were interpreted on the hand-held device but observers recorded their rating on a “map” displayed on a monitor (Figure 2). Since using the full quality image as the map on the monitor would defeat the purpose of evaluating hand-held image quality, these map images had reduced contrast so that the minimum to maximum luminance ratio was no greater than 10% of the original, and 50% noise added so that only gross anatomic structure was discernable and details of abnormalities were obscured. Both the full quality images used for the monitor observations and the maps were displayed at full spatial resolution and without magnification and windowing, zooming and panning were not permitted.
Fig 2.
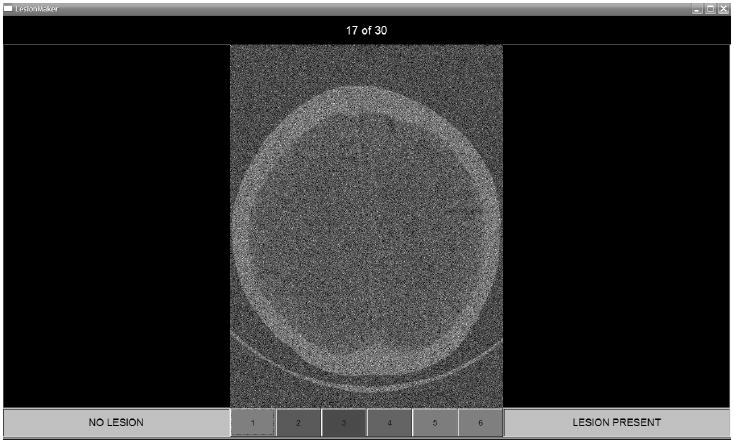
CT brain image with added noise and reduced contrast as displayed on the monitor for PDA-based readings. The image was used only to record observers’ ratings and locations marked as suspicious
Observers
Because the number of images was relatively low, due to time constraints, the number of participating radiologists was maximised. In total 49 observers participated in the PDA study and 35 in the iPod Touch study. All were examining radiologists with the American Board of Radiology (ABR) and although all participating radiologists were experts in their own field, the term “non-specialist” is used here to describe a radiologist examining an image not related to their own speciality, for example, a GI specialist examining a wrist image. The breakdown of observers for each image type may be seen in Table 2. Mean post ABR-certification experience across all radiologists was over 20 years.
Table 2.
Observer distribution. Specialists for the brain and wrist images were neuroradiologists and musculo-skeletal (MSK) radiologists respectively
| PDA Study | iPod Touch Study | |||
|---|---|---|---|---|
| CT Brain | Wrist | CT Brain | Wrist | |
| Specialists | 15 | 12 | 11 | 12 |
| Non-specialists | 8 | 14 | 4 | 8 |
| Total | 23 | 26 | 15 | 20 |
A tutorial on how to use the handheld devices was provided to observers. Support was available at all times if observers were unsure or had difficulty using either hardware or software. The abnormalities to be considered were specified (brain: fresh intracranial haemorrhage; wrist: distal fracture of radius) prior to the commencement of each reading. No time restriction was imposed; however, observers were prompted in a pop-up after 30 seconds to make their decision. A standard counterbalanced method was employed in order to minimise memory effects (19) and ambient lighting was constant throughout the studies at 40 lux, in line with a previous publication (20).
Statistical Analysis
Overall observer performance for each modality, observer and image type was assessed using conventional ROC statistical methods. The Dorfman-Berbaum-Metz (DBM) method of ROC analysis was employed and the trapezoidal area under the curve (AUC) was utilised (21-27). DBM analyses were carried out in two conditions -treating both readers and cases as random, and treating readers as random and cases as fixed. Results were considered statistically significant at p≤0.05. DBM software is available from the websites of the Medical Image Perception Laboratory, Department of Radiology, University of Iowa (http://perception.radiology.uiowa.edu) and the Kurt Rossmann Laboratories for Radiologic Image Research, University of Chicago (http://xray.bsd.uchicago.edu/krl/).
RESULTS
PDA Study
The DBM analyses showed some groups performing significantly better with the PDA than with the monitor (Table 3) in the CT Brain reading task. The entire group of observers who assessed the CT Brain images demonstrated improved performance with both readers and cases treated as random and with cases fixed, while nonspecialist group showed significantly higher AUCs only when cases were treated as fixed. The neuroradiologists did not achieve statistically significantly higher results with the PDAs, although the p values for both DBM comparisons approached significance.
Table 3.
DBM analysis of the data from the PDA studies
| Observer Group | Mean AUC PDA | Mean AUC Monitor | Mean AUC PDA – Monitor | F-statistic | p value |
|---|---|---|---|---|---|
| CT All | 0.894 | 0.855 | 0.039 | ||
| Readers & Cases Random | (0.818, 0.970) | (0.769, 0.941) | (0.007, 0.072) | 5.87 | 0.019 * |
| Readers Random, Cases Fixed | (0.865, 0.923) | (0.817, 0.894) | (0.012, 0.067) | 8.76 | 0.007 * |
| CT Brain Specialists | 0.908 | 0.871 | 0.037 | ||
| Readers & Cases Random | (0.840, 0.976) | (0.783, 0.958) | (-0.002, 0.077) | 4.15 | 0.061 |
| Readers Random, Cases Fixed | (0.878, 0.937) | (0.819, 0.922) | (-0.002, 0.077) | 4.15 | 0.061 |
| CT Brain Non-specialists | 0.869 | 0.826 | 0.043 | ||
| Readers & Cases Random | (0.758, 0.979) | (0.720, 0.932) | (-0.011, 0.096) | 2.61 | 0.116 |
| Readers Random, Cases Fixed | (0.796, 0.941) | (0.761, 0.891) | (0.000, 0.085) | 5.71 | 0.048 * |
| Wrist All | 0.954 | 0.942 | 0.012 | ||
| Readers & Cases Random | (0.920, 0.989) | (0.907, 0.977) | (-0.013, 0.038) | 0.96 | 0.33 |
| Readers Random Cases Fixed, | (0.932, 0.976) | (0.919, 0.965) | (-0.007, 0.031) | 1.81 | 0.19 |
| Wrist Specialists | 0.978 | 0.975 | 0.003 | ||
| Readers & Cases Random | (0.955, 1.000) | (0.958, 0.991) | (-0.022, 0.028) | 0.06 | 0.808 |
| Readers Random, Cases Fixed, | (0.961, 0.994) | (0.960, 0.990) | (-0.020, 0.026) | 0.08 | 0.782 |
| Wrist Non-specialists | 0.934 | 0.914 | 0.020 | ||
| Readers & Cases Random | (0.877, 0.991) | (0.862, 0.965) | (-0.017, 0.058) | 1.22 | 0.278 |
| Readers Random, Cases Fixed | (0.896, 0.972) | (0.877, 0.951) | (-0.011, 0.052) | 1.97 | 0.184 |
Note: Figures are correct to three decimal places. Statistically significant results are marked with an asterisk. Data in parentheses are 95% confidence intervals
There were no significant differences for the comparisons of the wrist images.
iPod Touch Study
The ROC analyses for the iPod Touch comparison with the secondary display did not demonstrate any significant inter-modality differences for either the CT or wrist image data. Results from this analysis are shown in Table 4 and mean figure of merit values and p-values are indicated.
Table 4.
DBM analysis of the data from the iPod Touch studies
| Observer Group | Mean AUC iPod Touch | Mean AUC Monitor | Mean AUC PDA - Monitor | F-statistic | p value |
|---|---|---|---|---|---|
| CT All | 0.873 | 0.872 | 0.002 | ||
| Readers & Cases Random | (0.792, 0.955) | (0.792, 0.952) | (-0.023, 0.026) | 0.03 | 0.869 |
| Readers Random, Cases Fixed | (0.837, 0.910) | (0.844, 0.899) | (-0.023, 0.026) | 0.03 | 0.868 |
| CT Brain Specialists | 0.872 | 0.874 | -0.002 | ||
| Readers & Cases Random | (0.781, 0.963) | (0.786, 0.961) | (-0.035, 0.032) | 0.01 | 0.916 |
| Readers Random, Cases Fixed | (0.820, 0.923) | (0.836, 0.911) | (-0.035, 0.032) | 0.01 | 0.916 |
| CT Brain Non-specialists | 0.878 | 0.866 | 0.012 | ||
| Readers & Cases Random | (0.812, 0.944) | (0.774, 0.958) | (-0.031, 0.054) | 0.35 | 0.563 |
| Readers Random, Cases Fixed | (0.840, 0.916) | (0.821, 0.911) | (-0.032, 0.056) | 0.71 | 0.46 |
| Wrist All | 0.948 | 0.924 | 0.023 | ||
| Readers & Cases Random | (0.919, 0.976) | (0.873, 0.976) | (-0.008, 0.055) | 2.19 | 0.145 |
| Readers Random, Cases Fixed | (0.923, 0.972) | (0.886, 0.963) | (-0.003, 0.050) | 3.52 | 0.076 |
| Wrist Specialists | 0.939 | 0.917 | 0.023 | ||
| Readers & Cases Random | (0.899, 0.980) | (0.845, 0.989) | (-0.021, 0.066) | 1.30 | 0.279 |
| Readers Random, Cases Fixed | (0.902, 0.977) | (0.852, 0.982) | (-0.021, 0.066) | 1.30 | 0.279 |
| Wrist Non-specialists | 0.96 | 0.936 | 0.024 | ||
| Readers & Cases Random | (0.926, 0.994) | (0.889, 0.982) | (-0.014, 0.063) | 1.67 | 0.203 |
| Readers Random, Cases Fixed | (0.927, 0.993) | (0.905, 0.967) | (-0.003, 0.052) | 4.43 | 0.073 |
Note: Figures are given correct to three decimal places. Data in parentheses are 95% confidence intervals
DISCUSSION
This study explores the value of two different hand-held devices for reporting two relatively common emergency situations - fresh intracranial bleed and fractured distal radius. If hand-held devices can be demonstrated to be an efficient reporting tool, the value to both the clinician of not having to be on a specific site to provide an opinion and to the patient where the immediacy of reports is enhanced is clear. The results of these studies indicate that both the PDA and the iPod Touch may indeed be adequate for the display of some radiological images, equalling the performance of secondary class LCD monitors for two image types and even surpassing them for certain observer and image types in some analyses.
The ROC results did not demonstrate statistically significant differences between the iPod Touch and the secondary display monitor for either image type. Some statistically significant differences were found between the PDAs and monitors for the brain images. Both the group as a whole and the non-specialist observers demonstrated significantly better performance on the PDAs than the monitors for the CT brain images when cases were treated as fixed, and this result holds for the entire observer group with cases treated as random.
The performance of the hand-held devices was similar to that of the monitor to within the 95% CIs shown in Tables 1 and 2. The comparable performance of the PDAs, despite the substantially lower display specifications for maximum luminance and contrast ratio than the monitors, raises questions about which physical properties of images are most influential in radiological perception and interpretation. The relationship between physical descriptors and clinical image diagnoses has been debated in the past and is summarised by Tapiovaara in STUK–A219 (30), with available evidence for (29, 30) and against (31, 32) strong correlations between physical and clinical data. The current results demonstrate the importance of including clinical image assessment when evaluating new technologies, so that visibility of pathologically important details against a typically heterogeneous background can be fully assessed along with the impact on observer perception and response.
The image area on the handheld devices (for non-zoomed images), due to physical screen dimensions, was smaller than the monitor. Whilst might initially be thought to limit the functionality of portable devices, this feature may actually offer some explanation for the hand-held devices’ performance in this work. Previous workers (33) have considered the issue of physical image size and performance with radiological images (34) and showed that a majority of radiologists achieved higher AUC values for smaller, compared with larger, images and suggested that this may be due to a greater portion of the image being represented over the high-resolution foveal and para-foveal vision at a single time. Seltzer et al. (35) suggest that limitations do apply to small, densely packed images (such as very large numbers of CT slices printed on film sheets), but that allowing magnification and variable viewing distance can compensate for these to a great extent. It is difficult to say whether a greater fovea-image ratio or the ability to vary viewing distance explains the findings of this study entirely, but further investigation of the impact of image display size on lesion detection is warranted.
Overall, the results of this study suggest that hand-held devices show promise as tools in radiological reporting. However we must be clear as to the limitation and restrictions of the current work. A study with more cases is desirable to decrease the width of the CIs and allow more definitive conclusions, but due to practical constraints this was not possible in this study. This work only considered secondary displays and no conclusions can be made about the performance of hand-held devices compared with primary workstations. Also, common post-processing tools such as windowing and zooming are not currently built into the Lesionnaire software and whilst this limitation of the software is currently being addressed, for the present work image manipulation was unavailable to the observer except for zoom and pan functions on the iPod Touch. This may have limited the performance of the secondary displays in particular as viewing and windowing facilities would commonly be available where a standard computer and monitor are used. In addition, for the CT images, only a single slice was demonstrated for each image assessment, so important image data that would normally be present on adjacent sections were not accessible. Nevertheless, this study has demonstrated that important clinical information about a patient condition can be made available to clinicians by displaying radiological images on hand-held devices and this finding extends their potential beyond current applications such as teaching residents (4,5) and organising clinical commitments (3).
In summary, the results suggest that the hand-held devices investigated in this study may yield results comparable to secondary class monitors for reporting of fresh intracranial bleeds on CT images or fractured wrists on radiographs and so may be of value within radiology, particularly for teleconsultation and emergency procedures. However, further research is required and a precautionary approach is advised at this stage. The importance of both physical and clinical evaluation of new technologies or radiological procedures is highlighted.
Acknowledgments
The authors’ sincerest thanks are due to the American Board of Radiology for their kind assistance and for facilitating the study.
D. P. Chakraborty was supported in part by NIH grants R01 EB005243 and R01 EB006388. R. J. Toomey receives funding from the Irish Research Council for Science, Engineering and Technology funded by the National Development Plan.
References
- 1.McLeod TG, Ebbert JO, Lymp JF. Survey assessment of personal digital assistant use among trainees and attending physicians. J Am Med Inform Assoc. 2003;10:605–607. doi: 10.1197/jamia.M1313. [DOI] [PMC free article] [PubMed] [Google Scholar]
- 2.Boonn WW, Flanders AE. Informatics in radiology (infoRAD): survey of personal digital assistant use in radiology. RadioGraphics. 2005;25:537–541. doi: 10.1148/rg.252045173. [DOI] [PubMed] [Google Scholar]
- 3.Flanders AE, Wiggins RH, III, Gozum ME. Handheld computers in radiology. RadioGraphics. 2003;23:1035–1047. doi: 10.1148/rg.234035011. [DOI] [PubMed] [Google Scholar]
- 4.Nishino M, Busch JM, Wei J, Barbaras L, Yam CS, Hatabu H. Use of personal digital assistants in diagnostic radiology resident education. Acad Radiol. 2004;11:1153–1158. doi: 10.1016/j.acra.2004.06.006. [DOI] [PubMed] [Google Scholar]
- 5.Yam CS. Projecting PowerPoint presentations with a PDA. AJR. 2005;184:1356–1359. doi: 10.2214/ajr.184.4.01841356. [DOI] [PubMed] [Google Scholar]
- 6.Andrade R, von Wangenheim A, Kessler Bortoluzzi M. Wireless and PDA: a novel strategy to access DICOM-compliant medical data on mobile devices. Int J Med Inform. 2003;71:157–163. doi: 10.1016/s1386-5056(03)00093-5. [DOI] [PubMed] [Google Scholar]
- 7.Nakata N, Kandatsu S, Suzuki N, Fukuda K. Informatics in radiology (infoRAD): mobile wireless DICOM server system and PDA with high resolution display: feasibility of group work for radiologists. RadioGraphics. 2005;25:273–283. doi: 10.1148/rg.251045058. [DOI] [PubMed] [Google Scholar]
- 8.Kim DK, Yoo SK, Park JJ, Kim SH. PDA-phonebased instant transmission of radiological images over a CDMA network by combining the PACS screen with a Bluetooth-interfaced local wireless link. J Digit Imaging. 2007;20:131–139. doi: 10.1007/s10278-007-9002-2. [DOI] [PMC free article] [PubMed] [Google Scholar]
- 9.Kim DK, Yoo SK, Kim SH. Instant wireless transmission of radiological images using a personal digital assistant phone for emergency teleconsultation. J Telemed Telecare. 2005;11(suppl 2):S58–S61. doi: 10.1258/135763305775124786. [DOI] [PubMed] [Google Scholar]
- 10.Raman B, Raman R, Raman L, Beaulieu CF. Radiology on handheld devices: image display, manipulation, and PACS integration issues. RadioGraphics. 2004;24:299–310. doi: 10.1148/rg.241035127. [DOI] [PubMed] [Google Scholar]
- 11.Yamamoto LG, Williams DR. A demonstration of instant pocket wireless CT teleradiology to facilitate stat neurosurgical consultation and future telemedicine implications. Am J Emerg Med. 2000;18:423–426. doi: 10.1053/ajem.2000.6316. [DOI] [PubMed] [Google Scholar]
- 12.Reponen J, Ilkko E, Jyrkinen L, et al. Initial experience with a wireless personal digital assistant as a teleradiology terminal for reporting emergencycomputerized tomography scans. J Telemed Telecare. 2000;6:45–49. doi: 10.1258/1357633001933943. [DOI] [PubMed] [Google Scholar]
- 13.Kondo Y. Medical image transfer for emergency care utilizing internet and mobile phone. Nippon Hoshasen Gijutsu Gakkai Zasshi. 2002;58:1393–1401. doi: 10.6009/jjrt.kj00003111390. [DOI] [PubMed] [Google Scholar]
- 14.Johnston WK, 3rd, Patel BN, Low RK, Das S. Wireless teleradiology for renal colic and renal trauma. J Endourol. 2005;19:32–36. doi: 10.1089/end.2005.19.32. [DOI] [PubMed] [Google Scholar]
- 15.Yaghmai V, Kuppuswami S, Berlin JW, Salehi SA. Evaluation of personal digital assistants as an interpretation medium for computed tomography of patients with intracranial injury. Emerg Radiol. 2003;10:87–89. doi: 10.1007/s10140-003-0300-9. [DOI] [PubMed] [Google Scholar]
- 16.Salo S, Salo H, Liisanantti A, Reponen J. Data transmission in dental identification of mass disaster victims. J Forensic Odontostomatol. 2007;25:17–22. [PubMed] [Google Scholar]
- 17.Digital imaging and communications in medicine (DICOM) Part 14. Grayscale display standard function. NEMA PS 3.14-2007. Rosslyn, VA: National Electrical Manufacturers Association (NEMA); [June 12, 2009]. Website. http://www.nema.org/stds. Published December 2006. [Google Scholar]
- 18.Samei E, Badano A, Chakraborty D, Compton K, Cornelius C, Corrigan K, Flynn MJ, Hemminger B, Hangiandreou N, Johnson J, Moxley M, Pavlicek W, Roehrig H, Rutz L, Shepard J, Uzenoff R, Wang J, Willis C. Medical Physics Publishing. Madison, WI: Apr, 2005. Assessment of Display Performance for Medical Imaging Systems, Report of the American Association of Physicists in Medicine (AAPM) Task Group 18. AAPM On-Line Report No 03. [DOI] [PubMed] [Google Scholar]
- 19.Metz CE. Some practical issues of experimental design and data analysis in radiological ROC studies. Invest Radiol. 1989;24:234–245. doi: 10.1097/00004424-198903000-00012. [DOI] [PubMed] [Google Scholar]
- 20.Brennan PC, McEntee M, Evanoff M, Phillips P, O’Connor WT, Manning DJ. Ambient lighting: effect of illumination on soft-copy viewing of radiographs of the wrist. AJR. 2007;188:520. doi: 10.2214/AJR.05.2048. [web] W177–W180. [DOI] [PubMed] [Google Scholar]
- 21.Dorfman DD, Berbaum KS, Metz CE. Receiver operating characteristic rating analysis: generalization to the population of readers and patients with the jackknife method. Invest Radiol. 1992;27:723–731. [PubMed] [Google Scholar]
- 22.Dorfman DD, Berbaum KS, Lenth RV, Chen YF, Donaghy BA. Monte Carlo validation of a multireader method for receiver operating characteristic discrete rating data: factorial experimental design. Acad Radiol. 1998;5:591–602. doi: 10.1016/s1076-6332(98)80294-8. [DOI] [PubMed] [Google Scholar]
- 23.Hillis SL, Berbaum KS. Power estimation for the Dorfman-Berbaum-Metz method. Acad Radiol. 2004;11:1260–1273. doi: 10.1016/j.acra.2004.08.009. [DOI] [PubMed] [Google Scholar]
- 24.Hillis SL, Obuchowski NA, Schartz KM, Berbaum KS. A comparison of the Dorfman-Berbaum-Metz and Obuchowski-Rockette methods for receiver operating characteristic (ROC) data. Stat Med. 2005;24:1579–1607. doi: 10.1002/sim.2024. [DOI] [PubMed] [Google Scholar]
- 25.Hillis SL. Monte Carlo validation of the Dorfman-Berbaum-Metz method using normalized pseudovalues and less data-based model simplification. Acad Radiol. 2005;12:1534–1541. doi: 10.1016/j.acra.2005.07.012. [DOI] [PMC free article] [PubMed] [Google Scholar]
- 26.Hillis SL. A comparison of denominator degrees of freedom for multiple observer ROC analysis. Stat Med. 2007;26:596–619. doi: 10.1002/sim.2532. [DOI] [PMC free article] [PubMed] [Google Scholar]
- 27.Hillis SL, Berbaum KS, Metz CE. Recent developments in the Dorfman-Berbaum-Metz procedure for multireader ROC study analysis. Acad Radiol. 2008;15:647–661. doi: 10.1016/j.acra.2007.12.015. [DOI] [PMC free article] [PubMed] [Google Scholar]
- 28.Tapiovaara M. STUK A219. Helsinki, Finland: Radiation and Nuclear Safety Authority (STUK); [December 18, 2007]. Relationships between physical measurements and user evaluation of image quality in medical radiology: a review. http://www.stuk.fi/julkaisut/stuk-a/stuk-a219.pdf. Published September 2006. [Google Scholar]
- 29.Sandborg M, Tingberg A, Dance DR, et al. Demonstration of correlations between clinical and physical image quality measures in chest and lumbar spine screen-film radiography. Br J Radiol. 2001;74:520–528. doi: 10.1259/bjr.74.882.740520. [DOI] [PubMed] [Google Scholar]
- 30.Ullman G, Sandborg M, Tingberg A, et al. Linköping, Sweden: Linköping University; [January 29, 2007]. Comparison of clinical and physical measures of image quality in chest PA and pelvis AP views at varying tube voltages. 2004 Report 98. http://huweb.hu.liu.se/inst/imv/radiofysik/pdfs/Rep98.pdf. Published December 2004. [Google Scholar]
- 31.Metz CE, Wagner RF, Doi K, Brown DG, Nishikawa RM, Myers KJ. Toward consensus on quantitative assessment of medical imaging systems. Med Phys. 1995;22:1057–1061. doi: 10.1118/1.597511. [DOI] [PubMed] [Google Scholar]
- 32.Walsh C, Dowling A, Meade A, Malone J. Subjective and objective measures of image quality in digital fluoroscopy. Radiat Prot Dosimetry. 2005;117:34–37. doi: 10.1093/rpd/nci708. [DOI] [PubMed] [Google Scholar]
- 33.Gur D, Klym AH, King JL, et al. The effect of image size on display performance: an assessment of variance components. Acad Radiol. 2006;13:409–413. doi: 10.1016/j.acra.2005.11.033. [DOI] [PubMed] [Google Scholar]
- 34.Straub WH, Gur D, Good WF, et al. Primary CT diagnosis of abdominal masses in a PACS environment. Radiology. 1991;178:739–743. doi: 10.1148/radiology.178.3.1994411. [DOI] [PubMed] [Google Scholar]
- 35.Seltzer SE, Judy PF, Feldman U, Scarf L, Jacobson FL. Influence of CT image size and format on accuracy of lung nodule detection. Radiology. 1998;206:617–622. doi: 10.1148/radiology.206.3.9494475. [DOI] [PubMed] [Google Scholar]