

Abstract
We describe herein a highly proficient class A β-lactamase OIH-1 from the bacterium Oceanobacillus iheyensis, whose habitat is the sediment at a depth of 1050 meters in the Pacific Ocean. The OIH-1 structure was solved by molecular replacement and refined at 1.25 Å resolution. OIH-1 has evolved to be an extremely halotolerant β-lactamase capable of hydrolyzing its substrates in the presence of NaCl at saturating concentration. Not only is this the most highly halotolerant bacterial enzyme structure known to date, it is also the highest resolution halophilic protein structure yet determined. Evolution of OIH-1 in the salinity of the ocean has resulted in a molecular surface that is coated with acidic residues, a marked difference with β-lactamases of terrestrial sources. OIH-1 is the first example of an antibiotic-resistance enzyme that has evolved in the depths of the ocean in isolation from clinical selection and gives us an extraordinary glimpse into protein evolution under extreme conditions. It represents evidence for the existence of a reservoir of antibiotic-resistance enzymes in nature among microbial populations from deep oceanic sources.
Keywords: Antibiotic resistance, halotolerant, β-lactamase
Introduction
Chemical warfare by soil microorganisms is believed to have produced fertile ground for co-evolution of antibiotic-resistance mechanisms for self-protection by the antibiotic producer strains.1 Alternatively, evolution of the resistance determinants by other microorganisms that cohabitate the very same niche has been invoked.2 One such antibiotic resistance factor is the family of β-lactamases, which has emerged as a major mechanism of bacterial resistance to clinically important β-lactam antibiotics. These bacterial enzymes hydrolyze the β-lactam ring of the antibiotics, rendering them inactive.3, 4 Four classes of β-lactamases (A-D) have been identified, of which classes A, C, and D are active-site serine enzymes, while class B includes metallo β-lactamases.5 It is generally believed that β-lactamases might have emerged from a group of cell-wall biosynthetic enzymes referred to as penicillin-binding proteins in response to the production of β-lactam antibiotics by other organisms within the same habitat.4 This event has been proposed to have occurred two billion years ago,6 predating divergence of Gram-negative and Gram-positive bacteria. The clinical use of structurally diverse β-lactams during the past sixty years dramatically accelerated evolution and spread of the genes for these enzymes.7 Class A β-lactamases are the most common and are widely distributed among Gram-positive and Gram-negative bacteria. The genes for these enzymes are disseminated in important clinical pathogens and are discovered with increased frequency in a variety of environmental microorganisms. Despite significant progress in the studies of β-lactamases, our knowledge of the diversity of these enzymes is based on the analysis of genes of merely 1% of existing microorganisms, as the remaining 99% are currently non-culturable.8 Recent studies of DNA from soil samples, including those from an isolated site in Alaska, demonstrated that soil is a reservoir for various yet uncharacterized antibiotic-resistance determinants.9-11 New class B and class C β-lactamases have recently been identified in microorganisms isolated from remote Antarctic coastal areas.12, 13
The availability of increasing numbers of genome sequences of various environmental and clinical microorganisms provides yet another source for identification and study of antibiotic-resistance genes. In a search for novel β-lactamases in the microorganisms whose genome sequences are reported at the Genome Project site of the National Center for Biotechnology Information (http://www.ncbi.nlm.nih.gov/sites/entrez?db=genomeprj), the amino acid sequence of a putative β-lactamase from the Gram-positive bacterium Oceanobacillus iheyensis was identified. This bacillus, isolated from the bottom of the Pacific Ocean at a depth of 1050 meters, is alkaliphilic and halotolerant, in that it can grow in up to 21% (5.6 M) NaCl, and was classified as a species in a previously unknown genus. The selected open reading frame encodes a protein that has up to 55% amino acid identity with class A β-lactamases from various Bacillus species. It also contains fingerprint sequence motifs conserved among class A β-lactamases, including SxxK (which includes the catalytic serine), SDN, and ExxxN. In an effort to determine whether this open reading frame encodes for a functional class A β-lactamase, we have cloned the gene, and expressed and purified the encoded enzyme. Herein we present the detailed description of kinetics and high resolution crystal structure of this first antibiotic resistance enzyme from deep sea microorganism.
Methods
Construction of the pHF016 vector
The vector pHF016 was constructed by combining three DNA fragments containing the origin of replication of the pET24a(+) vector (Novagen), the gene for aminoglycoside phosphotransferase to provide a kanamycin selection marker, and the D-amino acid aminotransferase promoter, respectively. The pET24a(+) origin of replication was PCR-amplified from the pET24a(+) plasmid using the primers oHF014: 5′-GCGGATATCCCCGTAGAAAAGATCAAAGG -3′ and pHF016: 5′-GTATCTGCAGAGCGCTGGCATTGACCCTG -3′ (the EcoRV and PstI recognition sequences are underlined). The fragment containing the kanamycin selection marker was PCR-amplified from the plasmid pET24a(+) using the primers oHF017: 5′-GTTTCTGCAGTCAGGTGGCACTTTTCG -3′ and oHF018: 5′- GGGAGATATCTCATGAACAATAAAACTGTC -3′ (the EcoRV and PstI recognition sequences are underlined). Amplification products were digested with EcoRV and PstI, ligated, and introduced by transformation into competent E. coli strain DH10B cells (Gibco BRL). The nucleotide sequence of the resulting construct was verified and its unique EcoRV site was used for cloning of the third fragment. This third fragment encoding the D-amino acid aminotransferase gene promoter, a multiple cloning site (MCS), and the termination signal from the T2 element of the E. coli rrnB gene, was custom synthesized (Celtek Genes). Two sites for the EcoRV endonuclease were also introduced at the 5′- and 3′- ends of this fragment. The sequence of the entire vector was verified by DNA sequencing. The MCS of the pHF016 plasmid contain a unique NdeI site that can be used to place any gene of interest under the strong constitutive promoter of the D-amino acid aminotransferase gene.
Various OIH-1 constructs
We first optimized the gene sequence for the OIH-1 β-lactamase for expression in E. coli and custom synthesized it in such way that the OIH-1 β-lactamase (including its own predicted leader sequence) was fused to the leader of the TEM-1 β-lactamase at the N-terminus and had a hexahistidine tag at the C-terminus. Recognition sequences for the NdeI and HindIII endonucleases were introduced immediately 5′ of the sequence for the TEM-1 leader and 3′ of the stop codon for the OIH-1 β-lactamase gene. The resulting construct was custom-synthesized and cloned into the NdeI and HindIII sites of the pHF016 and pET24a(+) vectors. To get a construct expressing OIH-1 only under its own predicted leader we PCR-amplified this truncated fragment (without the TEM-1 leader) from the synthetic construct using the primers OceanNde: 5′- ATACATATGATTAGAATCCTCAAACGCAGC -3′ and TEMHisHind: 5′- TATAAGCTTAGTGGTGGTGGTGGTGGTGG -3′ (the NdeI and HindIII recognition sequences are underlined). This fragment was cloned into the NdeI-HindIII site of the pHF016 and pET24a(+) vectors. To obtain the construct encoding OIH-1 without its predicted leader sequence we utilized two primers, OCE2NdeIdir: 5′- TTCTCATATGAAGGAAGGTATACCAGAGGAAAATAACGGC -3′ (the NdeI recognition sequence is underlined) and TEMHisHind (vide supra) to amplify the oih-1 gene. The PCR product was separated from a vector template by electrophoresis on a 1% agarose gel, purified from agarose, digested with the NdeI and HindIII endonucleases and cloned into the corresponding sites of the pHF016 vector. To fuse the sequence of the mature (without own leader) OIH-1 β-lactamase with the leader of either the TEM-1 β-lactamase or the leader of the outer membrane protein OmpA, the oih-1 gene was amplified utilizing a pair of primers, OCE2Dir: 5′- AAGGAAGGTATACCAGAGG -3′ and TEMHisHind (vide supra). Amplified and purified PCR product was blunt-end ligated to the PCR-amplified DNA fragments encoding the TEM-1 or the OmpA leader peptides and containing the Nde-I recognition sequences at the 5′ end. The resulting products were digested with the NdeI and HindIII endonucleases and cloned into the corresponding sites of the pHF016 vector. The nucleotide sequence of all constructs was verified by DNA sequencing.
Enzyme kinetics
The hydrolysis of the β-lactam bond was monitored at the following wavelength and change in extinction coefficient (Δε, M-1cm-1) with each substrate: penicillin G (240 nm/500), penicillin V (240 nm/460), ampicillin (240 nm/500), carbenicillin (240 nm/400), ticarcillin (235 nm/660), oxacillin (260 nm/450), cloxacillin (260 nm/180), methicillin (305 nm/41), cephalothin (262 nm/7960), cefotaxime (265 nm/6260), ceftazidime (260 nm/8660), imipenem (297 nm/9210), aztreonam (318 nm/640), and sulbactam (236 nm/1780). Activity of the OIH-1 β-lactamase against β-lactam substrates and the inhibition profiles with clavulanate, tazobactam, and sulbactam were determined spectrophotometrically with a Cary 50 spectrophotometer (Varian) in 100 mM phosphate buffer, pH 7.0 at 22 °C. Calculations of steady-state kinetic parameters for each substrate were performed with GraFit 4.0 and Microsoft Excel software. The values for kcat, Km, and kcat/Km were determined by fitting the data with equation 1:
| (eq.1) |
where v is the initial velocity, S is substrate concentration, and E is enzyme concentration.
Minimal inhibitory concentrations of antibiotics (MICs) against bacterial strains were performed by the microdilution method in Muller-Hinton II broth (MHB). Two-fold dilutions of antibiotics were performed in 96-well microtiter plates prefilled with 100 μl of MHB. Bacterial cultures were added to antibiotic-containing MHB to result in a final inoculum of 5 × 10⁵ colony forming units per milliliter. Plates were incubated at 37 °C for 24 hours before results were recorded.
The inhibition parameters were determined by monitoring the hydrolysis of ampicillin under conditions of excess substrate concentrations. The dissociation constants (Ki) for clavulanate, tazobactam, and sulbactam were calculated by the Dixon method.14 Two concentrations of ampicillin (100 and 200 μM) were used and a series of assay mixtures containing both the substrate and inhibitor at various concentrations (2.5-12.5 μM for clavulanate, 5-20 μM for tazobactam, and 10-150 μM for sulbactam) were prepared in 100 mM sodium phosphate buffer, pH 7.0. The reaction was started by the addition of the OIH-1 enzyme (10 nM final concentration) followed by the immediate measurement of enzyme activity. Rates were measured for the first 10% of substrate turnover.
The inactivation rate constant (kinact) for clavulanate and tazobactam with OIH-1 were calculated from reaction progress curves in the presence of varying concentrations of inhibitor and excess ampicillin substrate. The value of the pseudo first-order rate constant (kobs) was determined by fitting the reaction progress curve with equation 2:
| (eq.2) |
where A is the absorbance at 240 nm, A0 is the absorbance at t = 0, vi is the initial velocity, and t is time. A plot of kobs as a function of [I] was hyperbolic and equation 3 was used to calculate the inactivation rate constant:
| (eq.3) |
where kinact defines the maximum rate of inactivation at infinite concentration of inhibitor, [I] is the inhibitor concentration, and KI defines the inhibitor concentration where the rate of inactivation is ½ kinact.
The partition ratios (kcat/kinact) for clavulanate, tazobactam, and sulbactam were determined by the titration method.15 Reaction mixtures containing various molar ratios ([I]/[E]) of inhibitor (I) and enzyme (E) in 100 mM phosphate buffer, pH 7.0 were incubated at 4 °C overnight. Molar ratios varied from 1-10, 5-50, and 10-200 for clavulanate, tazobactam, and sulbactam, respectively. The remaining enzyme activity was assayed under conditions of excess ampicillin (1 mM) and the fractional activity plotted as a function of the molar ratio of [I]/[E].
Purification, crystallization, data collection, and structure refinement
OIH-1 was purified and crystallized as previously described.16 Briefly, following elution from the HiTrap Chelating Affinity column, and prior to crystallization trials, the enzyme was dialyzed into 25 mM HEPES, pH 7.5, at a concentration of 300 μM and aliquots stored at -80 °C. Two crystal forms, both in space group P3121 but with different unit cell parameters, were produced; Form 1 grown from 0.1M sodium acetate, pH 4.6, 2.0 M ammonium sulfate, and Form 2 from 0.2 M calcium chloride, 0.1 M HEPES, pH 7.5, 28% w/v PEG 400, with both forms having a single OIH-1 molecule in the asymmetric unit. The model used for molecular replacement was modified using the program CHAINSAW17 such that the residues which were identical between the two enzymes were retained and all other truncated to alanine. The β-lactamase from Bacillus licheniformis Bs3 (Blich, PDB code 1i2s) was chosen as the search model due to the reasonably high sequence similarity between OIH-1 and Blich (55% identity, supporting Figure S1). The resultant molecular replacement solution was subjected to multiple rounds of structure refinement with REFMAC18 and manual model building with COOT.19 The 1.65 Å resolution data collected from a Form 1 crystal at SSRL beam line BL7-116 was used for the molecular replacement and initial refinement. A high resolution data set (1.25 Å resolution) was collected from a Form 2 crystal at the SSRL microfocus beamline BL12-2, and the data were processed and scaled using XDS and XSCALE.20 Molecular replacement using MOLREP21 was repeated using a partially rebuilt OIH-1 model derived from the 1.65 Å resolution refinement. Thermal displacement parameters were refined anisotropically once all the protein residues had been built according to the OIH-1 sequence. Water molecules were added in residual 2Fo-Fc and Fo-Fc electron density and were also refined anisotropically. During the latter stages, refinement was switched to PHENIX22 which enabled refinement of the site occupancies for residues which showed evidence of radiation damage. The final crystallographic R-factor and the Rfree for a randomly selected 5% of the data were 0.150 and 0.174, respectively for data between 42.0 and 1.25 Å resolution. Relevant statistics are given in Table 1.
Table 1.
Data collection and refinement statistics
| Data collection | |
| Space group | P3121 |
| Cell dimensions - a, b, c (Å) | 56.0, 56.0, 165.9 |
| Wavelength (Å) | 0.97946 |
| Resolution (Å) | 1.25 |
| Reflections, observed / unique | 416669 / 84295 |
| Rsym | 5.5 (60.8) |
| I / σI | 13.6 (2.1) |
| Completeness (%) | 99.8 (99.9) |
| Redundancy | 4.5 (4.3) |
| Refinement | |
| Resolution (Å) | 41.9 – 1.25 |
| Reflections, work / free | 80064 / 4208 |
| Rwork / Rfree | 0.150 / 0.174 |
| Molecules in the asymmetric unit | 1 |
| Atoms | |
| - protein | 2151 |
| - ligands/ions | 1 HEPES / 8 CA2+ / 1 Cl- |
| - water | 515 |
| B-factors | |
| - protein | 19.4 |
| - ligands/ions | 24.7 / 24.9 / 20.9 |
| - water | 38.2 |
| rms deviations | |
| - bond lengths (A) | 0.009 |
| - bond angles (°) | 1.3 |
The values in parentheses are for the highest-resolution shell, 1.3 Å - 1.25 Å. One crystal was used for the data collection.
Several of OIH-1 Form 1 crystals were soaked in 1.2 M RbBr and a data set collected at the peak of the rubidium absorption edge. An anomalous difference map calculated from this data showed a large number of Rb+ ions clustered at the molecular surface, several of which corresponded to the positions occupied by Ca2+ in the native Form 2 crystals.
Differential scanning calorimetry (DSC)
Experiments were conducted on a Nano II Differential scanning calorimeter (Model 6100). Before the measurements, aliquots of enzyme were dialyzed overnight in 25 mM HEPES, pH 7.5 without or with 5 M NaCl using 7 kDa cutoff Slide-A-Lizer dialysis cassettes (Pierce). Protein concentrations were determined by the absorbance at 280 nm using a molar extinction coefficient 2.59 × 10⁴ M-1cm-1. Buffer dialysates were used for conditioning and as a blank reference in DCS runs. The scans were performed under 2.8 atm constant pressure in the 20-85 °C temperature range with 1 °C/min heating and cooling rate, and with 2.5-3.2 mg/ml enzyme. Thermogram data were analyzed with the CpCalc software (Calorimetry Sciences Corporation).
Programs used and Data Deposition
Superpositions were performed using the SSM procedure23 implemented in COOT, and LSQKAB in the CCP4 suite.17 All figures were generated using PYMOL (http://pymol.sourceforge.net). Molecular surface areas were calculated with NACCESS as implemented on the Protein Interactions Calculator (PIC).24
Results
Expression of OIH-1 β-Lactamase
To investigate if OIH-1 is a functional β-lactamase, a synthetic gene encoding the identical enzyme was constructed, but optimized for expression in Escherichia coli. The β-lactamases from both Gram-positive and Gram-negative bacteria possess leader sequences, short polypeptides that target the protein for transport outside the cytoplasm. The leader sequence is enzymatically removed from the full-length protein in the process of transport to produce the mature, active β-lactamase. In Gram-negative bacteria such as E. coli the transported β-lactamase is released in the periplasmic space, whereas in Gram-positive organisms, the protein is partly released to the external milieu and partly is associated with the outer surface of the cell wall. To facilitate the transfer of OIH-1 into the periplasmic space of Gram-negative E. coli, the gene for the OIH-1 was cloned under the leader sequence of the well-studied TEM-1 β-lactamase, an enzyme widely distributed in various Gram-negative bacteria. Cell extracts containing expressed protein were able to hydrolyze the chromogenic β-lactam antibiotic nitrocefin, an indication that cells produced functional β-lactamase. N-terminal amino acid sequence analysis of β-lactamase isolated from the periplasm of E. coli revealed that in addition to the TEM-1 leader sequence, the first 30 amino acids of OIH-1 were also removed upon its translocation into the periplasm. Based on these findings, four additional constructs were prepared. In one of the constructs OIH-1 was expressed under its own predicted leader (the TEM-1 leader was removed), in another construct the predicted leader of OIH-1 was deleted, while in the remaining two constructs the predicted leader of OIH-1 was removed and the truncated gene was fused either with the oligonucleotide for the TEM-1 leader or that of the leader of the outer-membrane protein OmpA. We placed all four constructs under the strong constitutive promoter of the d-amino acid aminotransferase gene, cloned them into the pHF016 vector and introduced them by transformation into E. coli DH10B.
Susceptibility testing demonstrated that E. coli harboring the OIH-1 β-lactamase produces high levels of resistance to various penicillins (penicillin G, penicillin V, ampicillin, amoxicillin, carbenicillin, ticarcillin, and piperacillin), but not to other types of β-lactam antibiotics (Table 2). The ability of all four constructs to render E. coli resistant to penicillins indicates that in all cases β-lactamase was transported into the periplasmic space of E. coli. As expected, no resistance was produced when the enzyme was expressed without the leader sequence and thus was retained in the cytoplasm. In fact, OIH-1 expressed under its own leader reproducibly produced slightly higher levels of resistance to β-lactams in E. coli than the enzyme that was expressed under the leader of the E. coli TEM-1 β-lactamase and the same level of resistance as the enzyme cloned under the OmpA leader (Table 2). These data indicate that the leader of the OIH-1 β-lactamase, an enzyme intrinsic to a Gram-positive microorganism, is recognized and efficiently utilized by Gram-negative E. coli to facilitate transport of the enzyme across its cytoplasmic membrane.
Table 2.
MICs of β-lactam antibiotics against E. coli strain producing the OIH-1 β-lactamase fused to various leader sequences
| Antibiotic | MICs (μg/ml) produced by | |||||
|---|---|---|---|---|---|---|
| TEM + OIH | OIH | TEM | OMP | none | vector | |
| Penicillin G | 64 | 256 | 64 | 256 | 32 | 32 |
| Penicillin V | 256 | 512 | 256 | 512 | 128 | 128 |
| Ampicillin | 128 | 256 | 64 | 256 | 4 | 4 |
| Amoxicillin | 256 | 512 | 128 | 512 | 8 | 8 |
| Carbenicillin | 1024 | 2048 | 512 | 2048 | 16 | 16 |
| Ticarcillin | 1024 | 2048 | 256 | 2048 | 8 | 8 |
| Piperacillin | 8 | 16 | 2 | 16 | 2 | 2 |
| Cephalothin | 8 | 8 | 8 | 8 | 8 | 8 |
| Cefotaxime | 0.12 | 0.06 | 0.12 | 0.12 | 0.06 | 0.06 |
| Ceftazidime | 0.5 | 0.5 | 0.5 | 0.5 | 0.5 | 0.5 |
| Aztreonam | 0.25 | 0.12 | 0.25 | 0.25 | 0.25 | 0.25 |
| Imipenem | 0.25 | 0.25 | 0.25 | 0.25 | 0.25 | 0.25 |
TEM, leader of the TEM-1 β-lactamase; OIH, leader of the OIH-1 β-lactamase; OMP, leader of the outer membrane protein OmpA; none, no leader; vector, E. coli DH10B with the vector pHF016. MIC = minimum inhibitory concentration.
Enzymatic Characterization of OIH-1
To further characterize this new β-lactamase, we purified it to homogeneity and studied its kinetics with various β-lactam antibiotics and β-lactamase inhibitors. The enzyme is catalytically competent and is indeed quite efficient in turnover of penicillins with kcat/Km values in the range 106 – 107 M-1s-1 (Table 3). It also turns over other types of substrates, but significantly less effectively. There are three mechanism-based inhibitors for class A β-lactamases currently available for clinical use, clavulanate, tazobactam, and sulbactam. These inhibitors exploit the catalytic steps of β-lactamase itself and lead to covalent and irreversible inhibition of these enzymes.5 Since mechanism-based inhibitors of class A β-lactamases are β-lactams themselves, they serve as substrates (kcat events), but by a subversion of the catalytic events they lead to enzyme inactivation (kinact events). The ratio of kcat/kinact (partition ratio) is a measure of efficiency of the inhibition process and the lower the value, the better the process. The full set of catalytic parameters for inhibition of OIH-1 by the three inhibitors was evaluated (Table 4) and compared to the parameters for inhibition of the TEM-1.25 Partition ratios for clavulanate, tazobactam, and sulbactam measured for the OIH-1 enzyme are 60-, 7.2-, and 46-fold lower than the respective values for TEM-1.25 Hence, OIH-1 is more readily prone to inhibition by clavulanate than is TEM-1. The implication from these kinetics studies is that the catalytic steps in the mechanism of turnover of substrates and those of covalent inhibition by class A β-lactamases are shared with OIH-1.
Table 3.
Kinetic parameters for the hydrolysis of various β-lactam antibiotics by the OIH-1 β-lactamase
| β-Lactam | Km (μM) | kcat (s-1) | kcat/Km(M-1s-1) |
|---|---|---|---|
| Penicillin G | 3.3 ± 0.2 | 31.5 ± 0.2 | (9.5 ± 0.5) × 106 |
| Penicillin V | 3.8 ± 0.2 | 48.2 ± 0.6 | (1.3 ± 0.1) × 107 |
| Ampicillin | 16 ± 0.5 | 93.0 ± 1.0 | (5.8 ± 0.2) × 106 |
| Carbenicillin | 11.5 ± 1.1 | 7.5 ± 0.2 | (6.5 ± 0.5) × 105 |
| Ticarcillin | 7 ± 0.8 | 5.7 ± 0.2 | (8.1 ± 0.8) × 105 |
| Cephalothin | 380 ± 70 | 3.0 ± 0.5 | (7.9 ± 2.0) × 103 |
| Cefotaxime* | - | - | (1.0 ± 0.1) × 102 |
| Ceftazidime* | - | - | (1.9 ± 0.2) × 101 |
| Aztreonam* | - | - | (3.4 ± 0.3) × 102 |
| Imipenem | 470 ± 27 | 9.2 ± 0.9 × 10⁻³ | (2.0 ± 0.2) × 101 |
Km and kcat values could not be determined. The substrate concentration range that is experimentally attainable is far below saturation.
Table 4.
Inhibition profile of the OIH-1 β-lactamase for β-lactamase inhibitors
| Clavulanic acid | Tazobactam | Sulbactam | |
|---|---|---|---|
| kcat(s-1) | (2.5 ± 0.1) × 10-2 | (8.9 ± 0.3) × 10-2 | (9.5 ± 0.2) × 10-2 |
| kinact(s-1) | (1.2 ± 0.1) × 10-2 | (1.3 ± 0.1) × 10-3 | (4.4 ± 0.2) × 10-4 |
| Ki (μ M) | 2.5 ± 0.3 | 1.8 ± 0.3 | 17.0 ± 3.0 |
| Partition ratio | 2.1 ± 0.1 | 66 ± 2 | 218 ± 4 |
| Partition ratio (TEM-1)25 | 125 ± 36 | 475 ± 42 | 10,000 |
The OIH-1 Structure and Comparison with Other β-Lactamases
The OIH-1 β-lactamase was crystallized and its structure was determined by molecular replacement using the Blich structure as the search model, and refined at 1.25 Å resolution in space group P3121 to a final crystallographic R-factor of 15.0% and an Rfree of 17.4%. The final model comprises residues 44-304, with the first 43 residues encompassing the 30-residue leader sequence and 13 residues not observed in the current structure due to disorder. This corresponds to residues 28-292 in the standard Ambler class A β-lactamase numbering26 (supporting Figure S1 for conversion). This numbering scheme puts the catalytic serine at position 70 and the essential active site glutamate at position 166, which conforms to the convention. The overall OIH-1 structure comprises two structural domains (domains 1 and 2), similar to other class A β-lactamases (Figures 1A and 1B). The OIH-1 structure shows a significantly higher sequence and structural correspondence with Blich (55% sequence identity) than with TEM-1 (34% sequence identity), with rms differences (rmsds) of 0.81 Å (for 254 Cα atoms) and 1.53 Å (for 240 Cα atoms) for Blich and TEM-1, respectively, following superposition of the structures. Inspection of the OIH-1/TEM-1 superposition (Figure 1B) shows that in OIH-1, both the N-terminal and C-terminal helices, along with three loops in domain 1 are displaced from the corresponding elements in TEM-1. Domain 2 of OIH-1 shows somewhat better structural similarity, and when OIH-1 and TEM-1 are superimposed based on this domain only, the rmsd drops to 0.95 Å (135 matching Cα atoms). Analysis of the intramolecular interactions in these three β-lactamases (see supporting Table S1) shows that there are no significant differences in the number of interactions (hydrogen bonds, salt bridges, hydrophobic, and aromatic interactions).
Figure 1.
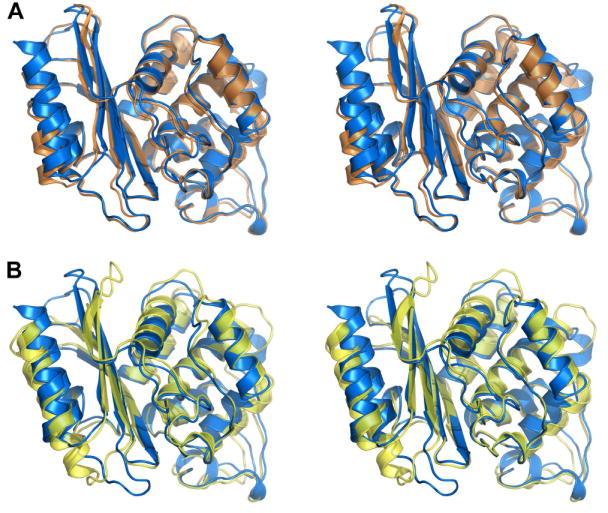
The structure of OIH-1 and comparison with other β-lactamases. (A) Stereoview of the superimposition of OIH-1 (blue) and Blich (orange). (B) Stereoview of the superimposition of OIH-1 (blue) and TEM-1 β-lactamase (yellow). All figures were generated with PYMOL (http://pymol.sourceforge.net).
The OIH-1 active site, located between the two structural domains, has all the essential catalytic residues present (Figure 2). The structural disposition of these residues in OIH-1 resembles those in other class A β-lactamases, comprising the catalytic serine Ser70, Lys73 and Glu166. A water molecule lies between the Ser70 and Glu166 side chains, held in place by hydrogen bonds with these two residues and a third conserved residue Asn170. This water molecule occupies the position of the hydrolytic water in other class A β-lactamase structures and should play the same role in OIH-1. The conserved catalytic residues overlay rather well; when superimposed based upon Ser70, Lys73, Glu166, Asn170, and Thr237, the values for rmsd for these specific residues are 0.31 Å, 0.26 Å, and 0.34 Å for the Blich, TEM-1, and SHV-1 enzymes, respectively. Difference electron density in the vicinity of the active site was modeled as a HEPES molecule, with the sulfonate moiety bound in an anion-binding pocket adjacent to Ser70. HEPES or MES buffer molecules have also been observed in this same site in other class A β-lactamases including SHV-1,27 K128 and more recently TEM-1,29 along with inorganic sulfate.30-33 This anion-binding site has been implicated in binding the carboxylate of several β-lactamase substrates and inhibitors.34-37
Figure 2.
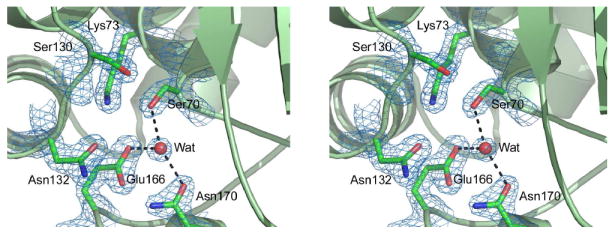
The OIH-1 active site. Stereoview showing the locations of the conserved amino acids critical for activity in the β-lactamases. The water molecule (Wat) is in an identical location to the hydrolytic water molecule observed in all other active β-lactamase enzymes.
Sequence comparisons between OIH-1, TEM-1, SHV-1, and several Bacillus β-lactamases (supporting Figure S1 and supporting Tables S1 and S2) show that OIH-1 has a markedly different distribution of charged residues, with the number of acidic amino acid residues significantly elevated (66 out of 274 residues in the mature OIH-1 enzyme). By comparison Blich has 46 acidic residues out of 282, TEM-1 has 36/286 and SHV-1 has 31/286. In particular the number of glutamate residues in OIH-1 has increased almost 2-fold over Blich and TEM-1. Conversely, the number of basic residues in OIH-1 has decreased slightly (25 compared to 39, 30, and 32 in Blich, TEM-1, and SHV-1, respectively). The relative levels of other amino acids appears similar across these four β-lactamases.
The solvent accessible surfaces of OIH-1, TEM-1, SHV-1 and Blich were analyzed and compared. Of the 62 acidic residues in the current OIH-1 structure, 55 are exposed on the surface. By comparison TEM-1, SHV-1, and Blich have a much smaller number of exposed acidic residues. This increase in acidic residues on the OIH-1 surface gives a surface acidic/basic ratio of 2.75 and an overall surface charge density of -3.05 × 10⁻³ e/Å2, far greater than the corresponding values for Blich (-0.46 × 10⁻³ e/Å2), TEM-1 (-0.17 × 10⁻³ e/Å2), and SHV-1 (0.45 × 10⁻³ e/Å2) (supporting Table S2). The electrostatic surfaces of OIH-1, Blich, and TEM-1 are shown in Figure 3 and the predominance of negative charge on OIH-1 is strikingly obvious (Figure 3A). The moderately thermophilic Blich (Figure 3B) and the mesophilic TEM-1 (Figure 3C) have electrostatic surfaces with a somewhat random distribution of acidic and basic residues, in contrast to the OIH-1 surface, which is almost entirely acidic.
Figure 3.
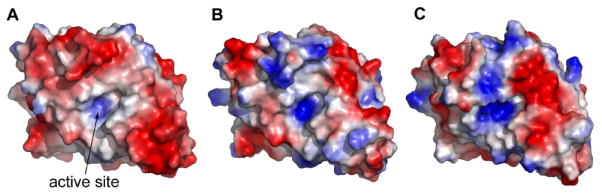
Electrostatic surface representations. (A) OIH-1; (B) Blich; and (C) TEM-1 in the same relative orientation, looking into the active site cleft. Negatively charged surface is colored red and positively charged surface is in blue.
Early in the refinement of OIH-1, several large peaks were identified in difference electron density maps near the exposed acidic side chains, approximately 2.3-2.5 Å from protein atoms. When these were built and refined as water molecules, their atomic displacement parameters (ADPs or temperature factors) dropped to well below the average for the surrounding molecules, indicative of atoms with higher electron density than an oxygen atom. Since the most obvious candidate is calcium (the crystallization conditions contain 0.2 M CaCl2), these peaks were refined as Ca2+ and the ADPs converged at values similar to the surrounding protein atoms. Eight Ca2+ ions (Ca1 – Ca8) were identified in the model, based initially upon anomalies in the temperature factors of several water molecules, and their locations were later verified by the calculation of an anomalous difference map using the 1.25 A data (Figure 4A) and an anomalous difference map calculated with a data set collected from OIH-1 crystals soaked in RbBr (data not shown). Five of these Ca2+ ions are at an interface with symmetry-related OIH-1 molecules. Four of these cations form part of a solvent-mediated cluster near six highly exposed acidic residues (Figure 4B); Asp159 and Glu162 from helix H6, Glu174 and Asp176 from the loop linking H6 and the short 310 helix (H7), and Asp213 and Asp215 at the N-terminus of helix H9 from a symmetry-related molecule (OIH-1 residue numbering, see supporting Figure S1 for secondary structure nomenclature and conversion to the standard Ambler class A β-lactamase numbering26).
Figure 4.
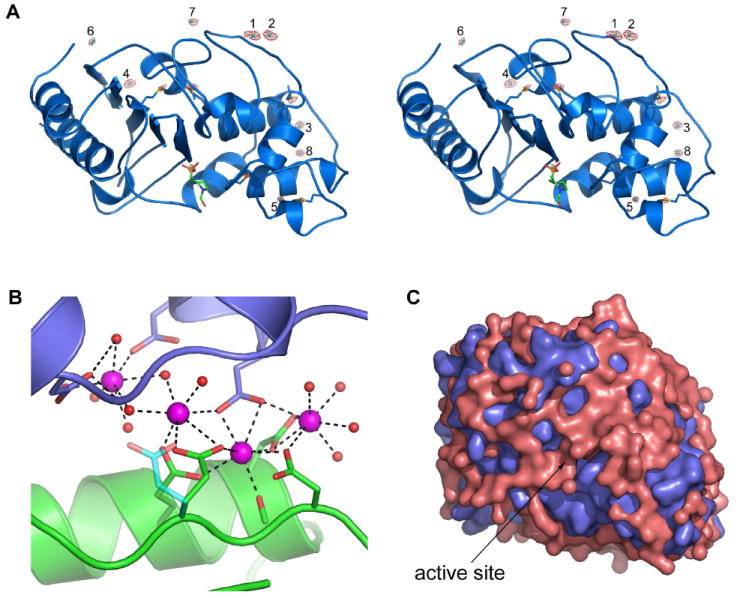
Calcium and water on the surface of OIH-1. (A) Stereoview of the anomalous difference map calculated from the 1.25 Å data. The map was contoured at 4σ and the anomalous peaks are shown in red. The eight calcium ions are labeled 1 to 8. The additional peaks are due to the sulfur atoms of the six methionine residues (indicated as blue sticks), and the sulfur atom in the HEPES molecule bound in the active site (shown in green sticks). (B) The calcium/solvent cluster at the interface between two OIH-1 molecules (colored green at the bottom and blue at the top). The four calcium ions are colored magenta and the associated water molecules as red spheres. (C) The molecular surface of OIH-1 (blue) overlaid with a surface representation of the 515 bound water molecules (pink) to show the extensive nature of the solvent networks.
Discussion
O. iheyensis is a Gram-positive bacterium isolated from the sediment collected at the bottom of the ocean. In Gram-positive bacteria, β-lactamases are secreted to the environment. Hence, OIH-1 is expected to be fully exposed to the salinity of the oceanic water. That is to say, OIH-1 has evolved to retain activity in the presence of high salt. Our kinetics studies demonstrate that OIH- 1 β-lactamase indeed is active over a very broad range of salt concentrations. In fact, within the measured range of NaCl concentration (from 0 to 5.1 M), the turnover rate (kcat) of β-lactam antibiotic ampicillin remained virtually unaffected, while the Michaelis constant (Km) only gradually increased, reaching a 3.5-fold higher value at saturating concentration of salt (supporting Table S3). These observations are consistent with the claim that the chemical step of catalysis is not affected by high concentration of NaCl. The enzyme also demonstrated higher stability in conditions of increased salinity, as judged by the increased in its melting point from 60.1 °C (at 0 M NaCl) to 67.0 °C in the presence of 5 M NaCl measured by differential scanning calorimetry (data not shown).
From the structural analysis of several halophilic enzymes, salt stability has been attributed to a number of factors, including an increase in the ratio of acidic to basic residues and a corresponding increase in the negative electrostatic surface potential,38-42 a reduction in enzyme hydrophobic surface resulting mainly from the loss of surface lysines and their corresponding alkyl tails,40, 41 changes in surface solvation and cation binding,38, 41, 43 and an increase in the number of intermolecular salt bridges in multimeric proteins.43, 44 The OIH-1 β-lactamase shares the most noticeable structural feature characteristic of halophilic enzymes, namely, it has a highly acidic surface due primarily to the increase in glutamate residues and moderate decrease in the number of basic residues, compared to mesophilic β-lactamases (supporting Table S2). OIH-1 is the most halotolerant bacterial enzyme whose structure has been determined, based upon surface properties and charge density (supporting Tables S2 and S4), with only four extremophilic archaeal enzymes being more halophilic; dodecin, a flavin-binding protein from Halobacterium salinarum,39 the small 2Fe-2S ferredoxin from Haloarcula marismortui,38 malate dehydrogenase from H. marismortui,43 and nucleoside diphosphate kinase from H. salinarum.45
One of the only significant patches of positively charged surface on OIH-1 appears to be inside the active site pocket (Figure 3A), and this positive charge seems to be conserved in Blich and TEM-1 (Figures 3B and 3C). This positive charge in OIH-1 results from the highly conserved residues Lys234 and Arg244, which line the pocket. Arg244 is involved in an electrostatic interaction with the carboxylate group on the β-lactam46 and the presence of the positive charge localized inside the pocket is what draws the carboxylate of the β-lactam molecule into the pocket.46 This initial interaction between the enzyme and substrate is important for the highly negatively charged OIH-1. Not surprisingly, the clustering of the acidic residues at the molecular surface appears to be a common feature of proteins from O. iheyensis. Two other structures from this deep sea bacterium have been deposited in the PDB, but not yet published (dihydropicolinate synthase, DHPS (3d0c) and muconate cycloisomerase, MCI (3fyy)). Both enzymes show the characteristics of halotolerance (supporting Table S2), DHPS in particular has a large negative surface charge density (-1.52 × 10⁻³ e/Å2). Analysis of charge distribution of the O. iheyensis genome as a whole indicates that approximately 77% of the gene products have a net negative charge, only slightly lower than that for the halophilic bacterium Salinibacter ruber (84%) and significantly greater than mesophiles such as E. coli (60%), Bacillus anthracis (56%), and even the slightly thermophilic B. licheniformis (62%). The extremely halophilic archaea on the other hand have over 90% of their gene products with net negative charge, which would classify O. iheyensis as a moderate halophile.
At 1.25 Å resolution and with an Rfree of 17.4%, the OIH-1 structure is the best resolved of any halotolerant enzyme to date, which allows for a very detailed analysis of the molecular surface and solvent structure. A feature that appears to be common to some halophilic enzymes is the accumulation of large number of cations and solvent molecules at the molecular surface38, 39. The presence of the calcium ions at the OIH-1 molecular surface serves to greatly neutralize some of the large patches of negative charge created by the clustering of acidic residues and this would have a large stabilizing effect on the structure. Moreover, since the majority of the calcium ions are associated with surface loops, these metal ions may also help stabilize these loop regions and prevent unfolding at elevated salt concentrations. Water molecules also play a key role in surface stabilization and visual inspection of the 515 water molecules included in the final OIH-1 model shows that almost the entire surface of the protein is enclosed in layers of ordered solvent (Figure 4C). The average number of water molecules per amino acid residue is 2.0, comparable to the corresponding number for ferredoxin from H. marismortui38 and for glucose dehydrogenase from Haloferax mediterranei,41 and significantly greater than the average of 1.4 calculated for a subset of 95 single-chain protein structures from the PDB of comparable size to OIH-1 (molecular weights between 25-35 kDa) and similar resolution (between 1.20 and 1.30 Å). Of the 515 water molecules in OIH-1, 354 can be classified as belonging to the first hydration shell, in that they make at least one hydrogen bond to a protein atom. This gives a solvent density at the molecular surface of 3.7 water molecules/100 A2, comparable to the value of 3.6 water/100 Å2 reported for H. marismortui ferredoxin,38 although the value for ferredoxin is misleading, since it also includes the water molecules that do not interact with the protein surface. Every surface-exposed charged and polar residue is hydrogen bonded to one or more water molecules; on average the acidic amino acid residues have 3.2 hydrogen bonds to water, the basic residues have 2.0, and the polar residues 1.7. Of all the 20 common amino acids, aspartate and glutamate have the highest propensity for the formation of hydrogen bonds with water,47 and this is clearly evident in the OIH-1 structure. It has been suggested that the prevalence of acidic amino acids on the surface of halophilic enzymes leads to the enhanced binding of water molecules, which makes the enzyme highly soluble,48 and stabilizes the tertiary structure in conditions of high salinity.41, 44, 49
Conclusions
The OIH-1 β-lactamase is the first antibiotic-resistance factor from a deep-sea microorganism. We have studied this enzyme by kinetics and by determination of its structure at high resolution. OIH-1 is a bona fide fully efficient β-lactamase with high hydrolytic activity against penicillins. Evolution with exposure to the saline environment of the ocean has led to the development of a highly negatively charged molecular surface enveloped by tightly-bound water molecules, completely restructured compared to β-lactamase enzymes from mesophilic terrestrial environments. This structural feature leading to high halotolerance while maintaining efficient catalytic activity, has evolved within this specific environmental niche, and cannot be an alien gene from other sources. A direct documentation of the existence of bona fide antibiotic resistance determinants in nature, uncontaminated by human exposure, is extremely rare, if not entirely unprecedented. OIH-1 is the first example of an antibiotic-resistance enzyme that has evolved in the depths of the ocean in isolation from clinical selection, which gives an extraordinary glimpse into protein evolution under extreme conditions. In light of the fact that microbial life has evolved in the oceans as a niche during evolutionary time scale, it is likely that an oceanic reservoir for a resistome – a collection of antibiotic-resistance genes in microorganisms – exists.50 This oceanic resistome should complement and supplement the acknowledged one from terrestrial sources. We can only speculate that the OIH-1 β-lactamase has evolved in O. iheyensis as a protective means against β-lactam molecule secreted by competing species of antibiotic-producing microorganisms that share the same ecological niche. Actinomycetes, known producers of β-lactam antibiotics have been found to inhabit the same niche within the Pacific Ocean.51
Supplementary Material
Acknowledgments
SSRL is a national user facility operated by Stanford University on behalf of the U.S. Department of Energy, Office of Basic Energy Sciences. The SSRL Structural Molecular Biology Program is supported by the Department of Energy (BES, BER) and by the National Institutes of Health (NCRR, BTP, NIGMS). The authors thank T. Doukov at SSRL for RbBr soaking and collection of the data at the rubidium absorption edge.
Footnotes
Supporting Information Available. The atomic coordinates and experimental data for the O. iheyensis β-lactamase structure are available in the Protein Data Bank (PDB) with ID 3xxx. One supporting figure (Figure S1) and four supporting tables (Tables S1, S2, S3 and S4) are available free of charge via the internet at http://pubs.acs.org/.
References
- 1.Benveniste R, Davies J. Proc Natl Acad Sci. 1973;70:2276–2280. doi: 10.1073/pnas.70.8.2276. [DOI] [PMC free article] [PubMed] [Google Scholar]
- 2.Koch AL. Crit Rev Microbiol. 2000;26:205–220. doi: 10.1080/10408410091154228. [DOI] [PubMed] [Google Scholar]
- 3.Fisher JF, Meroueh SO, Mobashery S. Chem Rev. 2005;105:395–424. doi: 10.1021/cr030102i. [DOI] [PubMed] [Google Scholar]
- 4.Walsh C. Antibiotics Actions, origins, resistance. ASM Press; Washington, D.C.: 2003. [Google Scholar]
- 5.Bush K, Mobashery S. Adv Exp Med Biol. 1998;456:71–98. [PubMed] [Google Scholar]
- 6.Hall BG, Barlow M. Drug Resist Update. 2004;7:111–123. doi: 10.1016/j.drup.2004.02.003. [DOI] [PubMed] [Google Scholar]
- 7.Koch AL. Clin Microbiol Reviews. 2003;16:673–687. doi: 10.1128/CMR.16.4.673-687.2003. [DOI] [PMC free article] [PubMed] [Google Scholar]
- 8.Hugenholtz P. Genome Biol. 2002;3:1–8. doi: 10.1186/gb-2002-3-2-reviews0003. [DOI] [PMC free article] [PubMed] [Google Scholar]
- 9.D’Costa VM, McGrann KM, Hughes DW, Wright GD. Science. 2006;311:374–377. doi: 10.1126/science.1120800. [DOI] [PubMed] [Google Scholar]
- 10.Riesenfeld CS, Schloss PD, Handelsman J. Annu Rev Genet. 2005;38:525–552. doi: 10.1146/annurev.genet.38.072902.091216. [DOI] [PubMed] [Google Scholar]
- 11.Allen HK, Moe LA, Rodbumrer J, Gaarder A, Handelsman J. ISME J. 2009;3:243–251. doi: 10.1038/ismej.2008.86. [DOI] [PubMed] [Google Scholar]
- 12.Poirel L, Héritier C, Nordmann P. J Antimicrob Chemother. 2005;55:680–685. doi: 10.1093/jac/dki065. [DOI] [PubMed] [Google Scholar]
- 13.Michaux C, Massant J, Kerff F, Frère J, Docquier J, Vandenberghe I, Samyn B, Pierrard A, Feller G, Charlier P, Van Beeumen J, Wouters J. FEBS J. 2008;275:1687–1697. doi: 10.1111/j.1742-4658.2008.06324.x. [DOI] [PubMed] [Google Scholar]
- 14.Dixon M. Biochem J. 1953;55:170–117. doi: 10.1042/bj0550170. [DOI] [PMC free article] [PubMed] [Google Scholar]
- 15.Silverman RB. Methods Enzymol. 1995;249:240–283. doi: 10.1016/0076-6879(95)49038-8. [DOI] [PubMed] [Google Scholar]
- 16.Toth M, Vakulenko SB, Smith CA. Acta Crystallogr. 2009;F65:582–585. doi: 10.1107/S1744309109015759. [DOI] [PMC free article] [PubMed] [Google Scholar]
- 17.Collaborative Computing Project No. 4. Acta Crystallogr. 1994;D50:760–763. [Google Scholar]
- 18.Murshudov GN, Vagin AA, Dodson EJ. Acta Crystallogr. 1997;D53:240–255. doi: 10.1107/S0907444996012255. [DOI] [PubMed] [Google Scholar]
- 19.Emsley P, Cowtan K. Acta Crystallogr. 2004;D60:2126–2132. doi: 10.1107/S0907444904019158. [DOI] [PubMed] [Google Scholar]
- 20.Kabsch W. J Appl Cryst. 1993;26:795–800. [Google Scholar]
- 21.Vagin A, Teplyakov A. J Appl Cryst. 1997;30:1022–1025. [Google Scholar]
- 22.Adams PD, Grosse-Kunstleve RW, Hung L-W, Ioerger TR, McCoy AJ, Moriarty NW, Read RJ, Sacchettini JC, Sauter NK, Terwilliger TC. Acta Crystallogr. 2002;D58:1948–1954. doi: 10.1107/s0907444902016657. [DOI] [PubMed] [Google Scholar]
- 23.Krissinel E, Henrick K. Acta Crystallogr. 2004;D60:2256–2268. doi: 10.1107/S0907444904026460. [DOI] [PubMed] [Google Scholar]
- 24.Tina KG, Bhadra R, Srinivasan N. Nucleic Acids Res. 2007;35:W473–W476. doi: 10.1093/nar/gkm423. [DOI] [PMC free article] [PubMed] [Google Scholar]
- 25.Thomas VL, Golemi-Kotra D, Kim C, Vakulenko SB, Mobashery S, Shoichet BK. Biochemistry. 2005;44:9330–9338. doi: 10.1021/bi0502700. [DOI] [PMC free article] [PubMed] [Google Scholar]
- 26.Ambler RP, Coulson AFW, Frere JM, Ghuysen JM, Joris B, Forsman M, Levesque RC, Tiraby G, Waley SG. Biochem J. 1991;276:269–270. doi: 10.1042/bj2760269. [DOI] [PMC free article] [PubMed] [Google Scholar]
- 27.Nukaga M, Mayama K, Hujer AM, Bonomo RA, Knox JR. J Mol Biol. 2003;328:289–301. doi: 10.1016/s0022-2836(03)00210-9. [DOI] [PubMed] [Google Scholar]
- 28.Nukaga M, Mayama K, Crichlow GV, Knox JR. J Mol Biol. 2002;317:109–117. doi: 10.1006/jmbi.2002.5420. [DOI] [PubMed] [Google Scholar]
- 29.Brown NG, Shanker S, Venkataram Prasad BV, Palzkill T. J Biol Chem. 2009 doi: 10.1074/jbc.M109.053819. [DOI] [PMC free article] [PubMed] [Google Scholar]
- 30.Jelsch C, Mourey L, Masson JM, Samama JP. Proteins. 1993;16:364–383. doi: 10.1002/prot.340160406. [DOI] [PubMed] [Google Scholar]
- 31.Ibuka A, Taguchi A, Ishiguro M, Fushinobu S, Ishii Y, Kamitori S, Okuyama K, Yamaguchi K, Konno M, Matsuzawa H. J Mol Biol. 1999;285:2079–2087. doi: 10.1006/jmbi.1998.2432. [DOI] [PubMed] [Google Scholar]
- 32.Tranier S, Bouthors AT, Maveyraud L, Guillet V, Sougakoff W, Samama JP. J Biol Chem. 2000;275:28075–28082. doi: 10.1074/jbc.M003802200. [DOI] [PubMed] [Google Scholar]
- 33.Smith CA, Caccamo M, Kantardjieff KA, Vakulenko S. Acta Crystallogr. 2007;D63:982–992. doi: 10.1107/S0907444907036955. [DOI] [PubMed] [Google Scholar]
- 34.Wang X, Minasov G, Shoichet BK. Proteins. 2002;47:86–96. [PubMed] [Google Scholar]
- 35.Crichlow GV, Nukaga M, Doppalapudi VR, Buynak JD, Knox JR. Biochemistry. 2001;40:6233–6239. doi: 10.1021/bi010131s. [DOI] [PubMed] [Google Scholar]
- 36.Strynadka NCJ, Adachi H, Jensen SE, Johns K, Sielecki A, Betzel C, Sutoh K, James MNG. Nature. 1992;359:700–705. doi: 10.1038/359700a0. [DOI] [PubMed] [Google Scholar]
- 37.Chen CC, Herzberg O. Biochemistry. 2001;40:2351–2358. doi: 10.1021/bi002277h. [DOI] [PubMed] [Google Scholar]
- 38.Frolow F, Harel M, Sussman JL, Mevarech M, Shoham M. Nat Struct Biol. 1996;3:452–458. doi: 10.1038/nsb0596-452. [DOI] [PubMed] [Google Scholar]
- 39.Bieger B, Essen LO, Oesterhelt D. Structure. 2003;11:375–385. doi: 10.1016/s0969-2126(03)00048-0. [DOI] [PubMed] [Google Scholar]
- 40.Premkumar L, Greenblatt HM, Bageshwar UK, Savchenko T, Gokhman I, Sussman JL, Zamir A. Proc Natl Acad Sci. 2005;102:7493–7498. doi: 10.1073/pnas.0502829102. [DOI] [PMC free article] [PubMed] [Google Scholar]
- 41.Britton KL, Baker PJ, Fisher M, Ruzheinikov S, Gilmour DJ, Bonete MJ, Ferrer J, Pire C, Esclapez J, R DW. Proc Natl Acad Sci. 2006;103:4846–4851. doi: 10.1073/pnas.0508854103. [DOI] [PMC free article] [PubMed] [Google Scholar]
- 42.Kastritis PL, Papandreou NC, Hamodrakas SJ. Int J Biol Macromol. 2007;41:447–453. doi: 10.1016/j.ijbiomac.2007.06.005. [DOI] [PubMed] [Google Scholar]
- 43.Richard SB, Madern D, Garcin E, Zaccai G. Biochemistry. 2000;39:992–1000. doi: 10.1021/bi991001a. [DOI] [PubMed] [Google Scholar]
- 44.Madern D, Ebel C, Zaccai G. Extremophiles. 2000;4:91–98. doi: 10.1007/s007920050142. [DOI] [PubMed] [Google Scholar]
- 45.Besir H, Zeth K, Bracher A, Heider U, Ishibashi M, Tokunaga M, Oesterhelt D. FEBS Lett. 2005;579:6595–6600. doi: 10.1016/j.febslet.2005.10.052. [DOI] [PubMed] [Google Scholar]
- 46.Zafaralla G, Manavathu EK, Lerner SA, Mobashery S. Biochemistry. 1992;31:3847–3852. doi: 10.1021/bi00130a016. [DOI] [PubMed] [Google Scholar]
- 47.Kuntz ID. J Am Chem Soc. 1971;93:516–518. doi: 10.1021/ja00731a037. [DOI] [PubMed] [Google Scholar]
- 48.Mevarech M, Frolow F, Gloss LM. Biophys Chem. 2000;86:155–164. doi: 10.1016/s0301-4622(00)00126-5. [DOI] [PubMed] [Google Scholar]
- 49.Dym O, Mevarech M, Sussman JL. Science. 1995;267:1344–1346. doi: 10.1126/science.267.5202.1344. [DOI] [PubMed] [Google Scholar]
- 50.Wright GD. Nature Reviews Microbiol. 2007;5:175–186. doi: 10.1038/nrmicro1614. [DOI] [PubMed] [Google Scholar]
- 51.Takami H. Extremophiles. 1999;3:97–102. doi: 10.1007/s007920050104. [DOI] [PubMed] [Google Scholar]
Associated Data
This section collects any data citations, data availability statements, or supplementary materials included in this article.