Abstract
Sarcomeres are the basic contractile units of striated muscle. Our knowledge about sarcomere dynamics has primarily come from in vitro studies of muscle fibres1 and analysis of optical diffraction patterns obtained from living muscles2,3. Both approaches involve highly invasive procedures and neither allows examination of individual sarcomeres in live subjects. Here we report direct visualization of individual sarcomeres and their dynamical length variations using minimally invasive optical microendoscopy4 to observe second-harmonic frequencies of light generated in the muscle fibres5,6 of live mice and humans. Using microendoscopes as small as 350 µm in diameter, we imaged individual sarcomeres in both passive and activated muscle. Our measurements permit in vivo characterization of sarcomere length changes that occur with alterations in body posture and visualization of local variations in sarcomere length not apparent in aggregate length determinations. High-speed data acquisition enabled observation of sarcomere contractile dynamics with millisecond-scale resolution. These experiments point the way to in vivo imaging studies demonstrating how sarcomere performance varies with physical conditioning and physiological state, as well as imaging diagnostics revealing how neuromuscular diseases affect contractile dynamics.
The sliding filament theory of muscle contraction has long provided a framework for understanding muscle biology and disease. In 1954, two teams showed that during shortening of striated muscle the lengths of the constituent actin and myosin filaments remain constant, and therefore the filaments slide past each other7,8. The patterns of striation arise from the highly organized arrangement of sarcomeres—contractile units containing thousands of myosin motors and their associated actin filaments. The length of a sarcomere defines the number of available binding sites between actin and myosin, and is thus a crucial factor in determining the relationship between the length of a muscle and its force production.
Although the sliding filament theory successfully explains many experimental observations, a gap in our understanding persists regarding how spatial arrangements and temporal dynamics of sarcomeres determine biomechanical properties of muscles in living organisms. The need for this understanding is widespread, because many neuromuscular diseases arise from mutations in sarcomeric proteins9, and current biomechanical analyses that guide athletic performance, pre-operative diagnostics and rehabilitation technology rest on untested assumptions about sarcomere operating lengths and dynamics10. Owing to lack of techniques for visualizing individual sarcomeres in human subjects, experimentalists have resorted to invasive measurements of average sarcomere lengths across large populations of contractile units in human cadavers and animal models 11,12. However, without in vivo measurements of individual sarcomeres it is not possible to know precisely the normal operating range or variability of sarcomere lengths, how physiological regulation may adjust sarcomere lengths, or how sarcomere lengths are disrupted in disease. Here we report minimally invasive imaging measurements of individual sarcomeres and their contractile dynamics deep within the muscles of living mice and humans.
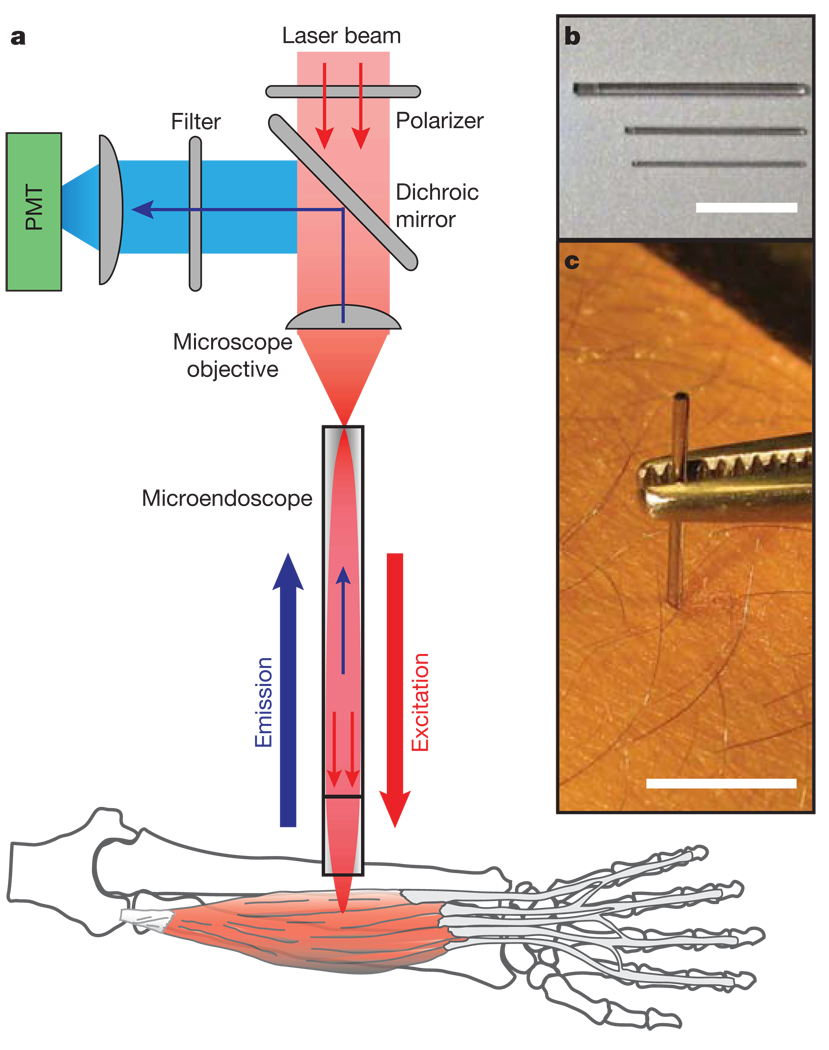
Our technique uses optical microendoscopes (Fig. 1) composed of gradient refractive index (GRIN) microlenses (350–1,000 µm in diameter), which can enter tissue in a minimally invasive manner and provide micrometre-scale imaging resolution4,13,14. To facilitate studies in humans, we sought to avoid use of exogenous labels and therefore explored the potential for microendoscopy to detect two intrinsic optical signals known to allow sarcomere imaging by laser-scanning microscopy. The first of these signals represents autofluorescence from nicotinamide adenine dinucleotide (NADH) and flavoproteins, which are concentrated in mitochondria along sarcomere Z-discs15,16. The other signal represents second-harmonic generation (SHG), coherent frequency-doubling of incident light, which is reported to occur within myosin rod domains17,18. Our instrumentation comprised an upright laser-scanning microscope adapted to permit addition of a microendoscope for deep-tissue imaging (Fig. 1). A microscope objective coupled the beam from an ultrashort-pulsed titanium–sapphire laser into the microendoscope to allow generation of two-photon excited autofluorescence and second-harmonic signals. In both cases, signal photons generated in thick tissue returned back through the microendoscope and were separated from the excitation beam on the basis of wavelength (Fig. 1a).
Figure 1. Minimally invasive microendoscopy system.
a, Schematic of the laser-scanning imaging system used to visualize sarcomeres in live subjects. A microscope objective focuses ultrashort pulsed laser illumination onto the face of a gradient refractive index microendoscope. The microendoscope demagnifies and refocuses the laser beam within the muscle and returns emitted light signals, which reflect off a dichroic mirror before detection by a photomultiplier tube (PMT). b, Shown are the three sizes of microendoscopes used: 1,000, 500 and 350 µm in diameter. c, 350-µm-diameter microendoscope clad in stainless steel for minimally invasive imaging in the arm of a human subject. Scale bars are 1 cm.
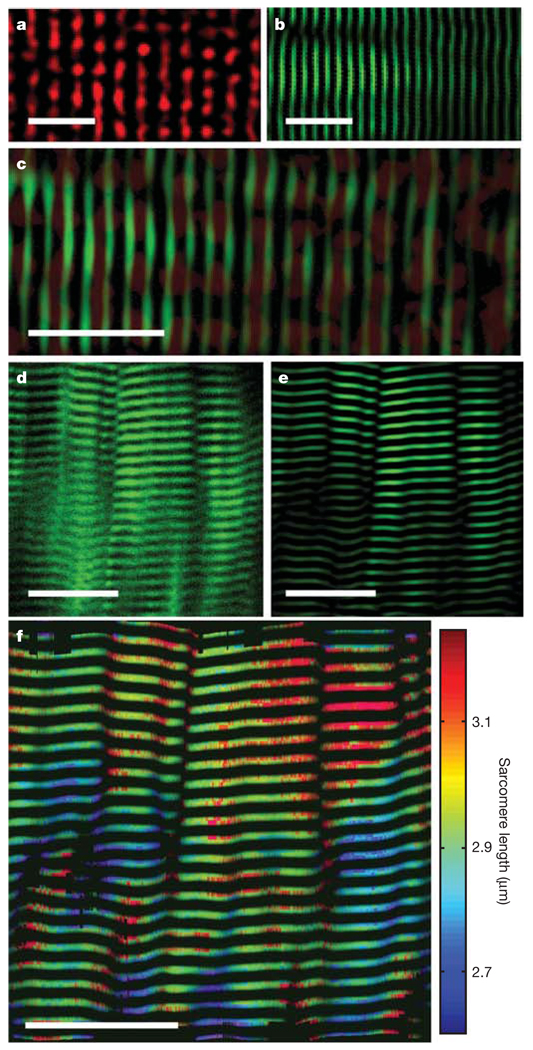
We started investigations by imaging autofluorescence and second-harmonic signals simultaneously from cultured muscle cells. The two signals were distinguishable by wavelength, by the partial polarization of SHG signals and their dependence on incident light polarization19, and by the predominance of trans-detected (that is, forward-propagating in a similar direction to the illumination) over epi-detected (backward-propagating) SHG signals20,21 (Supplementary Methods). With <30mW of incident laser power, sarcomeres were readily apparent using either of the intrinsic signals, especially after band-pass filtering the images to remove spatial frequencies representing distance scales outside the plausible range of sarcomere lengths (1–5 µm; Supplementary Fig. 1 and Fig. 2a, b). Overlaid images of autofluorescence and second-harmonic signals revealed that the two arise spatially out of phase within sarcomeres, as expected if autofluorescence were to come mainly from Z-disc mitochondria and SHG from myosin rods (Fig. 2c).
Figure 2. Static imaging of individual sarcomeres.
a, Image of a cultured mouse muscle fibre acquired by epi-detection of two-photon autofluorescence and band-pass filtered to highlight sarcomeres. b, A band-pass filtered image of the same fibre acquired by trans-detection of SHG. c, Overlaying a and b reveals that autofluorescence (red) and SHG (green) signals interdigitate. d, e, Raw (d) and band-pass-filtered (e) SHG images acquired using a 350-µm-diameter microendoscope inserted into the lateral gastrocnemius of an anaesthetized mouse. f, Map of sarcomere length variations within d and e. Scale bars are 10 µm in a–c, and 25 µm in d–f
Because trans-detection is challenging to use in live subjects, we explored the possibility of imaging epi-detected SHG and autofluorescence signals from the lateral gastrocnemius muscle of anaesthetized adult mice. Although SHG primarily arises in the forward-propagating direction, we hypothesized that there would be sufficient backward-propagation in thick tissue to allow in vivo microendoscopy, owing to multiple scattering of photons that were originally forward-propagating. Indeed, we found that in vivo SHG imaging of sarcomeres was feasible by microendoscopy using illumination wavelengths of ~820–980nm and generally led to better sarcomere visibility than did autofluorescence imaging (Supplementary Methods). This implies that SHG is an effective, endogenous contrast parameter that can be used to visualize sarcomeres in living subjects, and for all subsequent imaging we used only SHG and 920nm illumination.
We further explored the capabilities for imaging sarcomeres in anaesthetized mice. After inserting a microendoscope into the gastrocnemius, we regularly imaged large assemblies of individual muscle sarcomeres (n = 23 mice; Fig. 2d, e). Cardiac and respiratory movements often caused significant motion artefacts at image frame acquisition rates of <4 Hz, but at 4–15 Hz sarcomeres were readily identifiable within raw images. Insertion of the microendoscope helped to stabilize underlying tissue, reducing tissue motion and enhancing image quality. To test the utility of our data, we performed several illustrative analyses of the structure of muscle fibre in live mammals.
First we determined average sarcomere lengths and their local variability within individual muscle fibres and between adjacent fibres. Uncertainties in measurements of average sarcomere length within individual fibres can be reduced to limits set by the inherent biological variability, rather than by instrumentation, because the distance spanned by a large, countable number of sarcomeres can be determined at a diffraction-limited resolution. Thus, with 20–50 sarcomeres often visible concurrently, our measurements of average sarcomere length have ~20–50 nm accuracy. We found that individual sarcomere lengths can be surprisingly variable, with up to ~20% variations within a ~25-µm-diameter vicinity (Fig. 2f). The degree of local variability is probably influenced by passive mechanical inhomogeneities22 and could not be examined previously without a technique such as ours for visualizing individual sarcomeres.
We created three-dimensional models of muscle fibre structure from stacks of SHG images acquired at 0.5-µm depth increments within tissue (Supplementary Video 1). Construction of these models relied on the optical sectioning provided by SHG imaging, which like two-photon imaging generates signals from a spatially restricted laser focal volume23. In this way we verified that the muscle fibres we imaged were almost exactly parallel to the face of the endoscope, thus permitting us to make accurate sarcomere length determinations by imaging in the two lateral spatial dimensions (Supplementary Methods).
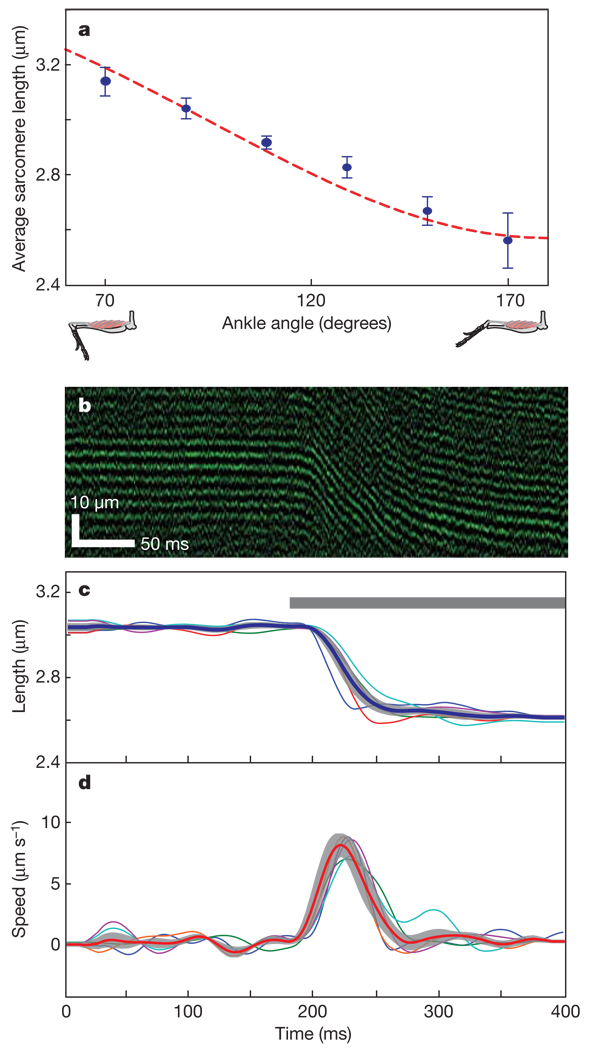
We next explored whether sarcomere lengths could be measured at different body positions. In the gastrocnemius of anaesthetized mice (n = 7), sarcomere lengths depended on the angle of the ankle (Fig. 3a) due to changes in total muscle length. Across mouse subjects, sarcomere lengths shortened from 3.15 ± 0.06 µm (mean ± s.e.m) to 2.55 ± 0.14 µm during changes in ankle angle from 70° to 170°. This matches the operating range of 3.18–2.58 µm that we estimated on the basis of a biomechanical analysis24 using measurements of muscle length, pennation angle, moment arm length, and an assumed optimal sarcomere length of 2.8 µm for a 120° ankle angle.
Figure 3. Dynamic imaging of mouse sarcomeres.
a, Mean (± s.e.m) sarcomere lengths versus ankle angle, measured in the lateral gastrocnemius of seven anaesthetized mice using a 1-mm-diameter microendoscope placed on the muscle. The dashed line is a computed estimate based on the muscle’s length and its moment arm from the joint’s center of rotation (see Methods). b, Line-scan image along the axis of a muscle fibre in the gastrocnemius during supra-maximal electrical stimulation. c, Average sarcomere length changes during electrical stimulation (n = 5 mice). The grey bar indicates the period of stimulation. d, Average sarcomere velocities derived from c. Shaded regions in c and d represent the mean ± s.e.m. of the five traces.
We further examined whether microendoscopy could capture the dynamics of sarcomere contractions. Because these dynamics elapse over milliseconds, we performed laser line-scans at 200–1,000 Hz perpendicularly across rows of sarcomeres undergoing changes in length. To induce muscle contraction in anaesthetized mice, we electrically stimulated the gastrocnemius proximal to the site of microendoscopy (Supplementary Methods). This triggered contraction, which we visualized with ~1–3-ms time resolution (Fig. 3b). Across multiple mice (n = 5) in which the microendoscope was inserted a similar distance from the ankle, mean sarcomere length was 3.05 ± 0.02 µm (s.e.m.) before stimulation and 2.55 ± 0.03 µm afterwards (Fig. 3c). Mean contraction speed peaked at 8.00 ± 0.05 µm s−1 (s.e.m.) during electrical stimulation (Fig. 3d), which is within the range of maximum speeds (7.12–13.17 µm s−1) reported in studies of single fast mouse muscle fibres responding in vitro to a chemical stimulus25.
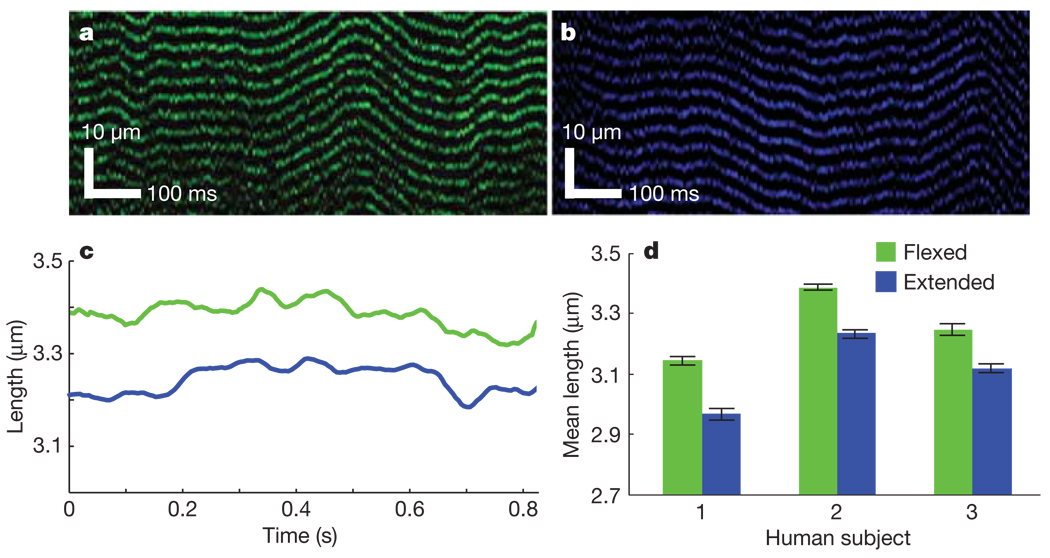
To demonstrate the applicability of microendoscopy to studies and diagnostics in humans, we visualized individual sarcomeres within the extensor digitorum muscle of healthy human subjects (n = 3). After placing a 20-gauge hypodermic tube into the extensor digitorum, we inserted a 350-µm-diameter microendoscope through the tube and into the muscle. The hypodermic was removed and the microendoscope held in place. The subject’s arm was placed in a brace, immobilizing the forearm and wrist but leaving the fingers mobile. After commencing SHG imaging we were able to visualize sarcomeres and their length fluctuations. Motion artefacts were often substantial but were reduced by bracing the limb. This tactic does not eliminate artefacts caused by involuntary muscle twitching, which could only be overcome by increasing the laser-scanning speed to 400–1,000 Hz. Subjects were asked to move their fingers into fully flexed (Fig. 4a) and extended (Fig. 4b) positions. Systematic variations in sarcomere length between these two positions were evident across all subjects, but each person exhibited slightly different ranges of sarcomere operation (Fig. 4c, d). With fingers flexed, mean sarcomere lengths from three subjects were 3.15 ± 0.03 µm, 3.39 ± 0.01 µm and 3.25 ± 0.05 µm(n = 12, 17 and 11 trials, respectively); with fingers extended, these values were 2.97 ± 0.03 µm, 3.24 ± 0.02 µm and 3.12 ± 0.02 µm (n = 10, 10 and 7 trials), illustrating our ability to determine how human sarcomere lengths depend on body posture. Subjects reported feeling only mild discomfort during imaging sessions due to insertion of the microendoscope, indicating a potential suitability for eventual use during routine diagnostics of human sarcomere function.
Figure 4. Dynamic imaging of human sarcomeres.
a, b, Line-scan image acquired at 488 Hz in the extensor digitorum muscle of a human subject using a 350-µm-diameter microendoscope with digits of the hand held flexed (a) or extended (b). c, Mean sarcomere length from a and b. d, Average sarcomere length taken from multiple images in each of three human subjects with the digits held in the flexed (n = 12, 17 and 11 trials, respectively) and extended (n = 10, 10 and 7 trials, respectively) positions. Error bars, s.e.m.
Growing evidence from tissue biopsies indicates that sarcomere structure and lengths are altered in numerous neuromuscular disorders that result from mutations in sarcomeric proteins9,26,27. Visualization of sarcomeres by microendoscopy may prove clinically valuable for diagnosing the severity of these conditions, monitoring progression and assessing potential treatments. Other syndromes in which monitoring sarcomere lengths might inform treatment choices include geriatric muscle loss and contractures caused by cerebral palsy or stroke27,28. Combined SHG and two-photon microendoscopy of sarcomere lengths and fluorescent sensors or proteins in mouse models of disease should lead to improved understanding of muscle biology and pathophysiology. Intraoperative sarcomere imaging during orthopedic reconstructions or tendon transfers might allow surgeons to identify and set optimal sarcomere operating ranges29. By reducing reliance on unproven assumptions, such as regarding the distribution of sarcomere lengths, in vivo sarcomere measurements will improve the biomechanical models that inform understanding of human motor performance and development of rehabilitation technology, robotics and prosthetic devices10,30.
METHODS SUMMARY
Instrumentation
In vivo imaging was performed on a laser-scanning microscope (Prairie) equipped with a wavelength-tunable titanium–sapphire laser (Mai Tai, Spectra-Physics) and adapted to accommodate a microendoscope4,13. In most SHG studies, we used 920-nm illumination. Epi-detected emission was band-pass filtered (ET460/50m, Chroma). A × 10 0.25 numerical aperture (NA) objective (Olympus, PlanN) focused illumination onto the microendoscope. Static images were acquired at 512 × 512 pixels with 8-µs pixel dwell time. Line scans were 256–512 pixels long with 4-µs dwell time.
Animal imaging
After anaesthetizing adult C57bl/6 mice, we placed a microendoscope inside or at the top of the muscle by means of a small skin incision. We used 1-mm- and 350-µm-diameter doublet microendoscopes (Grintech), exhibiting 0.48 and 0.4 NA and 250-µm and 300-µm working distances in water, respectively 4,13.
Human imaging
Under sterile conditions, a stainless-steel-clad 350-µm-diameter microendoscope was inserted into the proximal region of extensor digitorum by means of a 20-gauge hypodermic needle. We used a 350-µm-diameter microendoscope (Grintech) with a 1.75 pitch relay and a 0.15 pitch objective of 0.40 NA and 300-µm-working distance.
Data analysis
Mean sarcomere lengths in static and dynamic images were computed in Matlab (Mathworks) by calculating the autocorrelation across an image region that was one pixel wide and parallel to the muscle fibre’s long axis. An eleventh-order Butterworth band-pass filter selective for 1–5-µm periods was applied to the autocorrelation. Fitting a sine to the resultant filtered signal yielded the dominant periodicity and mean sarcomere length. Analysis of length variations (Fig. 2f) relied on measurements of individual sarcomere lengths performed at each pixel by finding distances between successive intensity peaks along a line parallel to the fibre’s long axis. The locations of these peaks were found by fitting a one-dimensional gaussian to each high-intensity region. A 2 × 5 pixel median filter, with long axis aligned to the muscle fibre, smoothed the resultant image of sarcomere lengths.
Supplementary Material
Acknowledgements
We thank M. Cromie and B. Flusberg for technical assistance, M. Cromie and A. Lewis for assistance with the human subject protocol, D. Profitt for expert machining, and Y. Goldman, R. Lieber, F. Zajac and T. Sanger for discussions. This work was supported by the Coulter Foundation (S.L.D. and M.J.S.), a Stanford Bio-X Interdisciplinary Initiatives award (S.L.D. and M.J.S.), NINDS R01NS050533 (M.J.S.), the Stanford-NIH Medical Scientist Training Program (M.E.L.), the Stanford-NIH Biophysics Training Grant (R.P.J.B.), and an equipment donation from Prairie Technologies, Inc. (M.J.S.).
Footnotes
Supplementary Information is linked to the online version of the paper at http://www.nature.com/nature.
Author Contributions All authors designed the experiments and interpreted data. M.E.L. and R.P.J.B collected data. M.E.L. performed the analysis. All authors discussed the results and contributed to the text.
Author Information Reprints and permissions information is available at http://www.nature.com/reprints. The authors declare competing financial interests: details accompany the paper on www.nature.com/nature.
References
- 1.Telley IA, Denoth J. Sarcomere dynamics during muscular contraction and their implications to muscle function. J. Muscle Res. Cell Motil. 2007;28:89–104. doi: 10.1007/s10974-007-9107-8. [DOI] [PubMed] [Google Scholar]
- 2.Lieber RL, Loren GJ, Friden J. In vivo measurement of human wrist extensor muscle sarcomere length changes. J. Neurophysiol. 1994;71:874–881. doi: 10.1152/jn.1994.71.3.874. [DOI] [PubMed] [Google Scholar]
- 3.Yeh Y, Baskin RJ, Lieber RL, Roos KP. Theory of light diffraction by single skeletal muscle fibers. Biophys. J. 1980;29:509–522. doi: 10.1016/S0006-3495(80)85149-6. [DOI] [PMC free article] [PubMed] [Google Scholar]
- 4.Jung JC, Schnitzer MJ. Multiphoton endoscopy. Opt. Lett. 2003;28:902–904. doi: 10.1364/ol.28.000902. [DOI] [PubMed] [Google Scholar]
- 5.Campagnola PJ, Loew LM. Second-harmonic imaging microscopy for visualizing biomolecular arrays in cells, tissues and organisms. Nature Biotechnol. 2003;21:1356–1360. doi: 10.1038/nbt894. [DOI] [PubMed] [Google Scholar]
- 6.Zipfel WR, et al. Live tissue intrinsic emission microscopy using multiphoton-excited native fluorescence and second harmonic generation. Proc. Natl Acad. Sci. USA. 2003;100:7075–7080. doi: 10.1073/pnas.0832308100. [DOI] [PMC free article] [PubMed] [Google Scholar]
- 7.Huxley AF, Niedergerke R. Structural changes in muscle during contraction; interference microscopy of living muscle fibres. Nature. 1954;173:971–973. doi: 10.1038/173971a0. [DOI] [PubMed] [Google Scholar]
- 8.Huxley H, Hanson J. Changes in the cross-striations of muscle during contraction and stretch and their structural interpretation. Nature. 1954;173:973–976. doi: 10.1038/173973a0. [DOI] [PubMed] [Google Scholar]
- 9.Laing NG, Nowak KJ. When contractile proteins go bad: the sarcomere and skeletal muscle disease. Bioessays. 2005;27:809–822. doi: 10.1002/bies.20269. [DOI] [PubMed] [Google Scholar]
- 10.Delp SL, et al. OpenSim: open-source software to create and analyze dynamic simulations of movement. IEEE Trans. Biomed. Eng. 2007;54:1940–1950. doi: 10.1109/TBME.2007.901024. [DOI] [PubMed] [Google Scholar]
- 11.Cutts A. The range of sarcomere lengths in the muscles of the human lower limb. J. Anat. 1988;160:79–88. [PMC free article] [PubMed] [Google Scholar]
- 12.Goulding D, Bullard B, Gautel M. A survey of in situ sarcomere extension in mouse skeletal muscle. J. Muscle Res. Cell Motil. 1997;18:465–472. doi: 10.1023/a:1018650915751. [DOI] [PubMed] [Google Scholar]
- 13.Jung JC, Mehta AD, Aksay E, Stepnoski R, Schnitzer MJ. In vivo mammalian brain imaging using one- and two-photon fluorescence microendoscopy. J. Neurophysiol. 2004;92:3121–3133. doi: 10.1152/jn.00234.2004. [DOI] [PMC free article] [PubMed] [Google Scholar]
- 14.Levene MJ, Dombeck DA, Kasischke KA, Molloy RP, Webb WW. In vivo multiphoton microscopy of deep brain tissue. J. Neurophysiol. 2004;91:1908–1912. doi: 10.1152/jn.01007.2003. [DOI] [PubMed] [Google Scholar]
- 15.Rothstein EC, Carroll S, Combs CA, Jobsis PD, Balaban RS. Skeletal muscle NAD(P)H two-photon fluorescence microscopy in vivo: topology and optical inner filters. Biophys. J. 2005;88:2165–2176. doi: 10.1529/biophysj.104.053165. [DOI] [PMC free article] [PubMed] [Google Scholar]
- 16.Hoppeler H, Fluck M. Plasticity of skeletal muscle mitochondria: structure and function. Med. Sci. Sports Exerc. 2003;35:95–104. doi: 10.1249/01.MSS.0000043292.99104.12. [DOI] [PubMed] [Google Scholar]
- 17.Plotnikov SV, Millard AC, Campagnola PJ, Mohler WA. Characterization of the myosin-based source for second-harmonic generation from muscle sarcomeres. Biophys. J. 2006;90:693–703. doi: 10.1529/biophysj.105.071555. [DOI] [PMC free article] [PubMed] [Google Scholar]
- 18.Schurmann S, Weber C, Fink RH, Vogel M. In: Multiphoton Microscopy in the Biomedical Sciences VII. Ammasi P, Peter TCS, editors. Vol. 6442. Bellingham, WA,: SPIE; 2007. 64421U. [Google Scholar]
- 19.Chu SW, et al. Studies of chi(2)/chi(3) tensors in submicron-scaled bio-tissues by polarization harmonics optical microscopy. Biophys. J. 2004;86:3914–3922. doi: 10.1529/biophysj.103.034595. [DOI] [PMC free article] [PubMed] [Google Scholar]
- 20.Moreaux L, Sandre O, Charpak S, Blanchard-Desce M, Mertz J. Coherent scattering in multi-harmonic light microscopy. Biophys. J. 2001;80:1568–1574. doi: 10.1016/S0006-3495(01)76129-2. [DOI] [PMC free article] [PubMed] [Google Scholar]
- 21.Zoumi A, Yeh A, Tromberg BJ. Imaging cells and extracellular matrix in vivo by using second-harmonic generation and two-photon excited fluorescence. Proc. Natl Acad. Sci. USA. 2002;99:11014–11019. doi: 10.1073/pnas.172368799. [DOI] [PMC free article] [PubMed] [Google Scholar]
- 22.Perreault EJ, Day SJ, Hulliger M, Heckman CJ, Sandercock TG. Summation of forces from multiple motor units in the cat soleus muscle. J. Neurophysiol. 2003;89:738–744. doi: 10.1152/jn.00168.2002. [DOI] [PubMed] [Google Scholar]
- 23.Campagnola PJ, et al. Three-dimensional high-resolution second-harmonic generation imaging of endogenous structural proteins in biological tissues. Biophys. J. 2002;82:493–508. doi: 10.1016/S0006-3495(02)75414-3. [DOI] [PMC free article] [PubMed] [Google Scholar]
- 24.Delp SL, et al. An interactive graphics-based model of the lower extremity to study orthopaedic surgical procedures. IEEE Trans. Biomed. Eng. 1990;37:757–767. doi: 10.1109/10.102791. [DOI] [PubMed] [Google Scholar]
- 25.Pellegrino MA, et al. Orthologous myosin isoforms and scaling of shortening velocity with body size in mouse, rat, rabbit and human muscles. J. Physiol. (Lond.) 2003;546:677–689. doi: 10.1113/jphysiol.2002.027375. [DOI] [PMC free article] [PubMed] [Google Scholar]
- 26.Clarkson E, Costa CF, Machesky LM. Congenital myopathies: diseases of the actin cytoskeleton. J. Pathol. 2004;204:407–417. doi: 10.1002/path.1648. [DOI] [PubMed] [Google Scholar]
- 27.Plotnikov SV, et al. Measurement of muscle disease by quantitative second-harmonic generation imaging. J. Biomed. Opt. doi: 10.1117/1.2967536. (in the press) [DOI] [PubMed] [Google Scholar]
- 28.Ponten E, Gantelius S, Lieber RL. Intraoperative muscle measurements reveal a relationship between contracture formation and muscle remodeling. Muscle Nerve. 2007;36:47–54. doi: 10.1002/mus.20780. [DOI] [PubMed] [Google Scholar]
- 29.Lieber RL, Murray WM, Clark DL, Hentz VR, Friden J. Biomechanical properties of the brachioradialis muscle: implications for surgical tendon transfer. J. Hand Surg. (Am.) 2005;30:273–282. doi: 10.1016/j.jhsa.2004.10.003. [DOI] [PubMed] [Google Scholar]
- 30.Manal K, Gonzalez RV, Lloyd DG, Buchanan TS. A real-time EMG-driven virtual arm. Comput. Biol. Med. 2002;32:25–36. doi: 10.1016/s0010-4825(01)00024-5. [DOI] [PubMed] [Google Scholar]
Associated Data
This section collects any data citations, data availability statements, or supplementary materials included in this article.


